Download presentation
Presentation is loading. Please wait.

1
APES year in review 2015, The year everyone gets a 5!

2
Introduction Understand how natural world works Understand how human systems interact with natural system Accurately determine environmental problems Develop and follow a sustainable relationship with natural world

3
Easter Island Sustainability - A system/process can continue indefinitely without depleting resources used. *no sacrifice to future generations* Stewardship Caring for something that does not belong to you Sound Science Use the scientific method

4
A. Human population growth More than 6.3 billion people currently last 25 yrs population grew by 2 billion projected that population will be 10 billion by 2050 increase pop → increase need for resources

5
B. Soil degradation Demand for food destroys the soil erosion minerals in soil are depleted salinization increased use of pesticides Overuse of fresh water

6
C. Global Atmospheric Changes Global Warming CO 2 produced from fossil fuel burning acts like a blanket around the earth. Plants take CO 2 out of the atmosphere through photosynthesis 6CO 2 +6H 2 O => 60 2 + C 6 H 12 O 6 Ozone depletion Chemicals released from the surface of the earth destroy our ozone shield. No stratospheric ozone, no protection from the UV rays of the sun.

7
D. Loss of Biodiversity Habitat destruction leads to a loss of many species starting with the plants exact # of species lost is unknown because not all species are identified strong ecosystems need biodiversity 1959-1980 25% of all prescription drugs from natural resources Wild species keep domestic species vigorous Aesthetics

8
Rachel Carson was a scientist who wrote Silent Spring in 1962. It addressed the growing use of pesticides (DDT) and their unpredicted effects on song birds. Original users of pesticides did not know that the poisons used to kill insects would accumulate in other living things and kill them too. BIOACCUMULATION
 and their unpredicted effects on song birds. Original users of pesticides did not know that the poisons used to kill insects would accumulate in other living things and kill them too. BIOACCUMULATION.")
9
More Cool Environmentalist John Muir – Sierra Club Ansel Adams – Photography (Yosemite) Aldo Leopold – Sand County Almanac Henry David Thoreau – Walden Garrett Hardin – Tragedy of the Commons
 Aldo Leopold – Sand County Almanac Henry David Thoreau – Walden Garrett Hardin – Tragedy of the Commons")
10
Ecosystems Levels of organization of matter Universe Ecosphere/biosphere Ecosystems Communities Populations Organisms Cells Atoms

11
Plants and animals interacting with their abiotic environment. Ecosystems exist in biomes. Climate – ave temperature over time *Weather – daily variations in temp and precipitation Microclimate and Other Abiotic Factors * light intensity * Soil type * topography Ecosystems

12
Trophic Relationship Food webs Trophic levels * producers * herbivores *primary carnivores

13
Biomass and Biomass Pyramid All biomass gets its energy from the sun Only 10% of energy from one trophic level moves to the next trophic level Energy released is high potential energy molecules (like glucose) then converted to low potential energy molecules (like carbon dioxide) * concept of eating lower on the biomass pyramid
 then converted to low potential energy molecules (like carbon dioxide) * concept of eating lower on the biomass pyramid")
14
Relationships Mutualism * Flowers & insects Commensalism Predator/prey host parasite Parasitism Competition habitat vs. niche

15
Limiting Factors Temperature, light, oxygen, carbon dioxide, precipitation Optimum levels Zones of stress Limits of Tolerance Range of Tolerance Synergistic effects – The interaction of two or more factors is greater than the sum of the effects when each acts alone. Example: pollution and disease

16
Ecosystems, how they work Recycle or Die All matter is recycled through the lithosphere, hydrosphere, and atmosphere. Nothing is created nothing is destroyed All stable ecosystems recycle matter and get energy from the sun (plants trap about 1% of sunlight)
.")
17
Physics Energy is measured in calories Calorie – amount of heat needed to raise 1 gram of water 1 degree Celsius. Kilocalorie = 1,000 calories 1 st law of thermodynamics Energy cannot be created nor destroyed, only change forms (light to chemical) 2 nd law of thermodynamics Energy transformation increases disorder (entropy) of the universe. Heat is the lowest grade of energy.
 2 nd law of thermodynamics Energy transformation increases disorder (entropy) of the universe. Heat is the lowest grade of energy..")
18
Chemistry Atoms – basic units of matter Electron Proton Neutron Chemical bonds - how atoms are held together Ionic Covalent Molecule/compound – two or more atoms bonded together pH scale Base/alkaline Acid

19
Organic Compounds C-C bonds and/or C-H bonds They can be natural or synthetic Natural: compounds that make up living systems Synthetic: man-made compounds

20
Photosynthesis Very inefficient (Only 1% of the energy from the sun is used) Chlorophyll – absorbs light to drive photosynthesis Plants use glucose to: Construct other molecules Build their cell wall Store energy Source of energy
 Chlorophyll – absorbs light to drive photosynthesis Plants use glucose to: Construct other molecules Build their cell wall Store energy Source of energy")
21
Carbon cycle Remember the carbon cycle presentation Photosynthesis! Moving fossil fuels (which took millions of years to form) to the atmosphere (in hundreds of years) is a major component of global warming. Hydrocarbon fuels to CO 2
 to the atmosphere (in hundreds of years) is a major component of global warming. Hydrocarbon fuels to CO 2.")
22
Nitrogen cycle Main reserve in the atmosphere Living things must get N from ammonium (NH 4 ) or nitrate (NO 3 ) N from the atmosphere must be fixed Change N 2 into ammonium or nitrate Rhizobium (bacteria living in roots of legumes) fig 3-10 Industrial Lightning Burning fossil fuels
 or nitrate (NO 3 ) N from the atmosphere must be fixed Change N 2 into ammonium or nitrate Rhizobium (bacteria living in roots of legumes) fig 3-10 Industrial Lightning Burning fossil fuels")
23
Phosphorus cycle No gas phase, only solid and liquid Man-made fertilizers contain organic phosphates Because P is a limiting factor in aquatic systems, it leads to eutrophication when in excess The rain forest is very good at recycling P, except when we cut it down…

24
element Main nonliving reservoir Main living reservoir Other nonliving reservoir Human-induced problem Carbon C Atmo CO2 Carbohydrate s (CH2O)n And all organic molecules Hydro Carbonate (CO3-2) Bicarbonate (HCO3-) Litho minerals Global warming Carbon from fossil fuels underground are burned and released into the air as CO2 Nitrogen N Atmo N2 Proteins and other N- containing organic molecules Hydro Ammonium NH4+ Nitrate NO3- Nitrite NO2- Eutrophication Fertilizers contain human-made nitrates that end up in the water Phos- phorous P Litho rocks as PO4-3 *no gas phase DNA ATP phospholipids Hydro Phosphate PO4-3 Eutrophication Fertilizers contain human-made phosphates that end up in the water Cutting down rainforest stops recycling of P
n And all organic molecules Hydro Carbonate (CO3-2) Bicarbonate (HCO3-) Litho minerals Global warming Carbon from fossil fuels underground are burned and released into the air as CO2 Nitrogen N Atmo N2 Proteins and other N- containing organic molecules Hydro Ammonium NH4+ Nitrate NO3- Nitrite NO2- Eutrophication Fertilizers contain human-made nitrates that end up in the water Phos- phorous P Litho rocks as PO4-3 *no gas phase DNA ATP phospholipids Hydro Phosphate PO4-3 Eutrophication Fertilizers contain human-made phosphates that end up in the water Cutting down rainforest stops recycling of P")
25
Population and Succession Top 6 most abundant elements in living things (not in order) * NCHOPS Top 8 elements in the earths crust (in order) * O, Si, Al, Fe (iron), Ca, Na (sodium), P, Mg Remember to get a good night’s sleep the night before the test!!.
 * NCHOPS Top 8 elements in the earths crust (in order) * O, Si, Al, Fe (iron), Ca, Na (sodium), P, Mg Remember to get a good night’s sleep the night before the test!!.")
26
Biosphere II (remember our biospheres) Purpose: recreate conditions of Earth (Biosphere I) * to understand our world better * space travel 5 acres in Arizona, 4000 species, 10 humans * problem: 0 2 + CO 2 were absorbed by concrete * ants and cockroaches took over
 Purpose: recreate conditions of Earth (Biosphere I) * to understand our world better * space travel 5 acres in Arizona, 4000 species, 10 humans * problem: CO 2 were absorbed by concrete * ants and cockroaches took over")
27
Fires in Ecosystem Maintain balance of species and energy in ecosystems over the long run. Beneficial b/c provide nutrients for soil We avoid natural fires, but the problems like Crown Fires- (not natural) kill the whole tree 1988 Yellowstone fires changed climax ecosystems of white bark pine trees to huckle berries. Grizzlies eat both
 kill the whole tree 1988 Yellowstone fires changed climax ecosystems of white bark pine trees to huckle berries. Grizzlies eat both.")
28
Succession - One species gradually replaced by another in an ecosystem Primary – new ecosystem where there were no living things before. Cooled lava, receded glacier, mud slide Secondary- ecosystem used to be there. Fire, humans clear an area Aquatic – lakes taken over by terrestrial ecosystem Climax ecosystem- in balance only changes if major interference

29
Primary succession Must create new soil for plants to grow The first plants to come in are called pioneer species Lichen Moss Microbes

30
Evolutionary Change Vocabulary that you need to know * DNA * Chromosome * Gene * allele Central Dogma: DNA- blueprint RNA- carpenter Protein- house, wood

31
Mutations Mutations are naturally random events * Normal variation * Chemical * UV * Radiation Genetic Trait- only passed down if an organism reproduces

32
Why do species change? Environmental resistance and biotic potential Selective pressure on mutations Speciation * creation of a new species based on reproductive isolation Remember genetic drift; allopatric speciation and sympatric speciation

33
Speciation (Galapagos Finches)
")
34
Geological Context (space and time for evolution) Plate tectonics Geological time scale (fig. 5-21) Cambrian explosion Selective breeding Artificial selection Natural selection
 Cambrian explosion Selective breeding Artificial selection Natural selection.")
35
World population trends Calculations Demographic transition Age structure diagrams Developed vs. developing countries Fertility rates World bank 1994 UN conference in Cairo- program of action The Human Population

36
(b) crude birth rate= number birth per 1000 individuals (d) crude death rate= number death per 1000 individuals (r) growth rate = natural increase in population expressed as percent per years (If this number is negative, the population is shrinking.) equation: rate = birth – death + immigration-emigration But other factors affect population growth in a certain area…
 crude birth rate= number birth per 1000 individuals (d) crude death rate= number death per 1000 individuals (r) growth rate = natural increase in population expressed as percent per years (If this number is negative, the population is shrinking.) equation: rate = birth – death + immigration-emigration But other factors affect population growth in a certain area…")
37
Population growth rates increase populationdecrease population births deaths immigration emigration (exit) r = (birth - death)+ (immigration-emigration) immigration = migration of individuals into a population from another area or country emigration = migration of individuals from a population bound for another country
 r = (birth - death)+ (immigration-emigration) immigration = migration of individuals into a population from another area or country emigration = migration of individuals from a population bound for another country")
38
r = (birth - death)+ (immigration-emigration) B D I E r=( 10/1000) – (5/1000) + (1/1000) – (10/1000) r=(0.01-0.005) + (0.001 – 0.01) r = 0.005 – 0.009 = -0.004 or –0.4% per year example: population of 10,000 has 100 births (10 per 1000) 50 deaths (5 per 1000) 10 immigration (1 per 1000) 100 emigration (10 per 1000) You try.
+ (immigration-emigration) B D I E r=( 10/1000) – (5/1000) + (1/1000) – (10/1000) r=( ) + (0.001 – 0.01) r = – = or –0.4% per year example: population of 10,000 has 100 births (10 per 1000) 50 deaths (5 per 1000) 10 immigration (1 per 1000) 100 emigration (10 per 1000) You try.")
39
If the growth rate is 1% and the population size is 10,000, how many years will it take to get to a population of 40,000? Population doubling: In 140 years, the population will be 40,000 people. SHOW YOUR WORK!!!!!!!!! (70 years)(2) =140 years Called the rule of 70 (not exact, but acceptable) 2 D.T. 40,000 1 D.T. 20,000 In 70 years the population will be 20,000 70/rate =70/1% =70 years to double
(2) =140 years Called the rule of 70 (not exact, but acceptable) 2 D.T. 40,000 1 D.T. 20,000 In 70 years the population will be 20,000 70/rate =70/1% =70 years to double.")
41
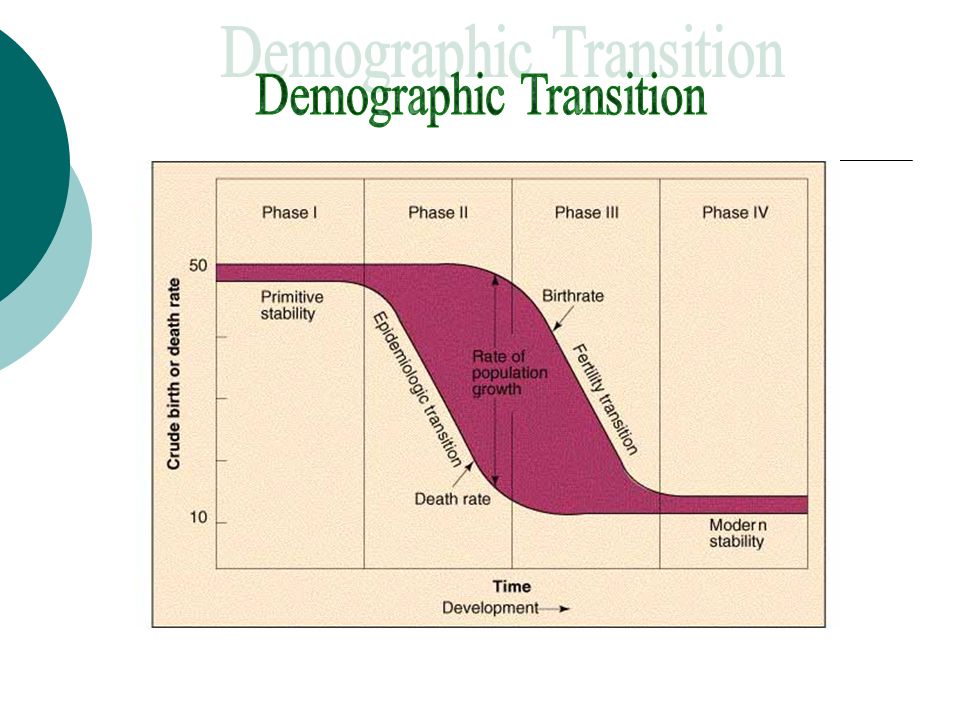
The transition from a primitive or developing society to a “modern” or developed society Phase 1 = deaths and births are high (epidemiological) Phase 2 = death rate begins to decrease (fertility) Phase 3 = birth rate drops and death rate flattens out Phase 4 = modern stability There is little population growth in phase 1 but in phase 4 people live longer and have fewer children and the population grows. Demographic Transition

42
IPAT Formula: calculates human pressure on the environment (I = P x A x T) I = environmental impact P = population A = affluence and consumptive patterns T = level of technology in the society Or should it be I = PxAxT/S (S = Stewardly Concern/Practice) Environmental impact of developing countries due to “P.” Environmental impact of developed countries due to “A” and “T.”
 I = environmental impact P = population A = affluence and consumptive patterns T = level of technology in the society Or should it be I = PxAxT/S (S = Stewardly Concern/Practice) Environmental impact of developing countries due to P. Environmental impact of developed countries due to A and T.")
43
Bottom Line= as countries develop, first their death rate drops and then their birth rate drops Reasons for the phases: Phase II: medical care nutrition (births still high) technology Phase III: birth control education (of women) lower mortality rate of infants less child labor
 technology Phase III: birth control education (of women) lower mortality rate of infants less child labor")
44
Developed Countries Canada, U.S., Australia, Western Europe (Denmark) Developing Countries Latin America, China, Africa (Kenya) 1/5 of the world’s pop. Lives in absolute poverty, illiterate, lack clean H2O and don’t have enough food 80% of world’s pop. Lives in developing co. and growing

45
Disparities Developed countries 15% of the world’s population Control 80% of the world’s wealth Low-income developing countries 37% of the world’s population Control 3.0% of the world’s gross national income Difference in per capita income: 63 to 1!

46
Total fertility= avg. # of children born per woman For developed countries = 2.1 For developing countries = 2.6 Fertility of 2.0= replacement level Under 2.0 = shrinking population Over 2.0 = growing pop. For developed countries = 2.1 For developing countries = 2.6(or higher)
.")
47
Special agency of the United Nations Receives $$ from developed co. and loans $$ to developing co. Sometimes this backfires by increasing debt Oversees all types of issues, not just environmental issues Ex. electricity, roads, new modern technology

48
Soil

49
Humus- dark, soft, spongy residue of organic matter as a result of decomposition of organic matter such as leaves and dead wood 1 ۫ source of nutrients in soil systems O Horizon Top soil-mixture of humus and leachial mineral soil Thin roots extend into this layer A Horizon

50
E Horizon Eluviation process of leaching Minerals are “leached” into this layer from H 2 O moving downward Accumulation of elluvial organic matter Often high in iron, aluminum, calcium, and in clay content B Horizon LOAM: 40%sand 40% silt 20% clay Loam is theoretically the ideal soil

51
Classes of Soil Mollisols- very fertile, dark, found in temperate grasslands, best agricultural soil, Deep A horizon Oxisols- soil of tropical and subtropical rainforest layer of iron and Al oxides in B horizon, little O horizon Alfisols- weathered forest soil, not deep, but developed OAE+B typical of most temperate forest biome. Need fertilizer for agriculture Aridsols- dry lands + desert, lack of vegetation, lack of rain unstructured vertically, irrigation leads to salinization because of high evaporation.

52
Texture Sand 2.0-.02 mm Silt.02-.002 mm Clay.002mm ≥ some microscopic

53
LOAM: 40%sand 40% silt 20% clay Loam is theoretically the ideal soil

54
Figure 9-1 Earth’s water supply Ch 9: Water

55
Water Facts The primary use for fresh water in U.S. is for agriculture. In our homes, we use the most fresh water to wash, clean and flush. The typical person in an industrialized nation uses 700-1000 gallons per week!

56
Human effects on the Hydrologic Cycle Figure 9-3 The Hydrologic cycle

57
Figure 9-5a Global air circulation

58
Rain shadow Figure 9-6 Rain shadow

59
The Ogallala Aquifer Figure 9-16 Exploitation of an aquifer

60
Mono Lake Excellent example of human interference with the water supply. The water in the lake was diverted from the lake to the city of Los Angeles. It became a salt bed. ↑ Salt concentration due to evaporation Three Gorges Dam in China China needs to meet the growing demand for energy Huge environmental impact Hundreds of thousands of people will be displaced (not to mention the ecosystems which will be flooded)
.")
61
Genetically altered food, Irish Potato Famine Soil Erosion Loss of fertility Salinization Waterlogging Desertification Water Aquifer depletion Increased runoff and flooding from land cleared to grow crops Fish kills from pesticide runoff Surface and groundwater pollution from pesticides and fertilizers Over fertilization of lakes >> eutrophication Air Greenhouse gas emissions from fossil fuels Other air pollutants from fossil fuels Pollutions from pesticide sprays Chapter 10: Food

62
Major Environmental Effects of Food Production Biodiversity Loss Loss and degradation of habitat from clearing grasslands and forests and draining wetlands Fish kills from pesticide runoff Killing of wild predators to protect live stock Loss of genetic diversity from replacing thousands of wild crop strains with a few monoculture strains Human Health Nitrates in drinking water Pesticide residues in drinking water, food, and air Contamination of drinking and swimming water with disease organisms from livestock wastes

63
The Green Revolution To eliminate hunger by improving crop performance Movement to increase yields by using: New crop cultivars Irrigation Fertilizers Pesticides Mechanization Results: Did not eliminate famine Population still increasing Increase cost of production An increased negative environmental impact Didn’t work for everyone

64
Protection of Biodiversity and Ecosystems Threatened – if the trend continues, the species will be endangered. Endangered – if the trend continues, the species will go extinct. Pharmaceuticals and native plants Approximately 25% of drugs used as medicines come from natural plant sources. The Exxon Valdez Oil Spill (1989) 300,000 birds died as a result of that particular oil spill. The area, Prince William Sound, is still recovering.
 300,000 birds died as a result of that particular oil spill. The area, Prince William Sound, is still recovering..")
65
Know Specific Details about… These Endangered animals (and check Barron’s examples): Wild Turkey – a success story Whooping Crane- Eggs raised by sandhill cranes led to problems, but the efforts proved successful overall. Peregrine Falcon- DDT Spotted Owl- deforestation Fish living in George’s Bank (off New England)-The marketable fish were over fished and other species took over. An example of poor management of fisheries.
-The marketable fish were over fished and other species took over. An example of poor management of fisheries..")
66
Endocrine Disrupters Interfere with normal hormone action Can interfere with development Are often connected to cancer Can interfere with sexual activity (alligators) Are found in plastics and some pesticides
 Are found in plastics and some pesticides")
67
Coal-several (400) hundred years Oil- about a decade until supplies peak Natural Gas – at least a 50 year supply in the United States Fossil Fuels Exxon Valdez, Drilling in ANWR
 hundred years Oil- about a decade until supplies peak Natural Gas – at least a 50 year supply in the United States Fossil Fuels Exxon Valdez, Drilling in ANWR")
68
Important energy facts Brief history of energy *1700-1800 Fire wood *1900-1920 Coal *1950- now crude oil “production of crude oil” = with drawing it from reserves OPEC (pg 319) organization of petroleum exporting countries (Mid-east countries mainly)
 organization of petroleum exporting countries (Mid-east countries mainly)")
69
More Energy Facts We get 50% of our crude oil from foreign sources Alaska pipeline built to help increase production of domestic crude oil Types of coal: Peat (not coal) Lignite (brown coal) Bituminous coal (soft coal with high sulfur) Anthracite (hard coal with low sulfur)
 Lignite (brown coal) Bituminous coal (soft coal with high sulfur) Anthracite (hard coal with low sulfur)")
70
Oil: The Most Important Fossil Fuel in the American Economy Environmental Consequences 1. Production: local ecosystems damage possible 2. Transport: oil spills cause local and regional ecosystem damage 3. Use: photochemical smog, particulates, acid precipitation, carbon dioxide

71
Coal Environmental Consequences 1. Production: ecosystem damage, reclamation difficult, acid mine runoff, mine tailings, erosion, black lung, radon 2. Transport: energy intensive because of weight and number of train cars needed 3. Use: fossil fuel with largest source of carbon dioxide and greatest quantity of contaminants, large volume of waste, acid precipitation

72
Natural Gas Environmental Consequences: 1. Production: local ecosystem damage possible if oil or coal is part of the deposit 2. Transport: can be explosive 3. Use: produces the least air pollutants of all the fossil fuels Possibly a transition fuel between fossil fuel and alternative energy sources.

73
Electricity 1.Electricity is a secondary energy source because it relies on another energy source to create the electricity. 2.Basic production of electricity-boil water to produce steam to turn turbines to generate electron flow through a wire. 3.Examples of primary sources for electrical production 1.20% from nuclear 2.57% from coal 3.Oil, geothermal, solar, wind, hydroelectric (no boiling water required for these sources) Is electricity a clean energy source?
 Is electricity a clean energy source .")
74
A. Pros: No CO 2 emissions, no particulate emissions B. Cons: Radiation can lead to damaged DNA, costs, radioactive waste, thermal pollution C. Basically- the splitting of uranium’s nucleus gives off heat that can be used to boil water and turn a turbo generator to create electricity. D. Naturally occurring Uranium is mined. Nuclear Power

75
Nuclear important facts Fusion- the combination of 2 atoms to form a larger atom Fission- splitting an atom Nuclear Regulatory Commission is the US governmental Agency that regulates nuclear power plants Radioisotope= unstable radioactive isotope

76
Uranium Uranium 235 has 92 protons and 143 neutrons. It is radioactive and used as fuel in nuclear reactors. When U235 is hit by a neutron, it is split (fission) into two smaller elements such as Kr and Ba plus three neutrons which sustain the chain reaction. Most (99.3%) of the naturally occurring uranium is U238. For a nuclear reactor, this must be purified to 4% U235 and 96% U238. (very expensive)
 into two smaller elements such as Kr and Ba plus three neutrons which sustain the chain reaction. Most (99.3%) of the naturally occurring uranium is U238. For a nuclear reactor, this must be purified to 4% U235 and 96% U238. (very expensive).")
77
a. Water moderator: slows down neutrons b. Neutron-absorbing material- control rod c. Fuel Rods- approximately one third replaced each year d. Heat transfer system e. Cooling system f. Redundant safety systems D. How does a Power Plant Operate?

78
Waste Disposal All fuel rods are still in cooling ponds at commercial nuclear facilities Proposed site for disposal - Yucca Mountain in SE Nevada Concerns: Geological active area, Intrusion of water table, distances for wastes travel, radioactive decay and half-lives

79
Accidents Chernobyl: 4/26/86 Ukraine complete meltdown. Three Mile Island: 3/28/79 Pennsylvania (Harrisburg) partial meltdown, no one known to be hurt.
 partial meltdown, no one known to be hurt..")
80
Half Life Calculations Every radioactive element has a unique half life. This is the amount of time it will take for half of the radiation to decay. 100μCi 50μCi 25μCi in two half lives if the half life is 10 years then it will take 20 years. Accidents Chernobyl: 4/26/86 Ukraine, complete meltdown. Resulting in evacuation and resettlement of 200,000 people 2 people died during explosion 31 died from radiation poisoning, increase in thyroid cancer Three Mile Island: 3/28/79 Pennsylvania (Harrisburg) – partial meltdown, no one known to be hurt.
 – partial meltdown, no one known to be hurt..")
81
Renewable Energy Sunlight, wind, falling H 2 O, geothermal Not fossil fuels, not nuclear

82
Indirect Solar power How does it affect… Wind? Hydropower? Firewood? Hydro carbon fuels? Nuclear and Geothermal are not indirect solar

83
Solar Energy Passive solar Large south-facing windows, heavy drapes to trap heat at night, interior bricks to trap heat Shade windows in summer Even though back up systems are required, and solar heating may only lessen the need for heating oil a few %, it will help us adapt to diminishing oil supplies. Active solar Photovoltaic (PV) panels can be used to convert the energy from the sun into electricity. Electrons from the silicon in the PV panel are “pushed” through a wire by photons from the sun creating an electric current.
 panels can be used to convert the energy from the sun into electricity. Electrons from the silicon in the PV panel are pushed through a wire by photons from the sun creating an electric current..")
84
Risks and Pests Borneo (DDT), MTBE Hazard - Anything that causes: 1.Injury, disease, or death to humans 2.Damage to property 3.Destruction of the environment Cultural hazard - a risk that a person chooses to engage in Risk The probability of suffering (1, 2, or 3) as a result of a hazard Perception What people think the risks are
, MTBE Hazard - Anything that causes: 1.Injury, disease, or death to humans 2.Damage to property 3.Destruction of the environment Cultural hazard - a risk that a person chooses to engage in Risk The probability of suffering (1, 2, or 3) as a result of a hazard Perception What people think the risks are")
85
Cigarette Smoking Leading cause of cancer in U.S. Can cause cancer, lung disease, a bigger risk of death in addition with other types of air pollution. Highest health risk in U.S. Proving that chemical is a cause of cancer is hard because a long time may elapse between exposure and development of cancer

86
Insecticides/Pesticides Integrated pest management includes: adjusting environmental conditions chemical pesticides disease resistant varieties crop rotation biological controls Insecticides kills plants, mammals, fish, birds but are only supposed to kill insects A broad spectrum pesticide is effective towards many types of pests

87
DDT accumulates in fat body tissues of animals DDT was not used for handling weeds DDT is, persistent, synthetic organic compound and a subject to biomagnifications in food chains

88
Diseases Lyme disease can be processed to humans through a bite from an infected tick Mosquitoes causes Malaria, the vector for Plasmodium The protozoan of the genus Plasmodium is the causative agent of malaria

89
Diseases cont’d Lack of access to safe drinking water is a major cause of disease transmission in developing countries. Epidemiology is the study of the presence, distribution and control of a diseases in a population Morbidity is the incidence of disease in a population Mortality is the incidence of death in a population

90
Lethal dose at 50% = LD 50 The LD50 is a standardized measure for comparing the toxicity of chemicals. The LD50 is the dose that kills half (50%) of the animals tested in an experiment. LD50 tests result in the deaths of many laboratory animals and the data are often controversial. Oral LD50 in rats for DDT is 87 mg/kg. So what does that mean for humans? Threshold level of toxicity = The dose below which no lethal effects are observed and/or above which the lethal effects are apparent.
 of the animals tested in an experiment. LD50 tests result in the deaths of many laboratory animals and the data are often controversial. Oral LD50 in rats for DDT is 87 mg/kg. So what does that mean for humans. Threshold level of toxicity = The dose below which no lethal effects are observed and/or above which the lethal effects are apparent..")
91
Epidemiology is the study of the presence, distribution and control of a diseases in a population Morbidity is the incidence of disease in a population Mortality is the incidence of death in a population Diseases Lyme disease can be transferred to humans through a bite from an infected tick (vector) Mosquitoes are the vector for Malaria The protozoan of the genus Plasmodium is the causative agent of malaria
 Mosquitoes are the vector for Malaria The protozoan of the genus Plasmodium is the causative agent of malaria")
92
Water Pollution Sewage treatment is a common practice In the 1970’s many cities were still dumping raw sewage into waterways In 1972, the Clean water act provided funding for upgrading sewage treatment plants Currently water ways are the much better 1°, 2° use preliminary but no more Test for sewage contamination in drinking H2O Fecal Coliform test

93
Sewage Treatment Raw sewage (99% H2O) Preliminary Treatment- allow grit to settle 1° separating Raw Sludge from H2O 2° AKA Biological Treatment- bacteria feeds on the organic material Trickling filters contain bacteria remove raw sludge from the H2O Raw Sludge May contain heavy metals If it does it needs 3° treatment, to remove the toxic chemicals
 Preliminary Treatment- allow grit to settle 1° separating Raw Sludge from H2O 2° AKA Biological Treatment- bacteria feeds on the organic material Trickling filters contain bacteria remove raw sludge from the H2O Raw Sludge May contain heavy metals If it does it needs 3° treatment, to remove the toxic chemicals")
94
Sewage Treatment Preliminary Primary Secondary Tertiary

95
Home Septic Systems: do not use Chlorine Do use settling tank to settle organic solids Lets waste water percolate into the soil bacterial decomposition

96
Municipal Solid Waste 210,000,000 tons of municipal solid waste (MSW) are disposed of annually in the United States. Most of that waste is paper. Fifty-five percent of MSW is disposed of in landfills. 17% of MSW is combusted, mostly in waste-to-energy (WTE) combustion facilities. What are the advantages and disadvantages of WTE combustion? The best solution to solid waste problems is to reduce waste at its source. More than 75% of MSW is recyclable. What role is recycling playing in waste management, and how is recycling best promoted? Much more can be done to move MSW management in a more sustainable direction. What are some recommendations to improve MSW management?
 combustion facilities. What are the advantages and disadvantages of WTE combustion. The best solution to solid waste problems is to reduce waste at its source. More than 75% of MSW is recyclable. What role is recycling playing in waste management, and how is recycling best promoted. Much more can be done to move MSW management in a more sustainable direction. What are some recommendations to improve MSW management .")
97
Municipal Solid Waste 55.5% => Landfill 17.2% => Combustion 27.3% => Recycling Methane can be captured and used as a fuel Line with impermeable clay to prevent leachate from polluting ground H 2 O Cover daily with “clean fill” to reduce odor and pests Monitor peripheral wells for contamination Sanitary Landfill Done Right

98
Why would a city want a landfill? Environmental reasons: Decreases fuel cost for transport Stringent stand and yield positive results Current standards are better than old ones Trucks leak when transporting waste Monetary reasons: Cities must pay dumping fees Make $ from the methane Jobs Increase revenue from recycling

99
Hazardous Waste Halogenated hydrocarbons Organic compounds with a halogen (bromine, iodine, ect.) replacing a hydrogen Used as pesticides Used to make plastic Resistant to biodegradation
 replacing a hydrogen Used as pesticides Used to make plastic Resistant to biodegradation")
100
Chlorinated hydrocarbons Chlorinated hydrocarbons Are synthetic organic compounds Dioxin Mainly caused by burning PVC pipe (medical waste) Linked to cancer. Also an endocrine disruptor.

101
Love Canal, NY The government allowed housing to be build over the toxic waste dump and people got sick Problem first discovered in 1978 First national emergency in the US because of toxic waste Led to the superfund legislation. Superfund sites: $ comes from taxes on chemical industries 50% of the $ spent on legal costs Greatest threat to health and the environment

102
Toxic waste generated by households should be handled by toxic waste pick ups and public education. Toxicology & Chemical Hazards Dose Food Chains The Threat from Toxic Chemicals Heavy Metals Organic Compounds Dirty Dozen PERC MTBE

103
Layers of the Atmosphere Troposphere ---------Tropopause Stratosphere --------- Stratopause Mesosphere --------- Mesopause Thermosphere

104
Composition of the troposphere 78% N 2 20% O 2 Less than 2% H 2 O vapor (.01%-4%) Argon gas (1%) CO 2 (0.04%) Trace gases
 Argon gas (1%) CO 2 (0.04%) Trace gases")
105
Structure & Temp of Atmosphere Troposphere = lowest layer; tropics 10 miles (16km); higher altitudes 5 miles (8km) Water vapor & clouds Greenhouse gases Colder w/ altitude (generally) Pollutants reach top w/in a few days Tropopause ---- separate Troposphere from stratosphere
; higher altitudes 5 miles (8km) Water vapor & clouds Greenhouse gases Colder w/ altitude (generally) Pollutants reach top w/in a few days Tropopause ---- separate Troposphere from stratosphere")
106
Stratosphere - temp increases w/ altitude 40 miles - contains the ozone shield - Ozone absorbs UV radiation from the sun & filters the rays - No precipitation

107
Global Climate Change Global warming occurs when humans contribute too much of these greenhouse gases leading to a small (1-3 degree C) but significant rise in the global average temperature. Analogy – Car on a sunny day The greenhouse effect is natural and important to deep the earth warm enough for life to exist

108
CO 2 Fossil Fuel use Deforestation Methane (CH 4 ) Microbial fermentation (Landfill) Coal and oil deposits Natural gas pipelines Cows (manure) Methane is the second most important green house gas (next to CO 2 )
 Microbial fermentation (Landfill) Coal and oil deposits Natural gas pipelines Cows (manure) Methane is the second most important green house gas (next to CO 2 )")
109
Ozone (O 3 ) Stratospheric ozone is GOOD It shields us from the harmful UVB rays of the sun. Ozone depletion is the thinning of the stratospheric ozone shield (mostly over the South Pole, Australia story) Analogy – Stratospheric O 3 is like sunscreen for the earth. Tropospheric ozone is BAD If we breath it, it causes lung damage It is also a greenhouse gas
 Analogy – Stratospheric O 3 is like sunscreen for the earth. Tropospheric ozone is BAD If we breath it, it causes lung damage It is also a greenhouse gas.")
110
Analogy – Stratospheric O 3 is like sunscreen for the earth. The Making of Ozone O 2 + UVB (280 – 320 nm more energetic) O + O The free O bonds to existing O 2 (O + O 2 ) Ozone is made (O 3 ) O 2 + UVB O + O ; O + O 2 O 3
 O + O The free O bonds to existing O 2 (O + O 2 ) Ozone is made (O 3 ) O 2 + UVB O + O ; O + O 2 O 3.")
111
The Destruction of Ozone O 3 CFC – chlorofluorocarbons Cl – FC (UV rays breaks bond) The free Cl “attacks ozone” O 3 + Cl O 2 + (Cl – O) Cl – O is unstable so the bond will break and the Cl will “attack” another ozone molecule
 The free Cl attacks ozone O 3 + Cl O 2 + (Cl – O) Cl – O is unstable so the bond will break and the Cl will attack another ozone molecule")
112
Greenhouse Effect Troposphere Traps heat near the Earth’s surface Water vapor, carbon dioxide, methane Globing warming Ozone shield Stratosphere filters UV radiation Oxygen gas, Ozone gas Ozone depletion more UV cancer Where? What Happens ? Which gases? Problem ?

113
Air pollution Expensive: health care costs, human lives -acute - Chronic - Carcinogenic Damages buildings, bridges, statues, books Aesthetics Damage to Plants - Agriculture – crops loss ~$5 billion/year - Forests

114
Air Pollution Air pollutants consist of chemicals in the atmosphere that have harmful effects on living organisms and/or inanimate objects. Why Do We Care? (humans) o We inhale 20,000 liters of air each day o Causes 150,000 premature deaths in the world each year (53,000 in U.S.); aggravates other diseases o U.S. human health costs from outdoor air pollution range from $40 to $50 billion per year (CDC)
 o We inhale 20,000 liters of air each day o Causes 150,000 premature deaths in the world each year (53,000 in U.S.); aggravates other diseases o U.S. human health costs from outdoor air pollution range from $40 to $50 billion per year (CDC).")
115
Health impacts - acute – pollutants bring on life- threatening reactions w/in a period of hours or days; causes headache, nausea, irritation - Chronic – pollutants cause gradual deterioration of health over years and low exposure - Carcinogenic – pollutions that causes cancer e.g. benzene Why Do We Care? (not human) Damage to Plants - Agriculture – crops loss ~$5 billion/year
 Damage to Plants - Agriculture – crops loss ~$5 billion/year.")
116
- Forests – significant damage to Jeffrey and Ponderosa Pine along Sierra Nevada; tree growth declined 75% in San Bernardino Mountains - suspected to increase plant diseases and pests Damages buildings, bridges, statues, books Aesthetics: It looks ugly. We all try to avoid living in polluted areas (admit it…) Major Outdoor Air Pollutants o Primary – direct products of combustion and evaporation o Secondary – when primary pollutants undergo further reactions in atmosphere
 Major Outdoor Air Pollutants o Primary – direct products of combustion and evaporation o Secondary – when primary pollutants undergo further reactions in atmosphere.")
117
Acids and Bases pH-log of hydrogen ions in a solution. Therefore each number higher on the pH scale is 10X more basic Basic- OH- (hydroxyl ions) over 7 on the pH scale Acidic-H+ ions under 7 on the pH scale Neutral- pure water is 7 on the pH scale Normal rain is slightly acidic-pH 6.4 Acid rain is defined as less than a pH of 5.5
 over 7 on the pH scale Acidic-H+ ions under 7 on the pH scale Neutral- pure water is 7 on the pH scale Normal rain is slightly acidic-pH 6.4 Acid rain is defined as less than a pH of 5.5.")
118
Sources Natural: a. Sulfur: Volcanoes, sea spray, microbial b. Nitrogen oxides: lightening, forest fires, microbial Anthropogenic (human caused) a. Sulfur oxides: coal burning plants, industry, fossil fuels. b. Nitrogen oxides: power plants, industrial fuel combustion, transportation c. Effect areas hundreds of miles from the source of emissions, generally not the whole globe d. Both sulfur oxides and nitrogen oxides are primary components of acid rain.
 a. Sulfur oxides: coal burning plants, industry, fossil fuels. b. Nitrogen oxides: power plants, industrial fuel combustion, transportation c. Effect areas hundreds of miles from the source of emissions, generally not the whole globe d. Both sulfur oxides and nitrogen oxides are primary components of acid rain..")
119
Indoor Air Pollutants 1. Types: benzene, formaldehyde, radon, cigarette smoke 2. Sources: off gassing from furniture, rugs and building materials, dry cleaning, cleaning fluids, disinfectants, pesticides, heaters 3. Buildings with too many indoor air pollutants are called “sick buildings” because more than 20% of the people are sick due to occupying the building.

120
Major Outdoor Air Pollutants Primary – direct products of combustion and evaporation Secondary – when primary pollutants undergo further reactions in atmosphere 1. Suspended particulate matter (primary) 2. Volatile Organic Compounds (secondary) 3. Carbon Monoxide (primary) 4. Nitrogen Oxides (can be both) 5. Sulfur Oxides(primary from combustion of coal) 6. Ozone and other photochemical oxidants (secondary)
 2. Volatile Organic Compounds (secondary) 3. Carbon Monoxide (primary) 4. Nitrogen Oxides (can be both) 5. Sulfur Oxides(primary from combustion of coal) 6. Ozone and other photochemical oxidants (secondary).")
121
Sources of air pollution Natural: a. Sulfur: Volcanoes, sea spray, microbial b. Nitrogen oxides: lightening, forest fires, microbial Anthropogenic (human caused) a. Sulfur oxides: coal burning plants, industry, fossil fuels. b. Nitrogen oxides: power plants, industrial fuel combustion, transportation c. Effect areas hundreds of miles from the source of emissions, generally not the whole globe
 a. Sulfur oxides: coal burning plants, industry, fossil fuels. b. Nitrogen oxides: power plants, industrial fuel combustion, transportation c. Effect areas hundreds of miles from the source of emissions, generally not the whole globe.")
122
Solutions: Reducing Emissions Best way = Conservation, just use less! Input Control a. Cleaner burning gasoline b. increased fuel efficiency c. alternative modes of transportation d. decrease the number of miles driven e. changes in land use decisions f. catalytic converter

123
Output Control A. Scrubbers: exhaust fumes through a spray of H 2 O containing lime (CaCO 3 ) SO 2 CaSO 3 B. Coal washing to get rid of sulfur C. Fluidized bed combustion (produces a waste ash that must be disposed of)
 SO 2 CaSO 3 B. Coal washing to get rid of sulfur C. Fluidized bed combustion (produces a waste ash that must be disposed of).")
124
Reducing Pollution from Electricity Production Input Control (pollution prevention) A. Cleaner Burning Fuel by… -Switching to low-sulfur coal -Switching from coal to natural gas -Switching from fossil fuel to renewable energy source B. Increase Energy Efficiency by… -using insulation - using more efficient appliances

Similar presentations