Download presentation
Presentation is loading. Please wait.

1
Vulnerability and Adaptation Assessments Hands-On Training Workshop Impact, Vulnerability and Adaptation Assessment for the Agriculture Sector – Part 2 Asunción Paraguay. August 14-18, 2006 Graciela O. Magrin INTA-Instituto de Clima y Agua (Argentina)
.")
2
FAOCLIM

3
Precipitation Annual 1901-1995 Source of data: NOAA, NCDC

4
1: Evergreen needle leaf forests 2: Evergreen broad leaf forests 3: Deciduous needle leaf forests 4: Deciduous broad leaf forests 5: Mixed forests 6: Woodlands Global Land Cover Classification 7: Wooded grasslands/shrubs 8: Closed bushlands or shrublands 9: Open shrublands 10: Grasses 11: Croplands 12: Bare 13: Mosses and lichens De Fries et al., 1998 Eva et al., 2004

5
Population

6
Map of the night-time city lights of the world DMSP: NASA and NOAA Lights are Related to Income and Population

7
Soils: FAO

8
The projected change in annual temperature and precipitation for the 2050s compared to the present day, for two GCMs, when the climate models are driven with an increase in greenhouse gas concentrations defined by the IPCC “business-as-usual” scenario.

9
http://www.icasanet.org/http://www.clac.edu.eg International Consortium for Agricultural Systems Applications Question: What components of the farming system are particularly vulnerable, and may thus require special attention? – crop models (e.g., DSSAT) Practical Applications: DSSAT
 Practical Applications: DSSAT.")
10
1.Overview and previous examples of use 2.Guided use of model (three practical applications to be done by the participants)
")
11
DSSAT Decision Support System for Agrotechnology Transfer ComponentsDescription DatabasesWeather, soil, genetics, pests, experiments, economics ModelsCrop models (maize, wheat, rice, barley, sorghum, millet, soybean, peanut, dry bean, potato, cassava, etc.) Supporting software Graphics, weather, pests, soil, genetics, experiments, economics ApplicationsValidation, sensitivity analysis, seasonal strategy, crop rotations
 Supporting software Graphics, weather, pests, soil, genetics, experiments, economics ApplicationsValidation, sensitivity analysis, seasonal strategy, crop rotations")
12
Input Requirements Weather: Daily precipitation, maximum and minimum temperatures, solar radiation Soil: Soil texture and soil water measurements Management: planting date, variety, row spacing, irrigation and N fertilizer amounts and dates, if any Crop data: dates of anthesis and maturity, biomass and yield, measurements on growth and Leaf Area Index (LAI)
")
13
Crop Model Validation Wheat: 23 sites (m.e.: 10%) Soybean: 16 sites (m.e.: 10.9% Maize: 11 sites ( m.e.: 7.8% Travasso & Magrin, 2001
 Soybean: 16 sites (m.e.: 10.9% Maize: 11 sites ( m.e.: 7.8% Travasso & Magrin, 2001")
14
Examples Can optimal management be an adaptation option for maize production in Argentina? Can adaptation be achieved by optimizing crop varieties? Can changes of crop mix be an adaptation option?

15
Can Optimal Management be an Adaptation Option for Maize Production in Argentina? Source Argentina 2º National communication

16
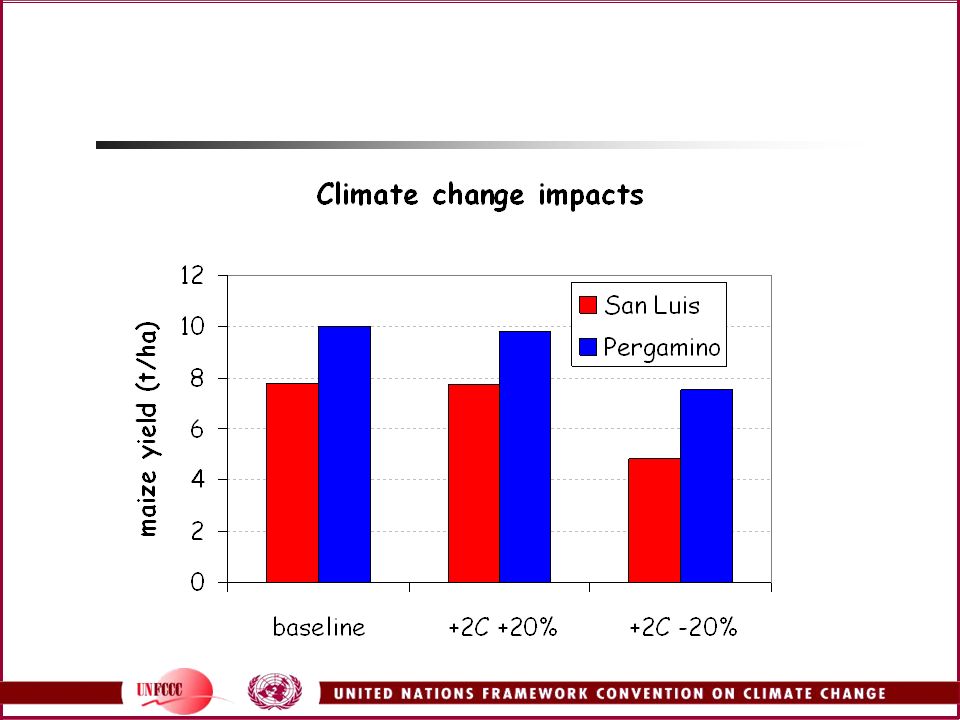
Adaptation: Argentina Adaptation strategies in two locations of Argentina Increased inputs and improve management: Planting date Fertilizer Irrigation Travasso et al., 2006

17
Crop Coefficients Corn. Juvenile phase (growing degree days base 8°C from emergence to end of the juvenile phase). Photoperiod sensitivity. Grain filling duration (growing degree days base 8 from silking to physiological maturity). Potential kernel number. Potential kernel weight (growth rate) P1 P2 P5 G2 G5 P1 P2 P5 G2 G5 Can Adaptation be Achieved by Optimizing Crop Varieties?
. Photoperiod sensitivity. Grain filling duration (growing degree days base 8 from silking to physiological maturity). Potential kernel number. Potential kernel weight (growth rate) P1 P2 P5 G2 G5 P1 P2 P5 G2 G5 Can Adaptation be Achieved by Optimizing Crop Varieties .")
18
Optimizing crop varieties Maize >P1 Maize >P1 Juvenile phase Wheat >P1D photoperiodic sensitivity

19
Practical Applications 1.Effect of management (nitrogen and irrigation) in wet and dry sites 1.Effect of climate change on wet and dry sites Sensitivity analysis to changes in temperature and precipitation (thresholds) and CO 2 levels 2.Adaptation: Changes in management to improve yield under climate change
 in wet and dry sites 1.Effect of climate change on wet and dry sites Sensitivity analysis to changes in temperature and precipitation (thresholds) and CO 2 levels 2.Adaptation: Changes in management to improve yield under climate change")
20
Application 1. Management Objective: Getting started

21
Weather San LuisPergamino SR (MJ m 2 day 1 )17.515.9 T Max (°C)24.422.9 T Min (°C)11.610.6 Precipitation (mm)6031029 Rain Days (num)6585.4
 T Max (°C) T Min (°C) Precipitation (mm) Rain Days (num)6585.4")
22
Input Files Needed Weather Soils Cultivars Management files (*.MZX files) description of the experiment
 description of the experiment")
23
Open DSSAT...

24
Weather file Soil file Genotype file (Definition of cultivars) Examine the Data Files...
 Examine the Data Files...")
25
Location of the Cultivar File...

26
Select the Cultivar File...

27
Examine the Cultivar File...

28
Location of the Weather File...

29
Select the Weather File...

30
Examine the Weather Files... Weather file

31
Calculate Monthly Means...

32
Calculate Monthly Means... (continued)
")
33
Location of the Input Experiment File...

34
Select the Experiment File...

35
Examine the Experiment File (Syria)
")
36
Examine the Experiment File

37
... The Experiment File Can Be Edited Also With a Text Editor (Notepad)
")
38
Start Simulation …

39
Running...

40
Select Experiment...

41
Select Treatment...

42
View the Results...

43
Select Option...

44
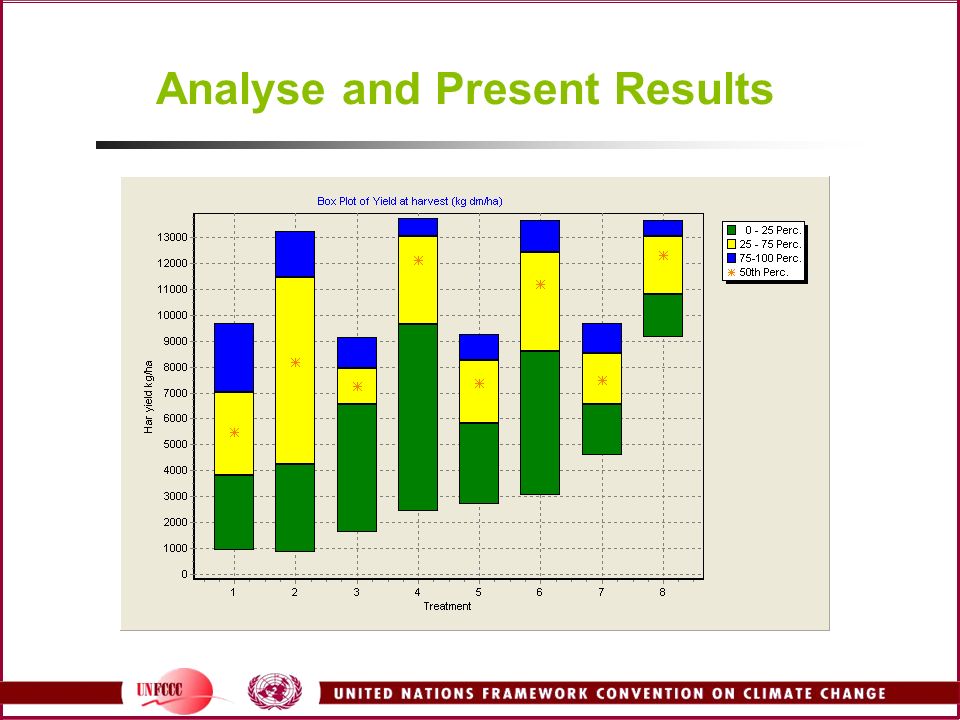
Analyse and Present Results

48
Exp 2. Sensitivity to Climate Objective: Effect of weather modification

49
Start Simulation...

50
Sensitivity Analysis...

51
Select Option …

53
http://www.fao.org/ag/agl/aglw/cropwat.htm CROPWAT is a decision support system for irrigation planning and management. Can the water/irrigation systems meet the stress of changes in water supply/demand? – irrigation models (e.g., CROPWAT) http://www.clac.edu.eg
")
54
Experiments 1.Calculate ET0 2.Calculate crop water requirements 3.Calculate irrigation requirements for several crops in a farm

55
Start CROPWAT …

56
Retrieve Climate File...

57
Examine Temperature...

58
Examine ET0...

59
Calculate ET0...

60
Examine Rainfall...

61
Retrieve Crop Parameters...

62
View Progress of Inputs...

63
Define and View Crop Areas Selected...

64
Define Irrigation Method...

65
Input Data Completed...

66
Calculate Irrigation Demand...

67
Calculate Irrigation Schedule...

68
View Results...

Similar presentations


 and simulated (lines) V-Stages of soybean cultivars (MG 3.0 to 3.9) grown at.>")

 Crop production (7) Plant health (3) Business management (4) IT (2) Health and.>")


