Download presentation
Presentation is loading. Please wait.

2
Glencoe Chapter 3 Describing Motion

3
Who Wins????? Racer with the fastest speed? Racer with the shortest elapsed time? What is motion? What is speed? How is speed different from velocity?

4
Battery Buggy After watching the buggy, how is it’s motion different/similar to a 100 meter sprinter? What if the batteries were close to dead?

5
Motion is Relative Perception of motion by humans is always related to nearby objects. Even if there is motion, but no nearby reference, motion is not perceived by humans.

6
3.1 Picturing Motion When an object moves, it’s position changes. A MOTION DIAGRAM is a tool that may be used to study the motion of an object.

11
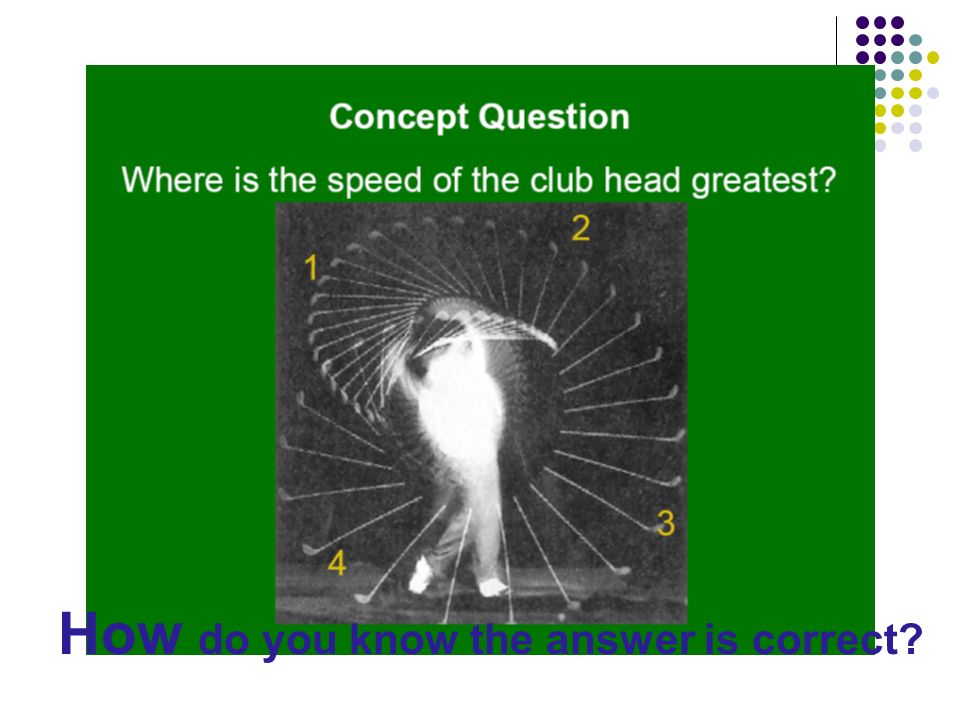
How do you know the answer is correct?

12
Motion Diagrams—you draw! What kind of motion does the diagram depict?

13
Operational Definition An Operational Definition defines a concept in terms of the procedure or operation used. Examples Rest? Object does not change position with relation to a reference point. Constant speed? Object travels equal distances in equal time periods. Acceleration? Deceleration

14
What’s Happening here?

15
Or here?

16
Particle Model These types of Diagrams are a little difficult to draw. Maybe we can substitute something else for little pictures of the moving object…

17
A ticker-tape timer

21
Ticker Tape: "slower" acceleration ** * * * * * * * Ticker Tape: "Faster" acceleration ** * * * * * Ticker Tape: "slower" deceleration * * * * * ** Ticker Tape: "faster" deceleration * * * * * * *

22
Ticker-tape Math Speed = distance time From timer device rate Time Taken = 5 X.025s = 0.125 s

23
Now you try it…. Page 46 of your text, #1-4

25
3.2 Where and When? Coordinate Systems—Tell where zero point of variable you are studying is and the direction in which the value of the variable increases. Origin—Point at which values for variable are zero.

27
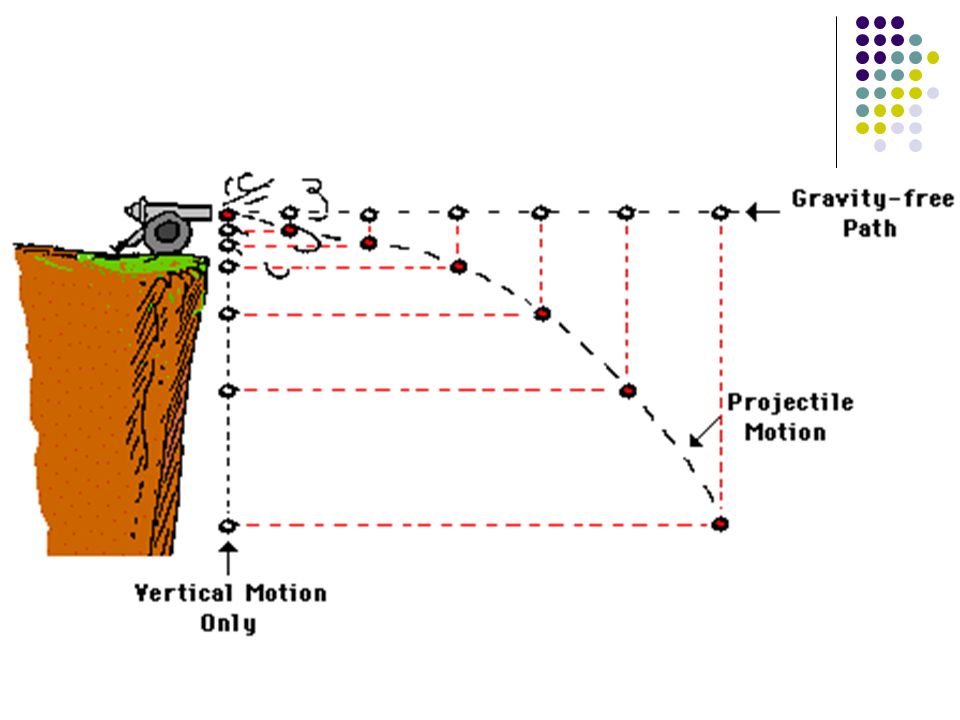
X-Y Coordinate System Motion of many types may be shown on a coordinate system, for example a ball thrown upward A cannon firing a cannonball a high diver diving off a board A high jumper We can use an x-y system, X is horizontal movement Y is vertical movement

28
We can define upward as positive, which is standard. We can define to the right as positive However, you can choose any direction as either positive or negative, just make sure the opposite direction has an opposite sign.

29
Symbols in Physics Symbols are frequently used to represent quantities in Physics m represents massSI unit kg t represents times s represents speedm/s d represents distancem a represents accelerationm/s 2 v represents velocitym/s Δd represents displacementm

30
Vectors and Scalars represent quantities Another way of representing the position of an object would be to use a vector. Vectors or scalars are used to represent quantities in physics. A scalar is a line segment, whose length represents only magnitude Time is a scalar quantity A Time interval is the difference between two time periods i.e 2 hours interval between 2:00 and 4:00 Mass is a scalar quantity, along with others

31
Vectors A vector is a ray whose length represents magnitude, and the ray points in the direction. Vectors are used to represent quantities that have both magnitude as well as direction. Displacement is a vector quantity Is the distance and direction between two positions

34
Examples Speed……….. Velocity……... Acceleration.. Time…………. Distance……. Force……… Scalar quantity Vector quantity Vector scalar vector

35
Vector Quantities Vector quantities are represented with arrows over the symbol. Velocity acceleration

36
Examples Equation for acceleration

42
A position vector drawn from origin to position of object x y d0d0

43
Position Vectors

44
Another Position vector

45
Velocity Vectors

47
Displacement vs. Position Position is the position where an object is located. Indicated as “d”, or sometimes d 0, d 1 Displacement is the change in position of an object between two time periods. Indicated as “Δd” Found by subtracting, d 1 - d 0 Δd = d 1 -d 0

48
Time Interval Time intervals (Δt) are defined as the time between two time periods. Δt = t 1 -t 0
 are defined as the time between two time periods. Δt = t 1 -t 0")
49
Displacement vectors drawn between positions at two different time periods Displacement (Δd) is equal to difference between two position vectors (d 1 -d 0 ) Δd = d 1 -d 0 Velocity vectors drawn for each time period, length indicates magnitude (speed)
 is equal to difference between two position vectors (d 1 -d 0 ) Δd = d 1 -d 0 Velocity vectors drawn for each time period, length indicates magnitude (speed)")
50
Distance vs. Displacement You drive the path, and your odometer goes up by 8 miles (your distance). Your displacement is the shorter directed distance from start to stop (purple arrow). What if you drove in a circle? start stop
. What if you drove in a circle. start stop.")
51
3.3 Velocity and Acceleration Motion diagrams can be used to show objects moving with different speeds and different kinds of motion. Motion diagrams can show position and time, but can we combine them to determine a rate of motion?

52
3.3 Velocity and Acceleration ** Speed and velocity are similar except speed is scalar and velocity vector.

53
Velocity = {speed with a direction} Examples: 70 mph is a speed. 70 mph North is a velocity. Velocity

54
instantaneous velocity - the velocity that something has at any one instance (The terms instantaneous speed and avg. speed may also be used)
.")
55
The average velocity for a trip might be 53 miles/hour. However, during this trip your instantaneous speed might have been 0 miles/hour at a stoplight or 70 miles/hour on the open road.

56
Instantaneous Velocity Average Velocity, because it is calculated for a time interval, can actually not be calculated for a particular time period Instantaneous Velocity—velocity at a particular time period. Generally, however, when used in this text, the term “velocity” refers to an Instantaneous Velocity.

57
Displacement from Velocity

58
Final Position : This equation can be used to find “where” an object will be at some time period. SubstituteInto To get Then rearrange to get

59
Acceleration - rate of change in velocity due to change in speed or direction Acceleration Example: 9.8 meters/second 2 downward

60
Positive vs. Negative Is it possible to have a negative velocity and a positive acceleration? Is it possible to have a positive velocity and a negative acceleration? Is it possible to have a positive velocity and a positive acceleration? Is it possible to have a negative velocity and a negative acceleration?

61
Velocity & Acceleration Sign Chart V E L O C I T Y ACCELERATIONACCELERATION + - + Moving forward; Speeding up Moving backward; Slowing down - Moving forward; Slowing down Moving backward; Speeding up

63
End of Chapter 3

65
☻ ☻ ☻ ☻ ☻ ☻ ☻ ☻ ☻ ☻

Similar presentations


 Average Velocity (2-2) Instantaneous Velocity (2-3) Acceleration (2-4) Motion at Constant Acceleration.>")