Download presentation
Presentation is loading. Please wait.

1
Topics covered in this chapter
Three basic problems in pattern comparison How to detect the speech signal in a recording interval (i.e. separate speech from background) How to locally compare spectra from two speech utterances (local spectral distortion measure), and How to globally align and normalize the distance between two speech patterns (sequences of spectral vectors) which may or may not represent the same linguistic sequence of sounds (word, phrase, sentence, etc.)
 How to locally compare spectra from two speech utterances (local spectral distortion measure), and. How to globally align and normalize the distance between two speech patterns (sequences of spectral vectors) which may or may not represent the same linguistic sequence of sounds (word, phrase, sentence, etc.)")
2
Distortion Measures Mathematical considerations to find out the dissimilarity between two feature vectors. Let x and y are two vectors defined on a vector space X. A metric or distance function d on the vector space X as a real valued function on the Cartesian product XX is defined as ……

3
Distortion Measures

4
Distortion Measures If a measure of a distance d, satisfies only the positive definiteness property then it is called as distortion measure if vectors are representation of the speech spectra. Distance in speech recognition means measure of dissimilarity. For speech processing, an important consideration in choosing a measure of distance is its subjective meaningfulness The mathematical measure of distance to be useful in speech processing should consider the lingustic characteristics.

5
Distortion Measures For example a large difference in the waveform error does not always imply large subjective differences.

6
Distortion Measures Perceptual considerations: the choice of an appropriate measure of spectral dissimilarity is the concept of subjective judgment of sound difference or phonetic relevance. Spectral changes that keep the sound the same perceptually should be associated with small distances. And spectral changes that keep the sound the different perceptually should be associated with large distances

7
Distortion Measures Consider comparing two spectral representations, S(w) and S’(w) using a distance measure d(S,S’) If the spectral content of two signal are phonetically same (same sound) then the distance measure d is ideally very small
 then the distance measure d is ideally very small.")
8
Distortion Measures Spectral changes due to large phonetic distance include Significant differences in formant locations. i.e the spectral resonance of S(w) and S’(w) occure at very different frequencies. Significant differences in formant bandwidths. i.e the frequency widths of spectral resonance of S(w) and S’(w) are very different. For each of these cases sounds are different so the spectral distance measure d(S,S’) is ideally very large
 and S’(w) occure at very different frequencies. Significant differences in formant bandwidths. i.e the frequency widths of spectral resonance of S(w) and S’(w) are very different. For each of these cases sounds are different so the spectral distance measure d(S,S’) is ideally very large.")
9
Distortion Measures To relate a physical measure of difference to subjective perceived measure of difference it is important to understand auditory sensitivity to changes in frequencies, bandwidths of the speech spectrum, signal sensitivity and fundamental frequency.

10
Distortion Measures This sensitivity is presented in the form of just discriminable change – the change in a physical parameter such that the auditory system can reliably detect the change as measured in standard listening test. Terms used to describe just discriminable change include the difference limen (DL), just noticeable difference (JND), and differential threshold
, just noticeable difference (JND), and differential threshold.")
11
Spectral-distortion measures
Measuring the difference between two speech patterns in terms of average spectral distortion is reasonable way both in terms of its mathematically tractability and its computational efficiency Perceived sound differences can be interpreted in terms of differences of spectral features

12
Log spectral distance Consider two spectra S(w) and S’(w). The difference between two spectra on a log magnitude versus frequency scale is defined by A distance or distortion measure between S and S’ can be defined by

13
This is related to how humans perceive sound differences

14
Log spectral distance For P=1 the above equation defines the mean absolute log spectral distortion For P=2, equation defines the rms log spectral distortion that has application in many speech processing systems For P tends to infinity, equation reduces to the peak log spectral distrotion

15
Log spectral distance Since perceived loudness of a signal is approximately logarithmic, the log spectral distance family appears to be closely tied to the subjective assessment of sound differences; hence, it is perceptually relevant distortion measure We can calculate the distortion using short time FFT power spectra and by LPC model spectra (all pole smooth model spectra) The smooth spectral difference allows a closer examination of the properties of the distortion measure.
 The smooth spectral difference allows a closer examination of the properties of the distortion measure.")
16
Cepstral distances For the Cepstral coefficients we use the rms log spectral distance.

17
Cepstral distances

18
Cepstral distances Since the cepstrum is a decaying sequence, the summation in equation 3 does not require an infinite number of terms The number of terms must be no less than p (cepstral coefficients) The truncated cepstral distance is defined as The truncated cepstral distance is a very efficient method for estimation the rms log spectral distance.
 The truncated cepstral distance is defined as. The truncated cepstral distance is a very efficient method for estimation the rms log spectral distance.")
19
Weighted cepstral distances and liftering
Several other properties of the cepstrum when properly utilized are beneficial for speech recognition applications It can be shown that under certain regular conditions, the cepstral coefficients except c0 have Zero means Variance essentially inversely proportional to the square of the coefficient index, s.t

20
Weighted cepstral distances and liftering
Liftering makes the system more robust to noise, Liftering is done to obtain the equal variance Liftering is significant for the improvement for the recognition performance If we incorporate n2 factor into the cepstral distance to normalize the contribution from each cepstarl term, the distance Spectral slope: The amplitude of the harmonics resulting from vocal fold vibration falls off by 12 dB per octave. This means that each time the frequency doubles, the amplitude of the harmonics decreases by 12 dB. This is called the spectral slope or tilt or roll-off in the source spectrum. Low cepstral coeff affects spectral slope

21
Weighted cepstral distances and liftering
The variability of higher capstral coefficients are more influenced by the inherent objects (artifacts) of LPC analysis than that of lower cepstral coefficients. For speech recognition, therefore, suppression of higher cepstral coefficients in the calculation of a cepstral distance should lead to a more reliable measurement of spectral differences than otherwise
 of LPC analysis than that of lower cepstral coefficients. For speech recognition, therefore, suppression of higher cepstral coefficients in the calculation of a cepstral distance should lead to a more reliable measurement of spectral differences than otherwise.")
22
Weighted cepstral distances and liftering
The Lpc spectrum also includes components that are strong functions of the speaker’s glottal shape and vocal cord duty cycles. These components affects mainly the first few cepstral coefficients. For speech recognition the phonetic content of the sound is important and not these components so these components are need to be de-emphasized

23
Weighted cepstral distances and liftering
A cepstral weighting or liftering procedure, w(n) can therefore be designed to control the non information-bearing cepstral variabilities for reliable discrimination of sounds. The index weighting as used in equation 2 is the example of the simple form of cepstral weighting
 can therefore be designed to control the non information-bearing cepstral variabilities for reliable discrimination of sounds. The index weighting as used in equation 2 is the example of the simple form of cepstral weighting.")
25
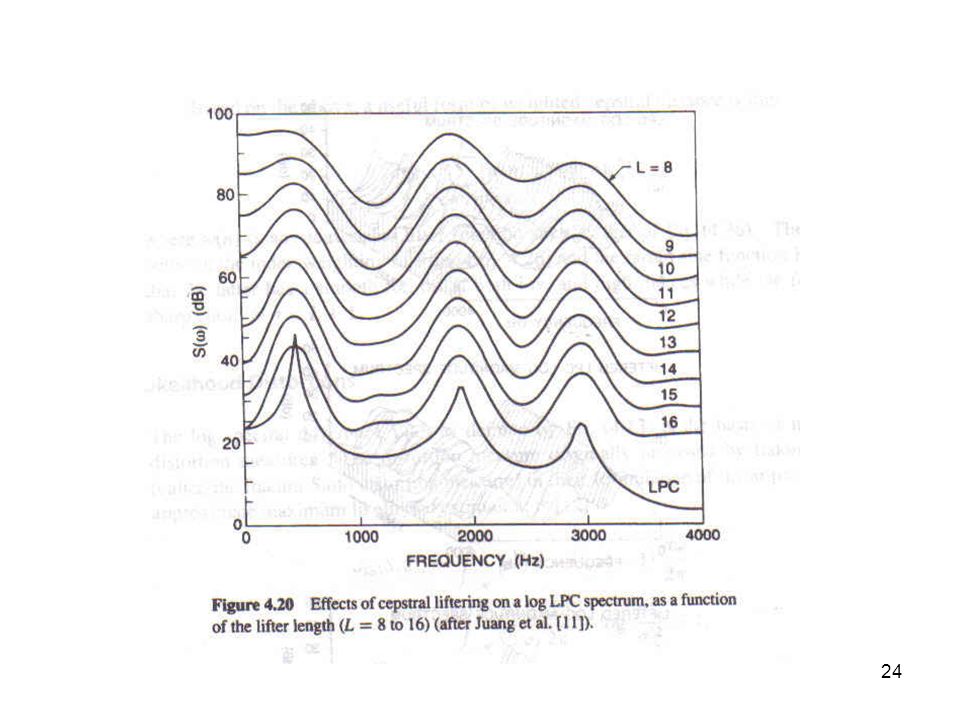
Weighted cepstral distances and liftering
The original sharp spectral peaks are highly sensitive to the LPC analysis condition and the resulting peakiness creates unnecessary sensitivity in spectral comparison The liftering process tends to reduce the sensitivity without altering the fundamental “formant” structure. i.e the undesirable (noiselike) components of the LPC spectrum are reduced or removed, while essential characteristics of the “formant” structure are retained
 components of the LPC spectrum are reduced or removed, while essential characteristics of the formant structure are retained.")
26
Weighted cepstral distances and liftering
A useful form of weighted cepstral distance is Where w(n) is any lifter function.
 is any lifter function.")
27
Itakura and Saito The log spectral difference V(w) is defined by V(w) = log S(w) – log S’(w) is the basis of many distortion measures The distortion measure proposed by Itakura and Saito in their formulation of linear prediction as an approximate maximum likelihood estimation is

28
Itakura and Saito

29
Itakura and Saito The Itakura Satio distortion measure can be used to illustrate the spectral matching properties by replacing S’(w) with the pth order all pole spectrum
 with the pth order all pole spectrum.")
30
Itakura

31
Likelihood Distortions
The role of the gain terms is not explicit in the Itakura distortion because the signal level essentially makes no difference in the human understanding of speech so long as it is unambiguously heard. Gain independent distortion measure called likelihood ration distortion can be derived directly from IS distortion measure

32
Likelihood Distortions
When the distortion is very small the Itakura distortion measure is not very different from the likelihood distortion measure.

33
Variations of likelihood distortions
Compare to the cepstral distance likelihood distortions are asymmetric. To symmetries the distortion measure there are two methods COSH distortion Weighted likelihood distortion

34
COSH distortion COSH distortion is given by
The COSH distortion is almost identical to twice the log spectral distance for small distortions

35
Weighted likelihood ratio distortion
The purpose of weighting is to take the spectral shape into account as a weighting function such that different spectral components along frequency axis can be emphasized or de-emphasized to reflect some of the observed perceptual effects

36
Weighted likelihood ratio distortion

37
Comparison of dWLR and d22

38
Weighted slope metric distortion measure
Based on a series of experiments designed to measure the subjective “phonetic” distance between pairs of synthetic vowels and fricatives, it is found that by controlled variation of several acoustic parameters and spectral distortions including formant frequency, formant amplitude, spectral tilt, highpass, lowpass, and notch filtering only formant frequency deviation was phonetically relevant

39
Weighted slope metric distortion measure
WSM attach a weight on the spectral slope difference near spectral peaks, rather than the spectral amplitude difference, and take the overall energy difference explicitly into consideration Critical band: is the bandwidth at which subjective responses such as loudness become significantly different. After the critical band the increased loudness is perceived S

40
Summary The spectral distortion measures are designed to measure dissimilarity or distance between two (power) spectra of speech Many of these dissimilarity measures are not metrics because they do not satisfy the symmetry property If an objective speech distortion measure needs to reflect the subjective reality of human perception of sound differences, or even phonetic disparity, the asymmetry seems to be actual desirable. Symmetric d(S,S’)=d(S’,S) S
=d(S’,S) S.")
41
Summary All distortion measures are equally important because certain distortion measures may be better for an less noisy environment, while others may be robust when the background is more noisy.

42
Summary Log spectral: Lp metric requires large amount of calculations because we need 2 FFT’s to obtain S(w) and S’(w), logarithms of all values of S and S’ and an integral
 and S’(w), logarithms of all values of S and S’ and an integral.")
43
Summary Truncated and weighted cepstral: Requires only L operations where L is of the order of hence calculations required are less compared to Lp metric

44
Summary The likelihood, Itakura-Saito, Itakura and COSH measurements: all requires on the order of p is the LPC order of all pole polynomial (8-12). Hence the computations are same for cepstral measures
. Hence the computations are same for cepstral measures.")
45
Summary

46
Summary Weighted likelihood ratio distortion: Requires L operations, similar to that of the cepstral measures

47
Summary Weighted Slope metric (WSM): Requires K operations, where K is the number of frequency bands used in computations (32-64)
: Requires K operations, where K is the number of frequency bands used in computations (32-64)")
48
Summary From all these points we can say that all the measures are both physically reasonable and computationally tractable for speech recognition except for the Lp metrics. Hence, practically we are going to use all the measures to study the speech recognition system

Similar presentations


 R(z): Radiation impedance. It has been shown.>")


