Download presentation
Presentation is loading. Please wait.

1
Using Network Simulation Heung - Suk Hwang, Gyu-Sung Cho
Web-Based Project Risk Analysis Model Using Network Simulation Heung - Suk Hwang, Gyu-Sung Cho Department of Industrial Engineering , Engineering College, Dongeui University Gaya-dong, san-24 Pusanjin-ku, Pusan, KOREA

2
Contents 2. Individual Project Alternative Evaluation Using
1. Introduction 2. Individual Project Alternative Evaluation Using AHP(Step 1) 3. Integrating the Results of Individual Evaluations 4. Project Risk Analysis Models - Project Risk Facets - Model Application 5. Summary and Conclusions
 3. Integrating the Results of Individual Evaluations. 4. Project Risk Analysis Models. - Project Risk Facets. - Model Application. 5. Summary and Conclusions.")
3
1. Introduction ☞ Developed a project risk analysis model based on simulation and multi-attribute structured decision support system ☞ Project Risk : Project schedule, Cost and Performance risk ☞ 1) Deterministic risk factor analysis model based or AHP (analytic hierarchy process) weighted value, and 2) Network simulation model based on venture evaluation and review technique. ☞ Also we developed computer program and demonstrated the pro posed methods, ☞ Then we carryout risk analysis
 Deterministic risk factor analysis model based or AHP. (analytic hierarchy process) weighted value, and. 2) Network simulation model based on venture evaluation. and review technique. ☞ Also we developed computer program and demonstrated the. pro posed methods, ☞ Then we carryout risk analysis.")
4
Decision Support System
Web-based Decision Support System Internet/Intranet Project Management System Information Group-Joint Work

5
Figure 2 . Three-step Approach of Project Evaluation Model

6
Figure 4. Client and Server in Decision Support System

7
☞ Construct decision structure and Derive out the
evaluation alternatives - the group decision ideas, the creative ideas ☞ we used a brainstorming method and developed a GUI-type program ☞ To create the ideas of project evaluation alternatives and methods for decision support system analysis, ☞ we construct decision structure using the brainstorming file in the internet/intranet–based environment

8
The GUI-type program of Solution Builder-2001

9
Figure 5. Main-program of Solution Builder 2001

10
2.1 Brainstorming ☞ We used a brainstorming method and developed a GUI-type program

11
☞ Sample output of alternative generation and construct
the decision structure of an example for school selection

12
2.2 Alternative Evaluation Using AHP

13
☞ A sample output pair-wise matrix of sample problem
Table 1. Pair-wise Comparison Matrix

14
☞ the final result of school selection AHP which is given by
School B(0.378) > School A(0.367) > School C(0.254).
 > School A(0.367) > School C(0.254).")
15
The AHP Result of School Selection Problem
Figure 9. The AHP Result of School Selection Problem The AHP Result of School Selection Problem

16
3. Integration of Individual Evaluation
☞ For the integration of the results of individual evaluations, prioritized sets, we used two Heuristic models 1, Model 2 and Fuzzy set priority method 1) Heuristic Model 1 : For example of the Heuristic Method 1, a sample result with N = 5 e valuators and M = 3 alternatives is given as : Evaluator 1 : B > A > C, Evaluator 2 : B > C > A, Evaluator 3 : C > A > B, Evaluator 4 : C > B > A, Evaluator 5 : C > B > A
 Heuristic Model 1 : For example of the Heuristic Method 1, a sample result with. N = 5 e valuators and M = 3 alternatives is given as : Evaluator 1 : B > A > C, Evaluator 2 : B > C > A, Evaluator 3 : C > A > B, Evaluator 4 : C > B > A, Evaluator 5 : C > B > A.")
17
☞ Heuristic Method 1 rank order is given by
C(0.467) > B(0.400) > A(0.133).
 > B(0.400) > A(0.133).")
18
2) Heuristic Model 2 : - The evaluator frequency matrices were added to form a summed frequency matrix - Then, the preference matrix was developed by a comparison of the scores in the component cells(A, B versus B, A). - If the A, B value equals B, A, then each component cell in the matrix is given by 1/2. On the other hand if the A, B value is greater than the B, A , then A, B is given by one and B, A cell of the preference matrix is given by 0. ☞ By applying the Heuristic Model 2 to the same example of Heuristic Method 1, the result is given by C(0.450) > A(0.392) > B(0.158) .
. - If the A, B value equals B, A, then each component cell in the matrix. is given by 1/2. On the other hand if the A, B value is greater than the. B, A , then A, B is given by one and B, A cell of the preference matrix. is given by 0. ☞ By applying the Heuristic Model 2 to the same example of. Heuristic Method 1, the result is given by. C(0.450) > A(0.392) > B(0.158) .")
19
3) Fuzzy Set Priority Method
. The fuzzy matrix complement cell values sum to 1 and fuzzy set difference matrix is defined as follows : R-RT = U(A, B) - (B, A), if U(A, B) > U(B, A), = 0, otherwise To obtain fuzzy preferences, following five steps are considered : Step 1 : Find the summed frequency matrix (using heuristic method 2) Step 2 : Find the fuzzy set matrix R which is the summed frequency matrix divided by the total number of evaluators Step 3 : Find the difference matrix R - RT = U(A, B) - U(B, A), if U(A, B) > U(B, A), = 0, otherwise where, for U(A, B) quantifies, A is preferable to B. Step 4 : Determine the portion of each part Step 5 : The priority of the fuzzy set is then the rank order of values in decreasing. The sample problem result by fuzzy set priority method is given by C(0.492) > B(0.387) > A(0.121).
 - (B, A), if U(A, B) > U(B, A), = 0, otherwise. To obtain fuzzy preferences, following five steps are considered : Step 1 : Find the summed frequency matrix (using heuristic method 2) Step 2 : Find the fuzzy set matrix R which is the summed frequency matrix. divided by the total number of evaluators. Step 3 : Find the difference matrix. R - RT = U(A, B) - U(B, A), if U(A, B) > U(B, A), = 0, otherwise. where, for U(A, B) quantifies, A is preferable to B. Step 4 : Determine the portion of each part. Step 5 : The priority of the fuzzy set is then the rank order of values in. decreasing. The sample problem result by fuzzy set priority method is given by. C(0.492) > B(0.387) > A(0.121).")
20
4. Project Risk Analysis 1) Project Risk Facets
Figure 2. Three Steps of Risk Analysis

21
Figure 3. Project Risk in Life Cycle

22
2) PROJECT RISK ANALYSIS MODELS
. Normally project risk can be assessed by following factors : ① Contribution to project performance, ② Technical validity, ③ Economic effect, ④ Systematic validity.

23
Figure 4. Project Risk Structure

24
Figure 5. Risk Identification

25
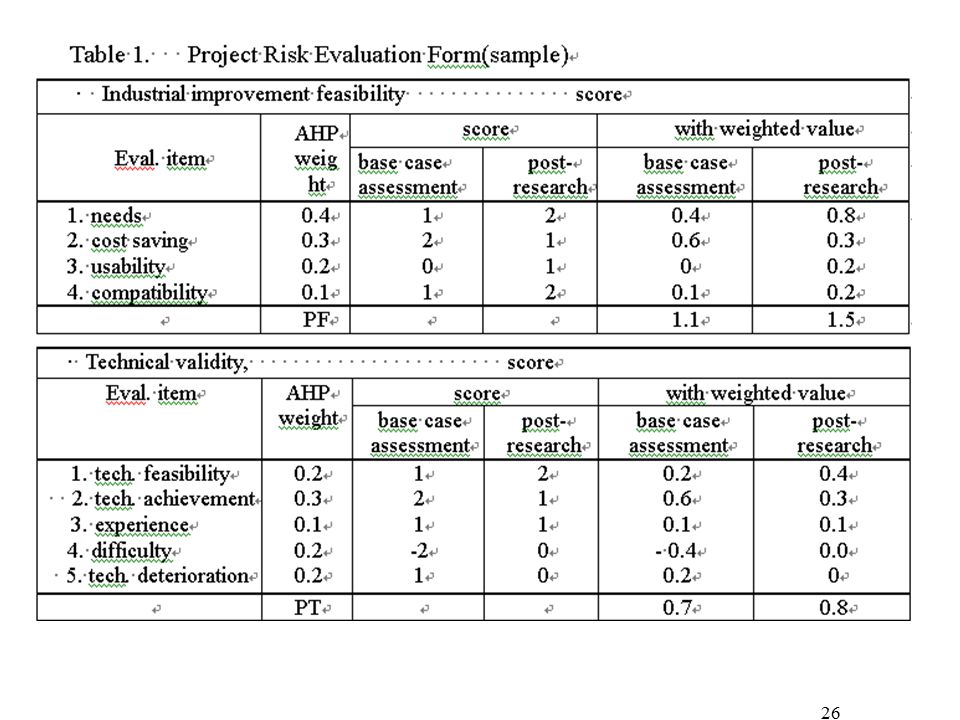
3) Risk Factor Analysis Method
In this study, we proposed two practical risk analysis models : 1) risk factor analysis model, and 2) network simulation model[6] are given as following. A Deterministic model based on risk factor analysis method using a scoring method, such as AHP(Analytic Hierarchy Process)[4] weighted value. Four steps of this method is given by : Step 1 : construct the evaluation items and evaluate each items in the evaluating form using -2∼+2 scoring scale, Step 2 : compute the AHP weighted value of each evaluation items and compute the weighted score of each evaluation item, Step 3 : compute the total evaluation score of each major evaluating items considering following items(in this study, we used for items as following) - industrial improvement feasibility, - technical feasibility, - economical feasibility, - institutional feasibility Step 4 : compute the risk using probability scale
 risk factor analysis model, and. 2) network simulation model[6] are given as following. A Deterministic model based on risk factor analysis method using a scoring. method, such as AHP(Analytic Hierarchy Process)[4] weighted value. Four steps of this method is given by : Step 1 : construct the evaluation items and evaluate each items. in the evaluating form using -2∼+2 scoring scale, Step 2 : compute the AHP weighted value of each evaluation items and. compute the weighted score of each evaluation item, Step 3 : compute the total evaluation score of each major evaluating items. considering following items(in this study, we used for items as following) - industrial improvement feasibility, - technical feasibility, - economical feasibility, - institutional feasibility. Step 4 : compute the risk using probability scale.")
27
PF· PT · PE · PI=PE PF · PT · PE · PI=PE
Base Case Post-research PF· PT · PE · PI=PE PF · PT · PE · PI=PE 0.93×0.85×0.93×0.93= ×0.89×0.94×0.94=0.74

28
4) Stochastic Network Simulation Method
Figure 6. Schematic Structure of Stochastic Network Simulation Model

29
Figure 7. Sample Output for Time/Cost.

30
Figure 8. Project Block Diagram
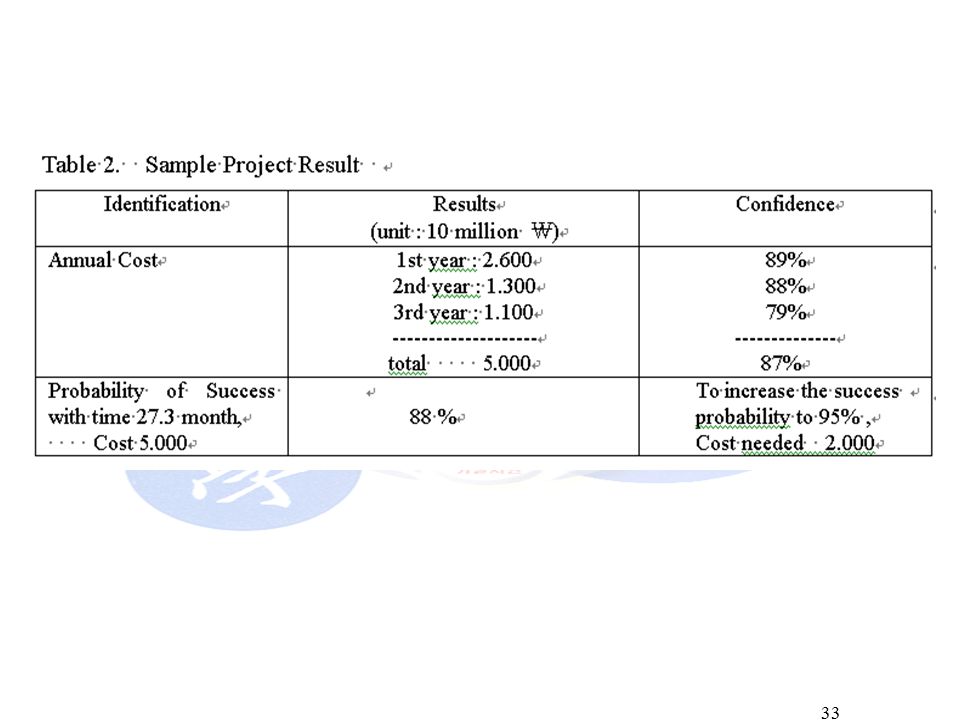
5) MODEL APPLICATION A new manufacturing system development : - In the advanced development step after successful completion of its 3 years basic research. - The system consisted of a main body and three sub-systems(A, B, C). - The main body is planned to develop in house, and three censers will be imported. The project block diagram is given as Figure 8. Figure 8. Project Block Diagram Four sub-systems ; new-CNC, Auto-assembler, main-body, and censers. - The detail network flow of this system is shown in Figure 9
 MODEL APPLICATION. A new manufacturing system development : - In the advanced development step after successful completion of its 3. years basic research. - The system consisted of a main body and three sub-systems(A, B, C). - The main body is planned to develop in house, and three censers will be. imported. The project block diagram is given as Figure 8. Figure 8. Project Block Diagram. Four sub-systems ; new-CNC, Auto-assembler, main-body, and censers. - The detail network flow of this system is shown in Figure 9.")
31
Figure 9. The detail Network Flow Diagram of Sample System

32
Figure 10. Cost/Time Diagram

34
5. CONCLUSION - In this research, developed a risk analysis model,
- To quantify the risks and to generate the choice of the actions to be taken to reduce the project uncertainties. - Two analysis models are proposed in this study; 1) risk factor analysis model and 2) network simulation model using VERT(venture evaluation and review technique). - The objective of proposed models are to estimate 1) the schedule, 2) cost and 3) performance risks. - The proposed models will be used in the area of R&D project evaluation to reduce project risks. - Also, developed computer programs and have shown the results of sample run for an acquisition project of manufacturing system. It was known that the proposed model was a very acceptable for R&D project evaluation.
 risk factor analysis model and. 2) network simulation model using VERT(venture evaluation and. review technique). - The objective of proposed models are to estimate. 1) the schedule, 2) cost and. 3) performance risks. - The proposed models will be used in the area of R&D project evaluation. to reduce project risks. - Also, developed computer programs and have shown the results of. sample run for an acquisition project of manufacturing system. It was known that the proposed model was a very acceptable for R&D project evaluation.")
35
Thank You Kainan University, Prof. Heung-Suk Hwnag

Similar presentations