Download presentation
Presentation is loading. Please wait.

2
Recent News Phenological changes/ shifts seem to be related to climate change meta-analysis 1500 species: average 4.2 days / decade earlier for temperate zone (Parmesan and Yohe, Root et al., Nature, Jan. 2, 2003) Ocean warming facilitates nonindigenous species invasions (Stachowicz et al, PNAS Nov. 26, 2002)
 Ocean warming facilitates nonindigenous species invasions (Stachowicz et al, PNAS Nov. 26, 2002).")
3
Roadmap Biology and Aquaculture - Oyster natural history - Washington oyster industry Analysis of Historical Data - Condition index information - Spatfall magnitude - Spatfall timing Discussion of Biophysics / Climate Interactions - Wind / upwelling - Sunshine / tideflat heating - Circulation / retention

4
Species invasions (naturalization) may be limited by environmental conditions at one or more life history stages. Pacific oysters have naturalized in a small subset of the locations to which they have been introduced. Pacific oysters are especially sensitive to temperature during gametogenesis and larval development. A site-specific suite of forces control the water/air temperature at each location of pacific oyster introduction. However, these locations are subject to regional forcing and specialized local conditions. Background Pacific oysters in Washington are uniquely suited to examine both response to global temperature change and post-invasion adaptation.

5
Hypothesis Pacific oyster invasion success has been limited by the mix of conditions controlling water temperature during the spring/summer reproductive period. - Local variation (within site, year to year) is predominately driven by local characteristics including winds, solar influx, flushing and stratification. - Correlated regional variation may be driven by ENSO/PDO cycles. - Spatfall dates reflect the timing of spawning and some measure of temperature during the larval development period. Spatfall intensities reflect the temperatures (and retention) during larval development.
 is predominately driven by local characteristics including winds, solar influx, flushing and stratification. - Correlated regional variation may be driven by ENSO/PDO cycles. - Spatfall dates reflect the timing of spawning and some measure of temperature during the larval development period. Spatfall intensities reflect the temperatures (and retention) during larval development..")
6
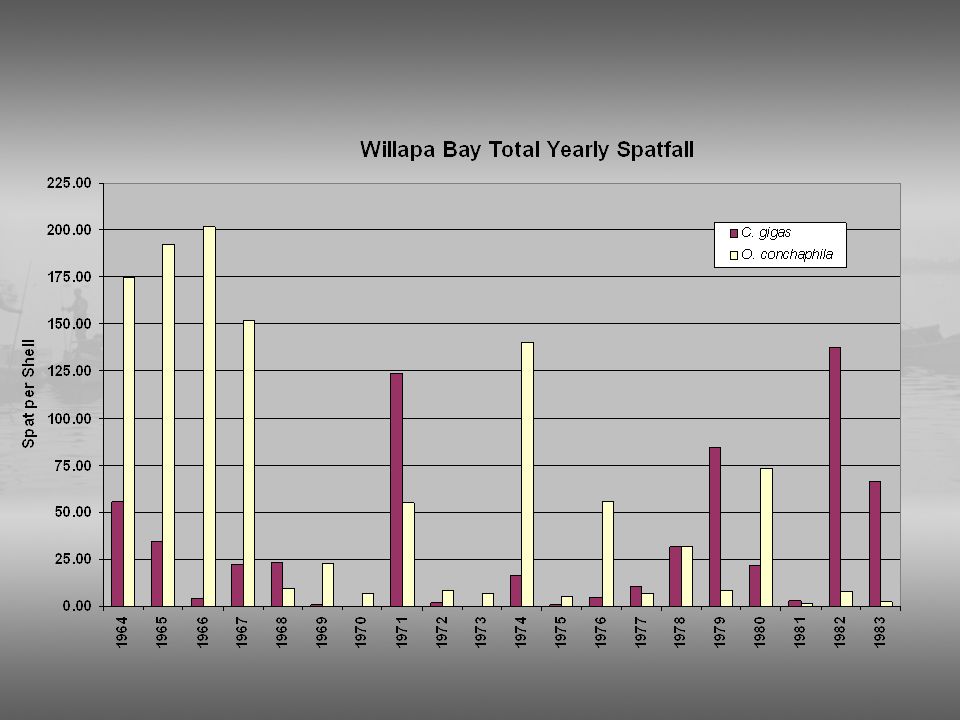
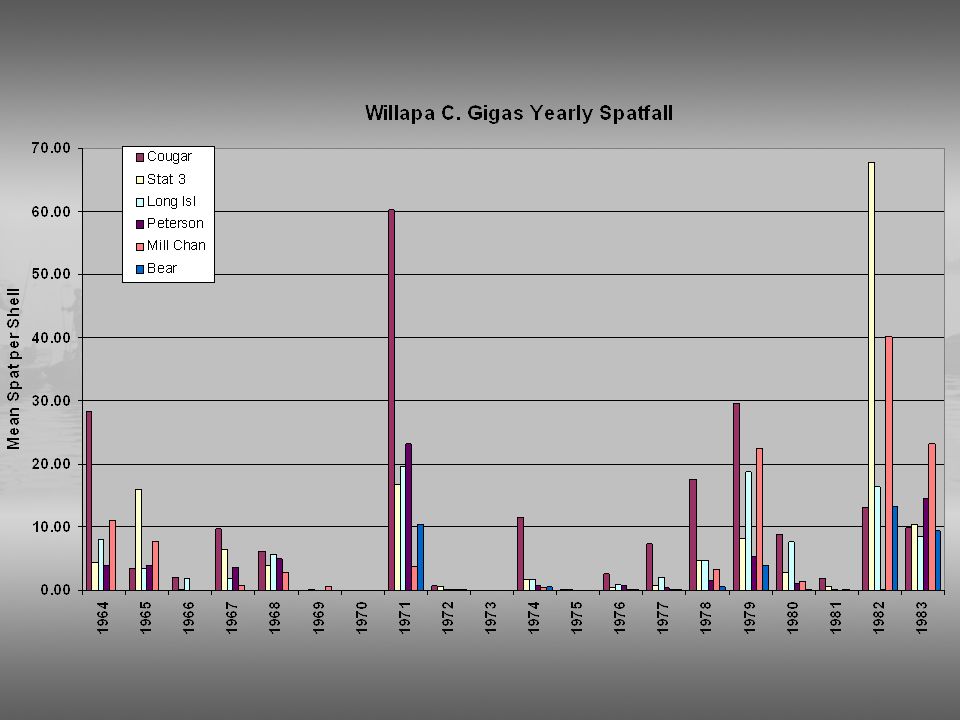
Pacific Oysters in Washington Introduced in 1919 in Samish Bay, 1929 in Willapa Bay Temperature limited spawning (too cold here) Broadcast spawner (hermaphroditic) ~1x10 6 larvae/female Natural spatfall irregular: from zero to saturating hard surfaces Spat imported from Japan 1919-199x; required for exploitation Modern hatcheries produce 2x10 9 spat / yr ** Environment directly limits naturalization and exploitation**
 Broadcast spawner (hermaphroditic) ~1x10 6 larvae/female Natural spatfall irregular: from zero to saturating hard surfaces Spat imported from Japan x; required for exploitation Modern hatcheries produce 2x10 9 spat / yr ** Environment directly limits naturalization and exploitation**")
7
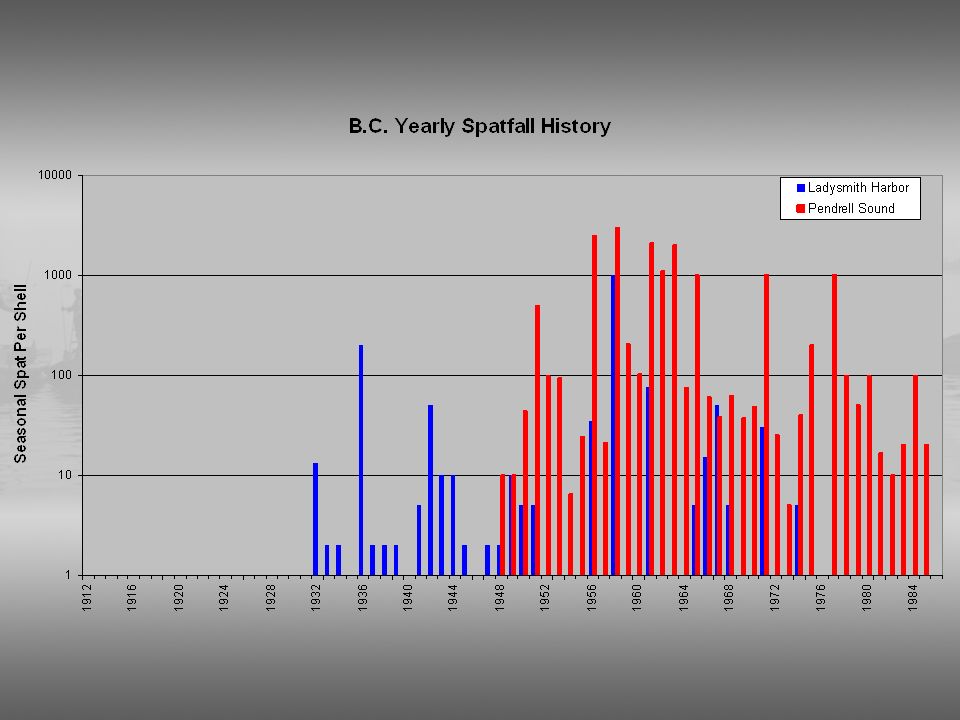
SEATTLE PORTLAND Willapa Bay Ladysmith Harbor Pendrell Sound Puget Sound

8
Oyster Recruitment Data Sets 1910192019301940195019601970198019902000 1910192019301940195019601970198019902000 1910192019301940195019601970198019902000 Willapa Dabob Pendrell Introduced (Quilcene) Introduced (Ladysmith) Introduced (Bay Center) First Spat (Pendrell) First Big Set First Spat (Dabob) First Spat 1946 WDFW Oyster Studies 1993 1949 WDFW Oyster Studies 1988 1940-1944 D. Tufts 1932 Galstoff 1968 Bourne ? PNCERS WDFW Condition Index Data

9
Oyster Reproduction Time Spawning Conditioning Larval Development “Ripeness” 0 1 18C 20C 22C Spawning Date (earlier) Spawning Date (later) “Maturity” 0 1 16C 18C 20C Setting Date (earlier) Setting Date (later)
 Spawning Date (later) Maturity C 18C 20C Setting Date (earlier) Setting Date (later)")
10
Oyster Reproduction spawning planktonic larval development spatfall fertilization { } 16-30 days (at 21-16 deg C) 1 day3 -7 days Larval Survival 100% 1% Time outstanding year good year catastrophies
 1 day3 -7 days Larval Survival 100% 1% Time outstanding year good year catastrophies")
11
Oyster Condition (fatness) January JulyDecember High Low ‘starving’‘fattening / growing’‘spawning’ ‘fattening’ bad food year good food year
 January JulyDecember High Low ‘starving’‘fattening / growing’‘spawning’ ‘fattening’ bad food year good food year")
12
Oyster Reproduction January JulyDecember High Low ‘starving’‘fattening / growing’‘spawning’ ‘fattening’ ‘developing gonad’‘ripe’‘resorption’ conditioning periodspawning window

13
Oyster Condition Index Has been evaluated as an indicator of climate-related influence Schoener and Tufts, JGR 1987 Ebbesmeyer and Strickland, 1995 Condition index is indirectly related (in complex ways) with changes in climate via trophic interactions and other unknowns
 with changes in climate via trophic interactions and other unknowns")
14
Willapa Bay 1955-2002 Mean Monthly Condition Index

15
Willapa Bay ‘Parcel A’ Condition Index 1955-2002 1971 1970 1992

16
Oyster Reproduction Gametogenesis and larval growth are directly affected by temperature. Temperature is a function of…?

21
“No Set” Years, Willapa Bay, Puget Sound, Ladysmith Hbr., Pendrell Sound L Pn PS WB “No Set” = less than 1 spat / shell for the season

22
Spatfall Timing

23
Timing of first Crassostrea gigas spatfall, Willapa Bay R 2 = 0.15 - 4.5 days / decade

24
Date of warm water (>15 C), Willapa Bay
, Willapa Bay")
25
Set Date from Temperature, Willapa Bay R 2 = 0.1

26
Puget Sound Set Dates for Ostreola and Crassostrea Ostreola conchaphila Crassostrea gigas

27
Puget Sound Set Dates for Ostreola conchaphila R 2 = 0.16 +5.8 days/decade

28
Puget Sound Set Dates for Crassostrea gigas R 2 = 0.23 +2.2 days / decade

29
Physical Forcing on Oyster Reproduction Tidal influence, moon and sun phases Sunlight based water and tide flat heating Intensity of wind-based mixing, upwelling, stratification Precipitation Salinity gradients (Columbia River Plume, Fraser River Plume) Oceanic / atmospheric temperatures Frequency of weather changes (fronts)
 Oceanic / atmospheric temperatures Frequency of weather changes (fronts)")
30
This project was supported by: NOAA Coastal Oceans Program via PNCERS

31
Willapa Bay

Similar presentations


 Parker MacCready (U. of.>")
 in Strangford Lough, Northern Ireland Claire Guy and Dai Roberts The Queen’s University Belfast.>")


![Climate Change Impacts in the United States Third National Climate Assessment [Name] [Date] Climate Trends.](/15/4626683/big_thumb.jpg "Climate Change Impacts in the United States Third National Climate Assessment [Name] [Date] Climate Trends.>")


