Download presentation
Presentation is loading. Please wait.

1
What does the SALCC do? Mission: Create a shared blueprint for landscape conservation actions that sustain natural and cultural resources

2
Indicators and Targets: Why do they matter? The blueprint will need to paint a compelling picture of the future of the South Atlantic region

3
It needs to represent why we care about the ecosystems of the area Indicators and Targets: Why do they matter?

4
Where we’ve been Developed recommended indicators and targets

5
Background

6
Definitions Goal: Desired conservation outcome that is difficult to measure Indicator: A metric that is designed to inform us easily and quickly about the conditions of a system Target: A measurable endpoint for an indicator

7
Broad goals Natural resources o Integrity of ecological systems o Viability of key species Natural resources o Integrity of ecological systems o Viability of key species Cultural resources o Sites o Objects o Biotic cultural resources Cultural resources o Sites o Objects o Biotic cultural resources Socioeconomic resources o Recreation o Human health o Economy Socioeconomic resources o Recreation o Human health o Economy

8
Ecosystems (Natural Resources) Marine Estuarine Beach and dunes Forested wetlands Tidal and nontidal freshwater marshes (managed and unmanaged) Freshwater aquatic (streams, lakes, ponds) Maritime forest Pine woodlands, savannas, and prairies (includes longleaf, loblolly, and slash systems) Upland hardwood forests Landscapes (Habitat aggregate) Waterscapes (Habitat aggregate)
 Marine Estuarine Beach and dunes Forested wetlands Tidal and nontidal freshwater marshes (managed and unmanaged) Freshwater aquatic (streams, lakes, ponds) Maritime forest Pine woodlands, savannas, and prairies (includes longleaf, loblolly, and slash systems) Upland hardwood forests Landscapes (Habitat aggregate) Waterscapes (Habitat aggregate)")
9
Criteria for indicator selection Can be a species, collection of species, or habitat metric (biotic or abiotic) ~ 3 indicators per habitat
 ~ 3 indicators per habitat")
10
Criteria for indicator selection Ecological criteria Ability to represent a variety of organisms and ecological attributes within that habitat type throughout a major portion of the LCC Sensitivity to big landscape threats in the region while having predictable and limited sensitivity to other factors such as natural variations or disturbances (i.e., high signal to noise ratio) Practical criteria Ease of monitoring with existing programs and resources Amount of overlap with existing plans and processes Ability to model indicator based on current data or existing projects
 Practical criteria Ease of monitoring with existing programs and resources Amount of overlap with existing plans and processes Ability to model indicator based on current data or existing projects")
11
Criteria for indicator selection Social criteria Ability to resonate with the American public Ability to link with an economic value Level of interest by public land or water managers Level of interest by private land or water managers

12
Criteria for target selection o Amount of overlap with existing plans and processes o Is the target achievable? o Is there enough capacity to monitor the target? o [In the future] Amount of overlap with cultural and socioeconomic goals

13
Selection process

14
Indicator selection team members Joe DeVivoNPS Tim PinionNPS Brian WatsonVA DGIF Beth StysFL FWC Wilson LaneyFWS John StantonFWS Maria WhiteheadTNC David WhitakerSC DNR Mark ScottSC DNR Breck CarmichaelSC DNR Billy DukesSC DNR Reggie ThackstonGA DNR Jan MacKinnonGA DNR Jimmy EvansGA DNR Jon AmbroseGA DNR Duke RankinUSFS Roger PuglieseSAFMC Ryan HeiseNCWRC Scott AndersonNCWRC Lisa Perras GordonEPA

15
Indicator revision team members Joe DeVivoNPS Tim PinionNPS Dave SteffenVA DGIF Brian BranciforteFL FWC Laurel BarnhillFWS Greg MoyerFWS Jan MacKinnonGA DNR Chris GoudreauNCWRC

16
Indicator review Detailed input from 235 experts in marine, freshwater, and terrestrial resources in the South Atlantic region and 9 experts representing all 5 adjacent LCCs 197 online reviews Feedback from all adjacent LCCs Input from regional partnerships Phone interviews with 18 local experts Integration of feedback of final recommendations by 20 member Indicator Team

17
Where we are Approval of indicators, targets, and testing/revision process

18
Beaches and dunes recommendations Productivity of loggerhead sea turtles Index of beach birds Miles of altered beach

19
Estuarine recommendations Index of coastal condition Index of estuarine birds Percent of impervious cover

20
Forested wetlands recommendations Acres of forested wetlands Index of forested wetland birds Acres of natural habitat near isolated wetlands

21
Freshwater aquatic recommendations Percent of natural habitat near rivers and streams Percent of impervious cover Index of biotic integrity

22
Landscapes recommendations Index of functional connectivity Acres of interior natural communities Index of structural connectivity Acres of “biodiversity hotspots” in natural condition

23
Marine recommendations Abundance of gag grouper Abundance of red drum Index of nearshore forage fish

24
Maritime forest recommendations Abundance of painted bunting Acres in protected status

25
Pine woodland, savannas, and prairie recommendations Index of pine woodland, savanna, and prairie birds Acres of open canopy habitat that is regularly burned Occurrence of flatwoods salamanders

26
Tidal and nontidal freshwater marsh recommendations Index of tidal and nontidal freshwater marsh birds Acres of tidal freshwater marsh Acres of invasive species

27
Upland hardwood forests recommendations Acres of “biodiversity hotspots” in natural condition Abundance of big trees Index of upland hardwood birds

28
Waterscapes recommendations Index of fish passage Number of dams mimicking natural flow

29
Draft testing and revision process A quick overview

30
Process overview Indicators o Short term testing (1 st year) Ecological criteria Practical criteria Social criteria
 Ecological criteria Practical criteria Social criteria")
31
Process overview Indicators o Short term testing (1 st year) Ecological criteria Practical criteria Social criteria o Long term testing (2-5 years) Ecological criteria Practical criteria Social criteria
 Ecological criteria Practical criteria Social criteria o Long term testing (2-5 years) Ecological criteria Practical criteria Social criteria")
32
Process overview Indicators o Short term testing (1 st year) Ecological criteria Practical criteria Social criteria o Long term testing (2-5 years) Ecological criteria Practical criteria Social criteria Targets
 Ecological criteria Practical criteria Social criteria o Long term testing (2-5 years) Ecological criteria Practical criteria Social criteria Targets")
33
Objectives Conservation Design Implementation Monitoring Analysis Testing using SALCC Committee Structure

34
Objectives Conservation Design Implementation Monitoring Analysis Can we model them?

35
Testing using SALCC Committee Structure Objectives Conservation Design Implementation Monitoring Analysis Do they still resonate?

36
Testing using SALCC Committee Structure Objectives Conservation Design Implementation Monitoring Analysis What’s the condition now?

37
Objectives Conservation Design Implementation Monitoring Analysis Testing using SALCC Committee Structure Does it all integrate?

38
Objectives Conservation Design Implementation Monitoring Analysis Testing using SALCC Committee Structure What should change?

39
Where we’re going Using indicators for blueprint development and reporting progress

40
Using the indicators How are we doing now? Impacts of future threats and potential actions Creating the blueprint

41
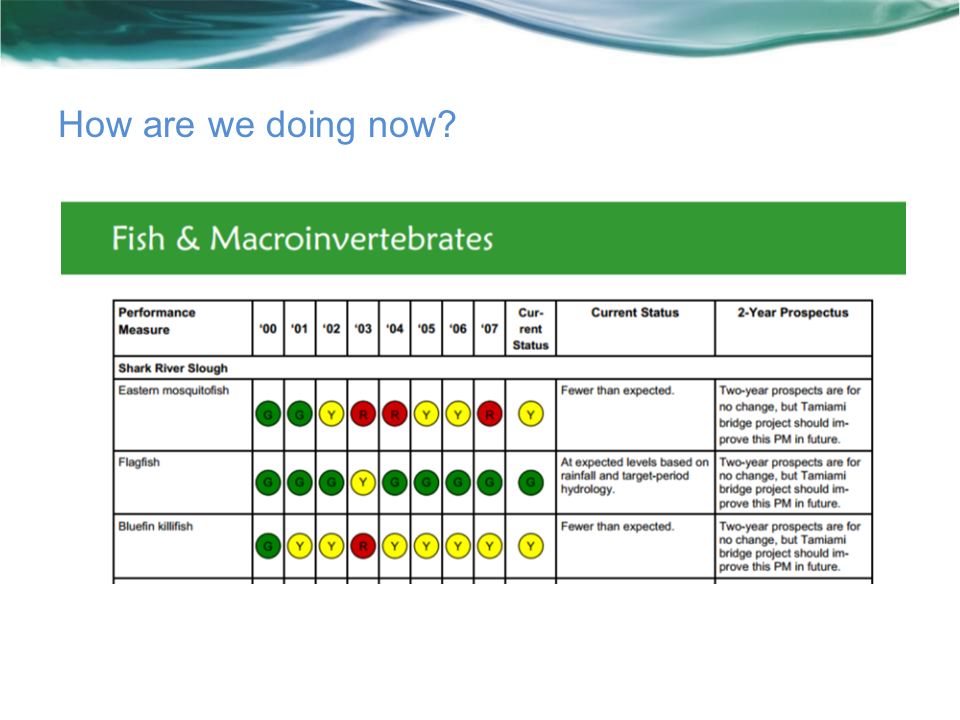
How are we doing now?

43
Beaches and dunes Sea turtles Beach birds Altered beach

44
Impact of potential actions

Similar presentations


 Framework Project Scope & Targets.>")

