Download presentation
Presentation is loading. Please wait.

1
Economic Activity in a Changing World
Chapter 3 Economic Activity in a Changing World

2
Measuring Economic Activity
Economic indicators are figures used to measure economic performance. Economic indicators measure things like how much a country is producing, whether its economy is growing, and how it compares to other countries.

3
Gross Domestic Product (GDP)
One way of telling how well an economy is performing is to determine how many goods and services it produces during a certain period of time. An important measure of a country’s economic health is its level or productivity The total value of the goods and services produced in a country in a given year is called its gross domestic product (GDP).
.")
4
Gross Domestic Product (GDP)
To calculate the GDP, economists compute the sum of goods and services. Economists include four main areas in calculating the GDP: 1.Consumer goods and services 2.Business goods and services 3.Government goods and services 4.Goods and services sold to other countries

5
Gross Domestic Product (GDP)
The GDP doesn’t include the goods and services that aren’t reported to the government. The United States produces so much more than other countries that it has a higher standard of living The standard of living is the amount of goods and services the average citizen can buy.

6
Gross Domestic Product (GDP)
The gross domestic product (GDP) is the output of goods and services produced in a country.
 is the output of goods and services produced in a country.")
7
Unemployment Rate The unemployment rate measures the number of people who are able to work but don’t have a job during a given period of time. There are different reasons for being unemployed, including: 1. Frictional (Temporary) 2. Seasonal 3. Structural (Changes in industry) 4. Cyclical (Economic slowdown)
 2. Seasonal. 3. Structural (Changes in industry) 4. Cyclical (Economic slowdown)")
8
Unemployment Rate Frictional (Temporary) Seasonal
This is where if you just quit your job or graduated from school and looking for work. This type of unemployment has little effect on the economy Seasonal If you harvest crops or work in a retail during the holiday season, you may only work a certain part of the time

9
Unemployment Rate Structural (Changes in Industry)
This is where new technology replaces workers or required new skills Cyclical (Economic slowdown) This is the worst type of unemployment and occurs when the entire economy slows down This type lasts until the economy recovers, which can take years.
 This is the worst type of unemployment and occurs when the entire economy slows down. This type lasts until the economy recovers, which can take years.")
10
Unemployment Rate Changes in the unemployment rate show whether an economy is picking up or slowing down. In 2003 rate was 5.2% During Great depression Went from 3.7% to 8.7% Currently 7.2%

11
Unemployment Rate How do you calculate the Rate
Unemployment rate = (# of Unemployed/labor force) x 100 Labor force = (# of employed) + (# of unemployed) Unemployed = 8 million Employed = 125 million
 x 100. Labor force = (# of employed) + (# of unemployed) Unemployed = 8 million. Employed = 125 million.")
12
Rate of Inflation Another important measure of economic strength is the rate of inflation Inflation is a general increase in the cost of goods and services. Inflation can happen when an economy actually becomes too productive. The more people are employed, the more people spend.

13
Rate of Inflation As the demand for goods goes up, producers raise their prices. To pay the higher prices, workers demand higher wages. When wages go up, producers raise prices again to pay for the higher wages, and so on. This situation can spiral out of control and lead to hyperinflation.

14
Rate of Inflation Deflation is a general decrease in the cost of goods and services. When an economy produces more goods than people want, it has to lower prices and cut production. As a result, people have less money to buy goods so the demand continues to go down.

15
Rate of Inflation This is what happened to some of the Asian countries like Japan and Taiwan in the 90’s. The United States tries to maintain a slow but steady rate of economic growth to avoid both inflation and deflation. This is done by controlling productivity and keeping a certain number of people unemployed. That way there is less risk of producers making too many goods or workers demanding higher wages

16
National Debt Countries can run up large debts
The main source or income for any government is taxes It uses taxes to pay for programs like defense, education, and social services. When the government spends more on programs than it collects in taxes, the difference in the amount is called the budget deficit.

17
National Debt In the 1980’s the government ran up a huge deficit when it cut taxes while increasing spending on programs To pay for the difference the government borrows money from the public, banks, and even other countries

18
National Debt The total amount of money a government owes is its national debt If the debt gets too large, a nation can become dependent on other nations or unable to borrow any more money. If a nation spends less than its income, it has a budget surplus.. The government will probably use a surplus to cut taxes, reduce the national debt, or increase spending for certain programs.

19
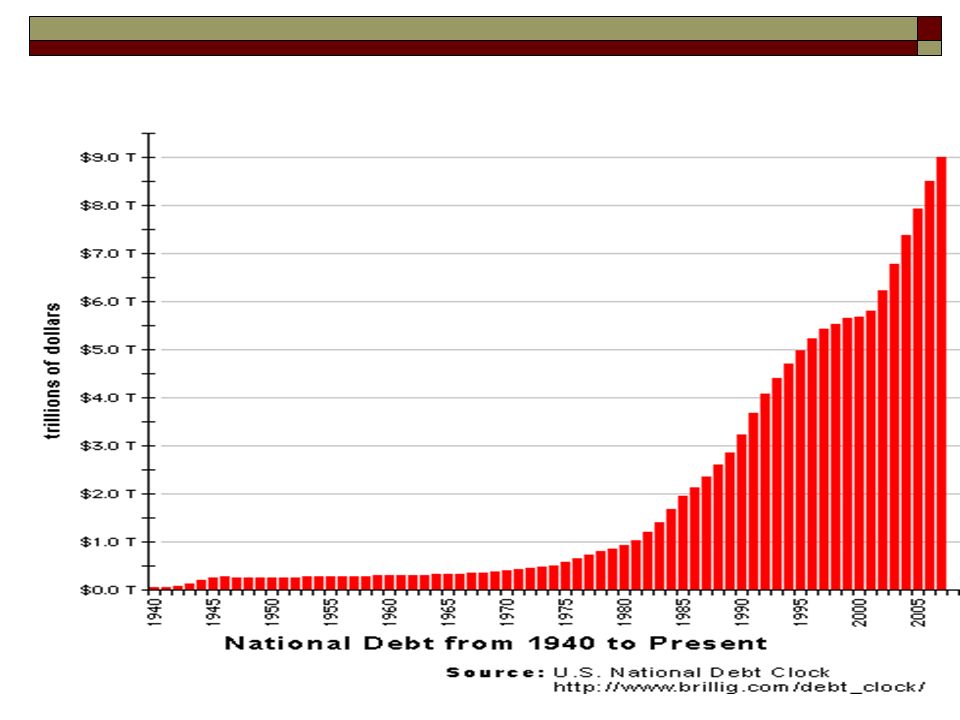
The National Debt on January 1st 1791 was just $75 million dollars
The National Debt on January 1st 1791 was just $75 million dollars. Today, it rises by that amount every hour or so. The following graph shows how the National Debt has grown year by year since 1940 in actual dollar amounts, uncorrected for inflation:

21
The Business Cycles Once you enter into the workforce you’ll experience many ups and downs Economies go through ups and downs as a result of wars, foreign competition, and changes in technology. Over long periods of time economic changes seem to form patterns. For example the U.S economy went though slumps in the 30’s, 50’s, and the 70’s

22
The Business Cycles The rise and fall of economic activity over time is called the business cycle. Four cycles of the business cycle can be identified 1. Prosperity 2. Recession 3. Depression 4. Recovery

23
The Business Cycles Every phase indicates changes to an economy, to industries, and to working people. In a global economy, in which several countries are trading goods and services with one another, one country’s economy can affect its trading partners’ economies. Exp: if the US economy is in a period of economic expansion, the U.S. will purchase goods and services from other countries promoting expansion

24
Prosperity Prosperity is a peak of economic activity.
Unemployment is low, production of goods and services is high, and new businesses open. Wages are usually higher so there is a greater demand for goods to be purchased.

25
Prosperity The 1990’s was a record of prosperity, which was due to the low rate of inflation and the internet creating new opportunities for business opportunities Prosperity, however, does not last. Any number of things can change Companies produce too much, people stop buying, or inflation rises dramatically.

26
Recession During a recession, economic activity slows down.
Spending decreases and so does the demand for products Businesses produce less so they need fewer workers The unemployment rate then increases so people have less to spend

27
Recession There is a general drop in the total production declines. of goods and services, so the GDP A recession can affect only one industry, related industries, or spread to the entire economy. The ripple effect is when a recession in one industry leads to a recession in other industries.

28
Recession Exp: if there is a recession in the auto making industry, it leads to a recession in industries that make parts for the cars Like steel, and rubber In 1970 an oil shortage in the U.S. caused gas prices to increase Gas is used for every kind of activity, from driving to work, to transporting goods to market As a result the price of everything went up and led to a major recession

29
Depression A deep recession that affects the entire economy and lasts for several years is called a depression. During a depression there is high unemployment, low production of goods and services, and excess capacity in manufacturing plants. A depression can be limited to one country but usually spreads to related countries.

30
Depression The stock market crash on October 29, 1929, or “Black Tuesday,” marked the beginning of the Great Depression. Between 1929 and 1933, GDP fell from approximately $103 billion to $55 billion. A decline of 50% During the Great Depression, the number of people out of work rose nearly 800 percent. From 1.6 to 12.8 million

31
Depression During the worst years of the depression 1 out of every 4 workers where jobless The average manufacturing wage was a .55 cents an hour but fell to .05 cents an hour Many banks failed and FDIC did not exist, so depositors where not protected. The money supply fell by 1/3 Currency was in such a short supply that towns and counties, resorted to printing their own money

32
Recovery A rise in business activity after a recession or depression is called a recovery. During a recovery: Production starts to increase People start going back to work and have money to spend again The new demand for goods and services stimulates more production The GDP grows New businesses open

33
Recovery A recovery can take a long time or it can happen quickly.
During World War II, the United States recovered from the Great Depression much faster because of the demand for war production. During a recovery businesses might start to innovate a new product or a new way of performing a task

34
Recovery When a business innovates, it often gains and edge on its competition b/c its costs goes down or its sales go up Profit increases, business grows, and economic activity soars.

35
Homework Page 44-45 1-22

Similar presentations