Download presentation
Presentation is loading. Please wait.

1
Technical Recommendations for Highways No 12 TRH 12

2
Technical Recommendations for Highways No 12 TRH 12
1980 1983 – draft TRH 12: Bituminous pavement rehabilitation design 1990 – draft TRH12: Flexible pavement rehabilitation investigation and design

3
1983 draft TRH 12: bituminous pavement rehabilitation design
Initial assessment Detailed assessment Rehabilitation design Economic analysis

4
1990 &1997 draft TRH 12: flexible pavement rehabilitation investigation and design
Managerial inputs Condition assessment Initial assessment (evaluation criteria) Detailed assessment Rehabilitation design – applicability - refer to detailed documents Practical and functional aspects Economic analysis
 Detailed assessment. Rehabilitation design – applicability - refer to detailed documents. Practical and functional aspects. Economic analysis.")
5
draft TRH 12: flexible pavement rehabilitation investigation and design
Latest revision: 2004 – Need identified – RMC of COTO 22 July 2004 – Symposium in Cape town - feedback from industry/role players 15 Nov 2004 – Workshop at Gautrans 27 Jan 2005 – Needs list of all inputs received

6
draft TRH 12: flexible pavement rehabilitation investigation and design
SANRAL funding SANRAL coordinate for RMC Chair – Mr JC van der Walt (SANRAL) Manager - Mr R Lorio (SANRAL) Members – Industry/Universities/private practice First meeting – 14 July 2005 Confirm scope
 Manager - Mr R Lorio (SANRAL) Members – Industry/Universities/private practice. First meeting – 14 July Confirm scope.")
7
draft TRH 12: flexible pavement rehabilitation investigation and design
Scope: Include new/improved knowledge Definitions & back ground information Change tone – step by step & check lists Provide guidelines : type & accuracy of information needed Details on the use of information Examples & photographs Layout of document

8
draft TRH 12: revision Very comprehensive revision
First draft – 31 May 2006 Committee Meeting - 3 August 2006 Work groups Detailed workshop 12 &13 Oct 2006

9
draft TRH 12: Flexible pavement investigation, analysis and rehabilitation design
Introduction Non pavement related aspects influencing pavement rehabilitation design Pavement Condition Assessment Initial assessment Detailed assessment Rehabilitation options and design approach Life cycle cost comparisons

11
2006 – draft TRH12 1 Introduction 1.1 Background 1.2 Scope
1.3 Pavement “life” 1.4 The art of pavement rehabilitation design 1.5 Managing pavement rehabilitation design 1.6 Recommended approach

12
Pavement “end of life” End of “optimal functionality”
Service will continue - BUT Risk to road user Safety considerations Road user costs Risk to road authority/owner Costs (maintenance & rehab)
")
13
The “art” of pavement rehabilitation design
Perception: relatively simple Low risk of disastrous consequences Professional risk Lack of accountability however

14
The “art” of pavement rehabilitation design
Fact : complex structures Pavement engineer – optimal (cost effective) design: Materials (various types, large variability) Construction techniques Moisture control & drainage Evaluation tests/methods Design methods (applicability) Environmental conditions & influence Life cycle cost comparison techniques etc “ forensic investigation”
 design: Materials (various types, large variability) Construction techniques. Moisture control & drainage. Evaluation tests/methods. Design methods (applicability) Environmental conditions & influence. Life cycle cost comparison techniques. etc. forensic investigation")
15
Increase in rehabilitation construction costs
Optimal design Conservative design Increase in risk Acceptable risk Increase in expertise Increase in rehabilitation construction costs High risk Low risk

16
TRH12 NETWORK LEVEL INVESTIGATIONS: ROAD MANAGEMENT SYSTEMS
CONSIDERATIONS SECTION 2.1 Commission project level rehabilitation investigation and design projects SOCIAL/ENVIRONMENTAL SECTION 2.2 PRACTICAL & FUNCTIONAL SECTION 2.3 CONDITION ASSESSMENT SECTION 3 REHABILITATION DESIGN SECTION 4 LIFE CYCLE COST COMPARISON SECTION 5 NETWORK LEVEL INVESTIGATIONS: ROAD MANAGEMENT SYSTEMS PROJECT LEVEL INVESTIGATIONS TRH12

18
Section 2: Non pavement related aspects influencing rehabilitation design
2.1 Introduction 2.2 Management considerations 2.3 Social and environmental considerations labour int; OH&S; EIA 2.4 Practical & function aspects 2.5 Checklist

29
Pavement surveillance
Input data sensitive type of measurement frequency - accuracy

31
Traffic loading Guidelines Detailed load surveys
Estimates – traffic volumes Updated E80 values E80 growth rates Example – sensitivity analysis

32
HEAVY VEHICLE GROUPING
TABLE 3.963: E80 factors for different heavy vehicle groupings HEAVY VEHICLE GROUPING TRH 16 (1991) SATCC (1998) CTO STATIONS ( ) HSWIM# Low Med High 2 + 3 Axles 0.6 1.2 1.9 0.4 1.8 2.5 0.7 2.0 >3 Axles 1.6 3.0 4.1 5.5 3.7. 5.0 Short (2 axles) 0.3 1.1 1.5 0.9 1.7 Medium (3+4 axles) 0.8 2.8 2.3 3.3 1.0 2.1 3.1 Long (>4 axles) 3.4 4.4 1.4 4.6 6.2 2.2 4.2 5.6 Low
 SATCC (1998) CTO STATIONS. ( ) HSWIM# Low. Med. High Axles >3 Axles Short. (2 axles) Medium. (3+4 axles) Long. (>4 axles) Low.")
33
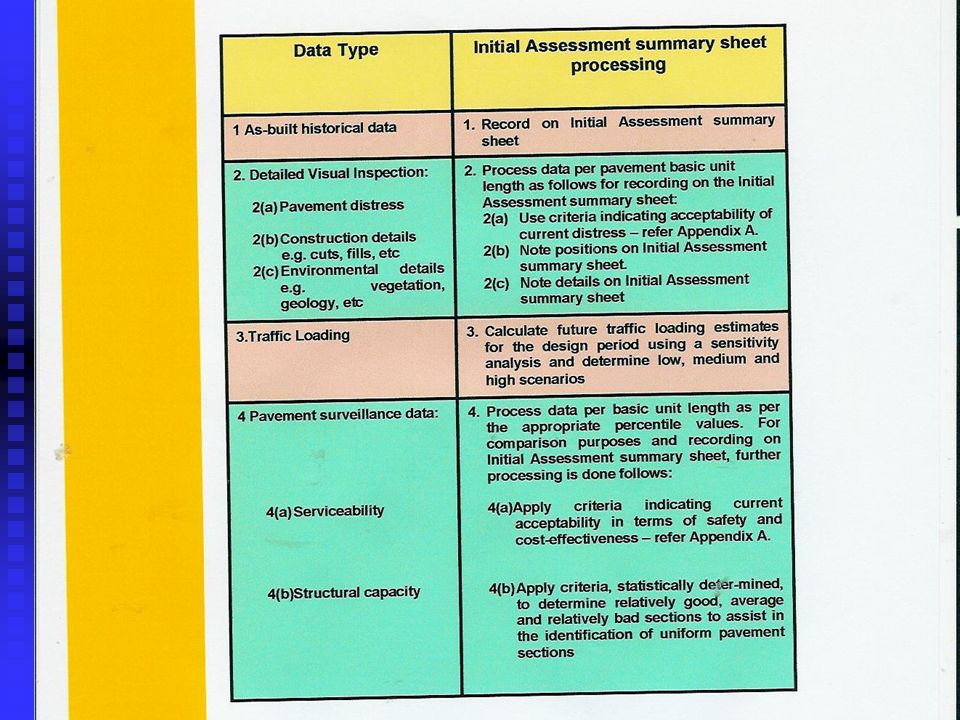
Processing of data Facilitate objectives of the initial assessment
Identify uniform pavement sections Differences in; Visual condition (S – W – S) Serviceability (S – W –S) Structural integrity
 Serviceability (S – W –S) Structural integrity.")
34
Evaluation criteria Relative to past traffic loading
Facilitate the identification of differences Relatively “poor “ sections Relatively “average” sections Relatively “good” sections Relative to past traffic loading

35
X = µ + 0.45σ Y = µ - 0.45σ α2 α1 µ = mean σ = standard deviation α3
X, Y = percentile values α = percentage of data Y X α1 α2 α3 ~ X = µ σ Y = µ σ

37
Identification of uniform sections
All information As built & history Loading Visual condition Surveillance measurements

39
Identification of uniform sections
Surveillance measurements Cusum Normalized Cusum Combination of data

40
Normalized cusum

42
Detailed assessment Cause and mechanism of distress
Pavement situation of each uniform pavement section

46
End of detailed assessment
All details of each section Know what is wrong Know cause and mechanism of distress Identified applicable rehab options Proceed with design

48
Rehabilitation options & design approach
Applicability Advantages/limitations/disadvantages Design methods Deflection DCP Mechanistic

49
Confidence and benefits
Not practical Non- simplified Mech design Design charts Design curve Level of expertise required Empirical/ theoretical Costs of implementation Level of sophistication Behaviour catalogue b/c ratio too low

52
Life-cycle cost comparison
PPWOC Agency costs Road user costs Probability theory REACT to be incorporated

53
2006 TRH12 300 + pages - to be shortened
Background to recommendations to be removed – use references Traffic loading = TRH16 Incorporate typical document contents pages in line with practice Eg Scoping Report, IA Report, DA Report, ect

Similar presentations


 Towards National Specifications Road Pavement Forum 07 November 2006 Elzbieta Sadzik.>")

