Download presentation
Presentation is loading. Please wait.

1
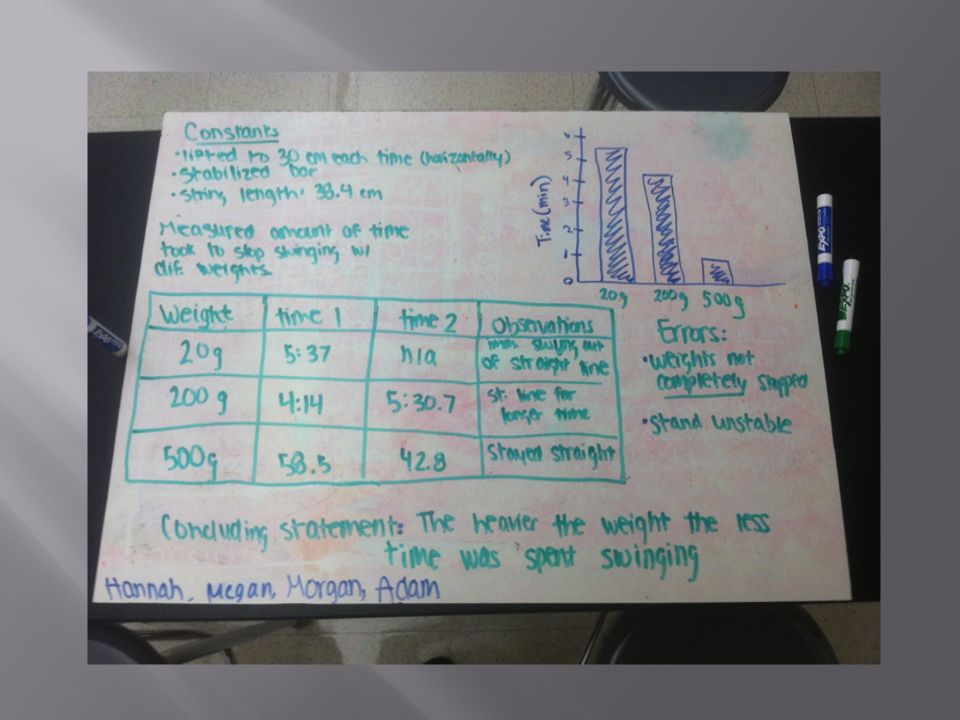
Finish Pendulum Whiteboards Proper Lab Notebooks Proper Graphing Independent/Dependent Variables Quiz Review

9
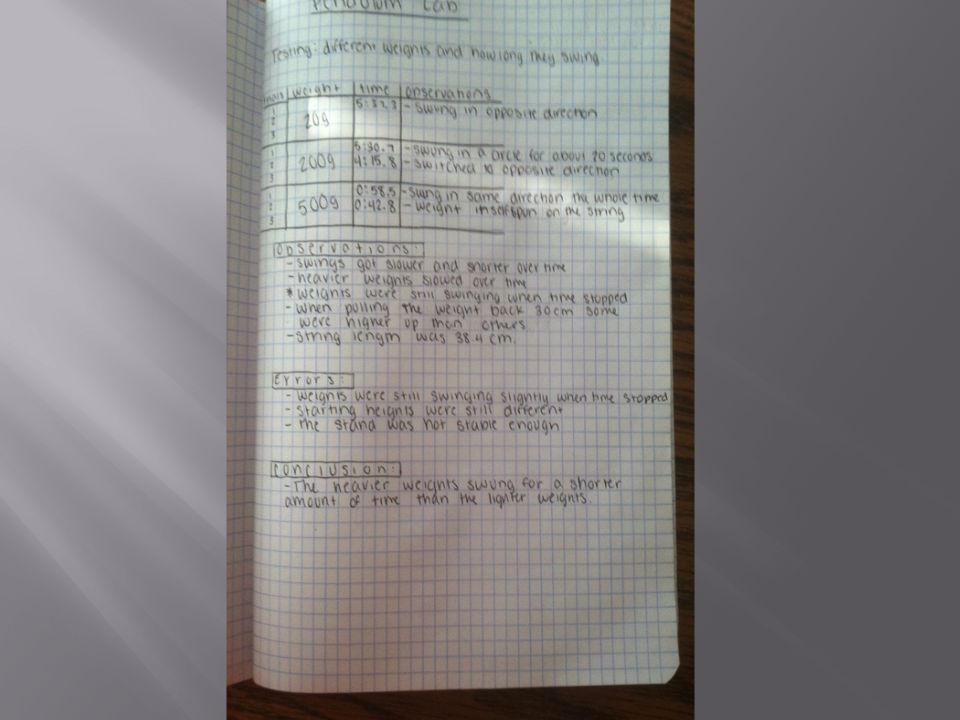
Overall the goal is to have someone unfamiliar to the experiment understand from your lab notebook Neat and organized Titles and labels Time, Length, Distance… Units Time (min), Distance (meters)…. Proper graphs Observations Conclusion

16
the independent variable is the one over which the experimenter has complete control the dependent variable is the one that responds to changes in the independent variable Titles, Labels, and units Connecting the dots… good idea or bad idea?

19
Next Time Question Format of Lab Notebooks Graphing Independent/Dependent Variables Unit 0 Worksheet #2

22
Overall the goal is to have someone unfamiliar to the experiment understand from your lab notebook Neat and organized Titles and labels Time, Length, Distance… Units Time (min), Distance (meters)…. Proper graphs Observations Conclusion

29
A football player kicks a ball that goes a certain distance. What is the independent variable? What is the dependent variable? the independent variable is the one over which the experimenter has complete control the dependent variable is the one that responds to changes in the independent variable

30
Titles, Labels, and units 8-10 Data points, Factor of 10 for data Why? Connecting the dots… good idea or bad idea?

31
Using what we just learned I want the 7 data sets graphed into your lab notebooks Work individually and pull out your homework for collection. The graphs will be line graphs

32
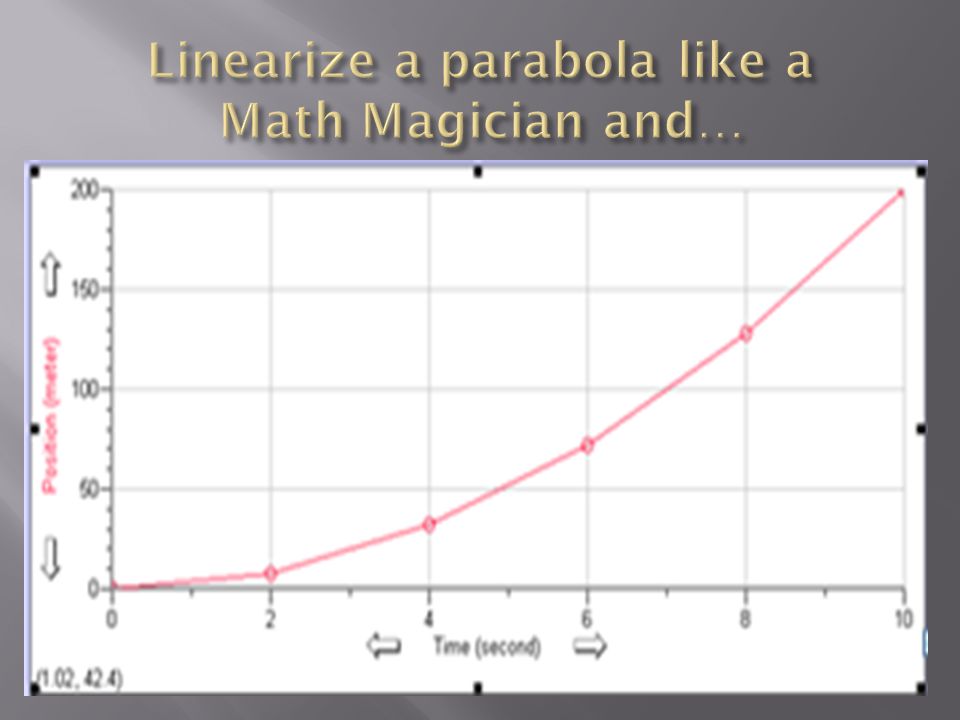
Next time question (from yesterday) Mathematical Model Data Studio Introduction Linearization!!!!!
 Mathematical Model Data Studio Introduction Linearization!!!!!")
35
What is the independent variable? What is the dependent variable? What formula describes this graph? Conceptually what does the graph represent? UNITS are key

36
Mathematical Model Review Linearizing Parabola Hyperbola Data Studio/WS #2 Closing

37
What is the independent variable? What is the dependent variable? What formula describes this graph? Conceptually what does the graph represent? UNITS are key

38
Linear graphs are Linearizing is the changing a graph into a linear graph. Why would we need this?

42
What you didn’t finish is homework Quiz Tomorrow

43
Mathematical Model Review Linearizing Parabola Hyperbola Data Studio/WS #2 Closing

44
What is the independent variable? What is the dependent variable? What formula describes this graph? Conceptually what does the graph represent? UNITS are key

45
Linear graphs are Linearizing is the changing a graph into a linear graph. Why would we need this?

49
What you didn’t finish is homework Quiz Tomorrow

50
Global problem White boarding Linear Graphs Choice Lab or Review Closing

51
Hostess is running low on supplies for making twinkies. MonthsTwinkies Consumed 00 0.512 1.015.5 1.519.4 222.7 2.524.4

52
Work in groups at the lab stations I will assign a random problem to each group to show. You will have 5-7 mins to show the original graph, linearized graph, and along with the math model including units I will pick one group member to present so make sure every understands what was done in the lab. This is the HW grade for the worksheet and it’s a group grade. Everyone is responsible for knowing their groups info.

54
Angle has no effect on the period Mass has no effect Length has the only effect Good data practices? Timing Averages

55
Collect 8-10 data points String length versus period Goal to have a mathematical model

56
Tomorrow we will review I will have a worksheet with an answer key to work on for most of the period I will answer your questions You have your make-up quiz Friday

57
Quiz Review Conversion Review Worksheet/Questions

59
Objective: Make unit conversions

60
1 foot = _____ inches 1 meter = _____ centimeters 1 pound = _______ ounces 1 minute = ______ seconds 1 hour = ________ minutes 1 day = __________ seconds 12 100 16 60 86,400

61
A unit conversion factor is a fraction whose numerator and denominator are equivalent measures. Some common unit conversion factors are given below. You can also use the reciprocal of these.

62
Introduces the unit you want in the answer Cancels out the original unit so that the one you want is all that is left.

64
Make a decision: What conversion factor will you use? Set up the problem: Multiply the measurement by the conversion factor. Solve the problem: Perform the multiplication

65
A bucket holds 16 quarts. How many gallons of water will fill the bucket? Use a unit conversion factor to convert the units. What are the two conversion factors comparing quarts and gallons? Which one will “cancel” quarts? 16 qt

66
One bag of apples weighs 64 ounces. How many pounds does it weigh? Darren drank 2 liters of water. How many milliliters of water did he drink?

67
Use a unit conversion to convert the units within each rate

68
Convert 80 miles per hour to feet per hour. Convert 63,360 feet per hour to miles per hour.

69
Convert 32 feet per second to inches per second. A craft store charges $1.75 per foot for lace. How much per yard is this?

70
The average American eats 23 pounds of pizza per year. Find the number of ounces the average American eats per year. The average American eats 368 ounces of pizza per year.

71
A car traveled 60 miles on a road in 2 hours. How many feet per second was the car traveling? Hint: Set up the words first. How many seconds in an hour? The car traveled 44 feet per second.

72
Fill out the worksheet Ask any questions Can be on anything

73
Next time question Stairwell Lab Exams Back Closing

74
If you need time to finish gathering data or making a math model spend the next 10 mins Also work on the summary if you have time We will be measuring the period of a 3 story pendulum using only our math model and the time we measure This is the only chance and I will be conducting 3 trials Bring a stop watch (one per each group)
")
75
Each section was worth 8 points Showing correct work gets you some points Ask me any questions you have on the quiz either during or after going over it.

77
A lab summary is due Wednesday Test on Friday Test review will be handed out tomorrow

78
Buggy Notes Buggy Lab Closing

79
Describe the motion of the car What can you measure? How can you measure? What is distance? What doesn’t it tell you Teleporting teacher References position N,S,E,W, Positive and negative

80
Work in new groups Collect data for the entire time given Be as accurate as possible As a group decide on what starting position is and choose a direction to be positive or negative. Work on using Time and Distance I will not be answering questions

81
Test Friday Lab summary due tomorrow Along with graphing todays data into the lab notebook Test review due Thursday

82
Lab Summaries Orb Graph Test Review

83
The actual length of the string suspended in the lab was 8.809 meters. You will now calculate your percent error as it relates to this lab. To calculate percent error: http://www.wikihow.com/Calculate- Percentage-Error http://www.wikihow.com/Calculate- Percentage-Error Make sure your prediction is in meters. If it is not, use one or more of the following conversions: 1 inch = 2.54 centimeters; 1 meter = 3.28 feet

84
Groot begins 10 meters ahead of Peter Quill as they both move in a straight linear fashion towards an orb (that possesses the Infinity Stone). Groot moves 0.5 meters each second. Peter Quill moves at 1.0 meters each second in the same direction. When will Peter Quill catch up to Groot? Show graphically!!!

85
SCENARIO 1: Groot is at position 10 meters; Peter Quill is at position 0 meters. TimeGrootPeter Quill 0100 110.51 2112 311.53 4124 512.55 6136 713.57 8148 914.59 101510 1115.511 121612 1316.513 141714 1517.515 161816 1718.517 181918 1919.519 20 Y(m) = 0.5x + 10(m) Y(m) = 1x
 = 0.5x + 10(m) Y(m) = 1x.")
86
SCENARIO 2: Groot is at position 0 meters; Peter Quill is at position -10 meters. TimeGrootPeter Quill 00-10 10.5-9 21-8 31.5-7 42-6 52.5-5 63-4 73.5-3 84-2 94.5 1050 115.51 1262 136.53 1474 157.55 1686 178.57 1898 199.59 2010 Y(m) = 0.5x Y(m) = 1x – 10(m)
 = 0.5x Y(m) = 1x – 10(m).")
89
Test Tomorrow Lab Improvement Paper Due Monday

90
Next time question Position vs Time graph Axis Slope Velocity vs. Time Unit 1 worksheet 1 Work in groups What is not finished is homework.

91
http://www.arborsci.com/NTQ/NTQ_SLM_5 QA.pdf

92
Displacement Motion Maps Worksheet Quiz Friday

93
What is Displacement? How is it different than Position and Distance? What Information does Displacement give?

94
The change in position is the displacement. It can be both positive and negative like position. Calculate how far car has travelled when it travels at a constant velocity of 5 m/s for 20 seconds

95
10 meters Now this can be calculated many different ways using velocity and time. All of you have calculated it algebraically. How can you graphically come up with the answer?

96
20 seconds 5 m/s

97
The area under the curve on a velocity vs. time graph gives you the displacement Check the units Extra examples (board)
.")
98
Think of them as tiny snap shots of time Each dot represents an even increment of time The arrow represent a velocity

99
Consider the interpretation of the motion map below. At time t = 0, cyclist A starts moving to the right at constant velocity, at some position to the right of the origin. Cyclist B starts at the origin and travels to the right at a constant, though greater velocity. At what time does cyclist B overtake A?

100
Draw a motion map of a person walking at 5m/s for 10 seconds Draw a motion map of a man walking -5 m/s for 10 seconds Draw a motion map of a man walking 5 m/s for 5 seconds, remaining idle for 1 second, and then travelling -5 m/s for 5 seconds

101
Opener Recap Displacement Motion Maps Worksheet Quiz tomorrow

102
A Roller Bladder skates at 40 m/s west for a minute. She then stops and takes off her skates in 10 seconds. She then decides to walk to the gas station east at 2 m/s in 2 mins. Finally she gives up from exhaustion and sleeps on the sidewalk What is her average velocity? What is her average speed? What is her displacement? Draw a motion map

103
What is Displacement? How is it different than Position and Distance? What Information does Displacement give?

104
The change in position is the displacement. It can be both positive and negative like position. Calculate how far car has travelled when it travels at a constant velocity of 5 m/s for 20 seconds

105
10 meters Now this can be calculated many different ways using velocity and time. All of you have calculated it algebraically. How can you graphically come up with the answer?

106
20 seconds 5 m/s

107
The area under the curve on a velocity vs. time graph gives you the displacement Check the units Extra examples (board)
.")
108
Think of them as tiny snap shots of time Each dot represents an even increment of time The arrow represent a velocity

109
Consider the interpretation of the motion map below. At time t = 0, cyclist A starts moving to the right at constant velocity, at some position to the right of the origin. Cyclist B starts at the origin and travels to the right at a constant, though greater velocity. At what time does cyclist B overtake A?

110
Rest of the period to ask for help and work together Before you may leave I must see your worksheet to give you a grade Quiz tomorrow don’t forget

Similar presentations


, Day 1>")
a. Students should understand the general relationships between position velocity & acceleration for a particle.>")

 HW: Test – Monday – study! Bring your Metric Patrol with you to class on test day.>")


