Download presentation
Presentation is loading. Please wait.

1
Pathobiochemistry of liver

2
LIVER STRUCTURE sinusoids central vein portal vein bile canaliculi
hepatic artery bile duct sinusoids bile canaliculi central vein 2

3
LIVER FUNCTIONS Distribution of nutrients
All types of metabolism (protein, lipid, carbohydrate, vitamin, mineral) Excretory (bile acids, urea synthesis) Destruction of toxic substances Depot of iron, vitamins 3
 Excretory (bile acids, urea synthesis) Destruction of toxic substances. Depot of iron, vitamins. 3.")
4
METABOLISM OF CARBS IN LIVER
glycolisis metabolism of fructose and galactose gluconeogenesis release of glucose into blood (maintain the stable glucose concentration in blood) conversion of pyruvate into acetyl CoA tricarboxylic acid cycle pentose phosphate pathway glycogenolysis, glycogenogenesis 4
 conversion of pyruvate into acetyl CoA. tricarboxylic acid cycle. pentose phosphate pathway. glycogenolysis, glycogenogenesis. 4.")
5
METABOLISM OF LIPIDS IN LIVER
synthesis of lipoproteins synthesis of triacylglyserols synthesis of phospholipids synthesis of fatty acids, elongation of fatty acids chain, desaturation synthesis of cholesterol ketone bodies formation lipolysis fatty acids oxidation 5

6
METABOLISM OF PROTEINS IN LIVER
protein synthesis, including blood plasma proteins protein decomposition; urea synthesis conversion of proteins into carbs and lipids interconversion of aminoacids conversion of proteins into low molecular weight nitrogen containing substances 6

7
Vitamin metabolism in liver
Formation of active form of vitamin D Formation of vitamin A from carotins Depo of cyanocobalamine and folic acid Depo of vitamin E Phosphorilation of vitamins B, formation of coenzyme forms 7

8
DETOXIFICATION OF TOXIC SUBSTANCES IN LIVER
Phase I and phase II. Phase I: hydrolysis, reduction, oxidation. These reactions introduce functional group (—OH, —NH2, —SH, or —COOH) and usually result in a little increase of hydrophylic properties 8
 and usually result in a little increase of hydrophylic properties. 8.")
9
conjugation with glutathione,
Phase II includes: glucuronation, sulfation, acetylation, methylation, conjugation with glutathione, conjugation with aminoacids (glycin, taurin, glutamic acid) Phase II results in the marked increase of hydrophylic properties of xenobiotic. 9
 Phase II results in the marked increase of hydrophylic properties of xenobiotic. 9.")
10
General ways of xenobiotics biotransformation and their localization in cell
REACTION ENZYME LOCALIZATION PHASE I Hydrolysis Reduction Oxidation Esterase Peptidase Epoxide hydrolase Azo- and nitro-reduction Carbonyl reduction Disulfide reduction Sulfoxide reduction Alcohol dehydrogenase Aldehyde dehydrogenase Aldehyde oxidase Xanthine oxidase Monoamine oxidase Diamine oxidase Flavin-monooxygenases Cytochrome P450 Microsomes, cytosol, lysosomes, blood lysosomes Microsomes, cytosol Microflora, microsomes, cytosol Cytosol, blood, microsomes Cytosol Mitochondria, cytosol Mitochondria Microsomes PHASE II Glucuronide conjugation Sulfate conjugation Glutathione conjugation Amino acid conjugation Acetylation Methylation Cytosol, microsomes Mitochondria, microsomes Cytosol, microsomes, blood 10

11
PHASE I Hydrolysis Reduction
Esterases (carboxyesterases, cholinesterases, phosphatases) Peptidases Reduction Metals and xenobiotics containing aldehyde, keto, disulfide, alkyn, azo, or nitro group are often reduced Reducing agents: Reduced glutathione, FADH2, FMN, NADH NADPH. 11
 Peptidases. Reduction. Metals and xenobiotics containing aldehyde, keto, disulfide, alkyn, azo, or nitro group are often reduced. Reducing agents: Reduced glutathione, FADH2, FMN, NADH. NADPH. 11.")
12
Alcohol dehydrogenase
Oxidation Alcohol dehydrogenase 12

13
Aldehyde dehydrogenase Xanthine dehydrogenase-Xanthine oxidase
Oxidizes aldehydes to carbonic acids Xanthine dehydrogenase-Xanthine oxidase Monoaminooxidase Oxidative deamination of amines (serotonin) and many xenobiotics 13
 and many xenobiotics. 13.")
14
Cytochrom P450 The highest concentration – in endoplasmic reticulum of hepatocytes (microsomes). Hem containing protein. Catalyzes monooxigenation of oxygen atom into substrate; another oxygen atom is reduced to water Electrons are transferred from NADPH to cytochrome P450 through flavoprotein NADPH-cytochrome P450 reductase. 14

15
SCHEME OF MONOOXYGENASE SYSTEM
15

16
16

17
The example of reaction that is catalyzed by cytochrome P450: hydroxylation of aliphatic carbon
17

18
The example of reaction that is catalyzed by cytochrome P450: hydroxylation of aromatic carbon
18

19
JAUNDICES 19

20
NORMAL METABOLISM OF BILE PIGMENTS
CELLS OF RES Indirect bilirubin NADP+ NADPH2 Biliverdin reductase Biliverdin Iron Globin Verdoglobin Hemoxi-genase Hemoglobin ERYTHROCYTES KIDNEYS Stercobilinogen URINE Stercobilin Indirect bilirubin 1,7-20,5 mkmol/l albumin UDP-glucoronil-transferase Direct bilirubin mkmol/l BLOOD LIVER Bilirubin mono-glucoronid, 20 % Bilirubin di-glucoronid, 80 % Dipyrols -glucoro-nidase Glucoronic acid Direct bilirubin BILE INTESTINE Mesobilirubin Mesobilirubin (urobilinogen) STOOL 20
 STOOL. 20.")
21
METABOLISM OF BILE PIGMENTS IN HEMOLYTIC JAUNDICE
CELLS OF RES Indirect bilirubin albumin Biliverdin reductase UDP-glucoronil-transferase Direct bilirubin NADP+ NADPH2 Biliverdin Iron Globin Verdoglobin Hemoglobin Hemoxi- genase BLOOD LIVER Bilirubin mono-glucoronid, 20 % Bilirubin diglucoronid, 80 % -glucoro- nidase Glucoronic acid BILE ERYTHROCYTES KIDNEYS INTESTINE STOOL Stool hypercholic URINE Urine dark Mesobilirubin Mesobilinogen (urobilinogen) Stercobilinogen Stercobilin Urobilin 21
 Stercobilinogen. Stercobilin. Urobilin. 21.")
22
METABOLISM OF BILE PIGMENTS IN HEPATIC JAUNDICE
CELLS OF RES Indirect bilirubin albumin Biliverdin reductase UDP-glucoronil-transferase Direct bilirubin NADP+ NADPH2 Biliverdin Iron Globin Verdoglobin Hemoglobin Hemoxi- genase BLOOD LIVER Bilirubin mono-glucoronid, 20 % Bilirubin diglucoronid, 80 % -glucoro- nidase Glucoronic acid BILE ERYTHROCYTES KIDNEYS Urobilinogen INTESTINE STOOL Stool hypocholic URINE Urine dark Stercobi-linogen Stercobilin Bilirubin Urobilin Mesobilirubin Mesobilinogen (urobilinogen) Stercobilinogen 22
 Stercobilinogen. 22.")
23
METABOLISM OF BILE PIGMENTS IN OBSTRUCTIVE JAUNDICE
CELLS OF RES Indirect bilirubin albumin Biliverdin reductase UDP-glucoronil-transferase Direct bilirubin NADP+ NADPH2 Biliverdin Iron Globin Verdoglobin Hemoglobin Hemoxi- genase BLOOD LIVER Bilirubin mono-glucoronid, 20 % Bilirubin diglucoronid, 80 % Bile acids -glucoro- nidase Glucoronic acid BILE ERYTHROCYTES KIDNEYS INTESTINE STOOL Stool acholic, steatorhea URINE Direct bilirubin Bile acids Urine dark, foaming 23

24
Etiology and pathogenesis of liver insufficiency
• Infectious agents (hepatitis B virus, tuberculosis bacillus, helmints) • Hepatotropic poison (drugs - tetracycline, sulfonamides, industrial poisons - carbon tetrachloride, arsenic, chloroform, vegetable poisons - aflatoxin, muscarine) • Physical impacts (ionizing radiation) • Biological drugs (vaccines, serums) • Violation of blood circulation (thrombosis, embolism, venous congestion) • Endocrine pathology (diabetes mellitus, hyperthyroidism) • Tumors • Hereditary ensymopathy
 • Hepatotropic poison (drugs - tetracycline, sulfonamides, industrial poisons - carbon tetrachloride, arsenic, chloroform, vegetable poisons - aflatoxin, muscarine) • Physical impacts (ionizing radiation) • Biological drugs (vaccines, serums) • Violation of blood circulation (thrombosis, embolism, venous congestion) • Endocrine pathology (diabetes mellitus, hyperthyroidism) • Tumors • Hereditary ensymopathy.")
25
Causes of Liver Failure

26
Consequences of Liver Failure

27
Fibrosis and Cirrhosis of the Liver

28
Fibrosis and Cirrhosis of the Liver

29
Clinical syndromes in liver injury
Lack of liver disorders manifested its functions lesion: • metabolic (involved in carbohydrate, fat, protein metabolism, metabolism of vitamins, hormones, biologically active substances) • protection (phagocytic and antitoxic) • digestive and excretory (the formation and release of bile) • hemodynamic (involved in maintaining systemic circulation).
 • protection (phagocytic and antitoxic) • digestive and excretory (the formation and release of bile) • hemodynamic (involved in maintaining systemic circulation).")
30
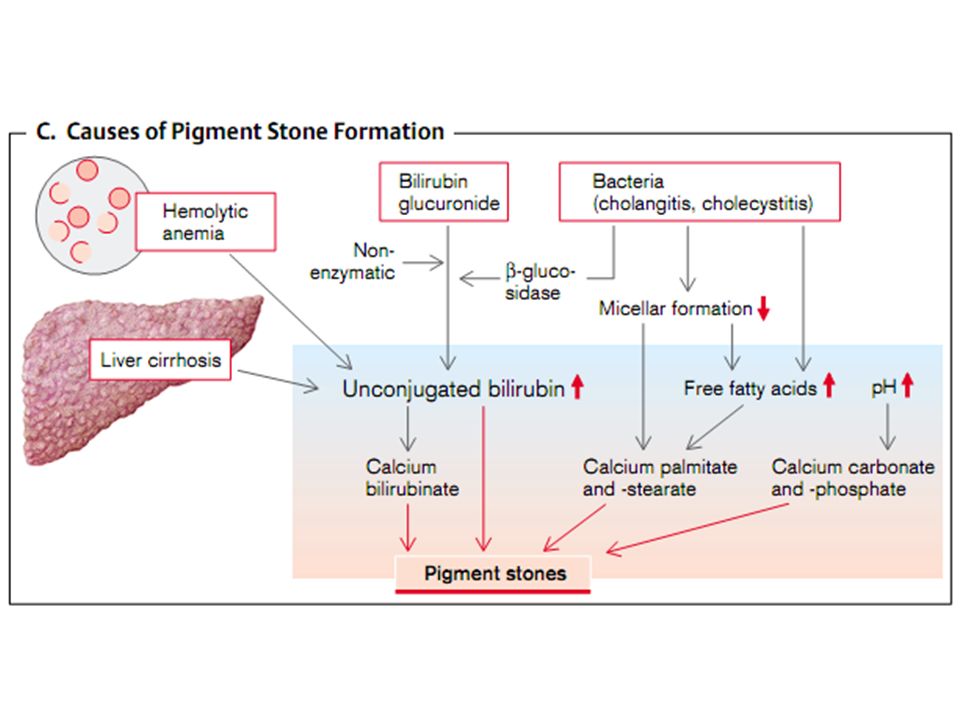
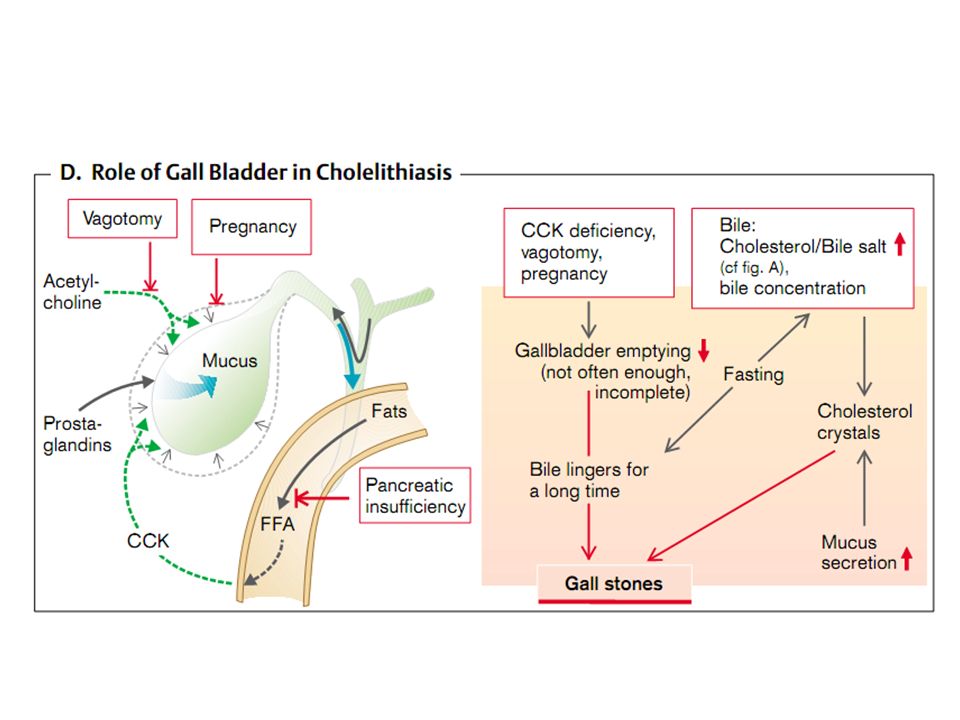
Cholelithiasis: Abnormal Cholesterol to Bile Salt Ratio

31
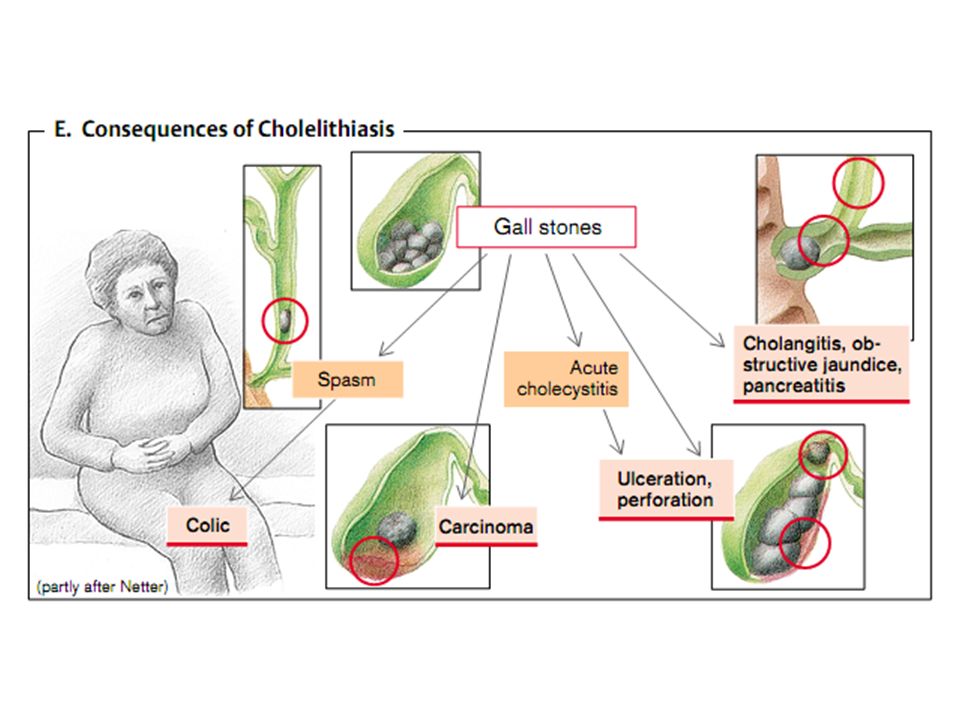
Clinical syndromes of jaundice
Acholia associated with non-receipt of bile in the intestine due to violations of the formation and outflow of bile. Acholia manifested disorders of digestion and absorption of fats, hypovitaminosis A, E, K, decreased intake of unsaturated fatty acids of phospholipids to build cell membranes, intestinal motility violation, increasing decay and fermentation. Dyscholia - violation of the physical-chemical properties of bile, causing it acquires the ability to form stones (due to genetic predisposition, poor nutrition, metabolic disorders, infectious-inflammatory processes, cholestasis).
.")
32
Cholelithiasis: Abnormal Cholesterol to Bile Salt Ratio

37
Etiology and pathogenesis of jaundice
Jaundice - a syndrome caused by an increase in blood bilirubin (hemolytic, parenchymal, mechanical). In hemolytic jaundice due to destruction of a large number of red blood cells accumulate indirect, protein bound bilirubin. When parenchymal jaundice disturbed capture, and excretion of bilirubin in hepatocytes due to their injuries. In mechanical jaundice occurs outflow obstruction of bile, compression of biliary tract tumor or scar, closing within a stone, worms, thick bile.
. In hemolytic jaundice due to destruction of a large number of red blood cells accumulate indirect, protein bound bilirubin. When parenchymal jaundice disturbed capture, and excretion of bilirubin in hepatocytes due to their injuries. In mechanical jaundice occurs outflow obstruction of bile, compression of biliary tract tumor or scar, closing within a stone, worms, thick bile.")
38
Mechanisms and Consequences of Cholestasis

39
Methods of experimental study of liver pathology
hepatic-cell failure simulating full or partial removal of the liver, the introduction of poisons (carbon tetrachloride, chloroform, trinitrotoluene); • cholestatic model obtained by squising bile ducts by ligature; • hepatic vascular insufficiency simulating by overlapping portocaval anastomosis, ligation portal vein, hepatic vein, hepatic artery.
; • cholestatic model obtained by squising bile ducts by ligature; • hepatic vascular insufficiency simulating by overlapping portocaval anastomosis, ligation portal vein, hepatic vein, hepatic artery.")
Similar presentations


>")


 fate of xenobiotic -- central role of metabolism Uptake/Transport --------> Metabolism -------------> Excretion Or Storage 2.) xenobiotic converted.>")
 LIVER FUNCTION AND THE BILIARY TRACT LECTURE ONE Dr. Essam H. Aljiffri.>")


Amino acids to glucose. 1450 cm 3 of blood flows through.>")

