Download presentation
Presentation is loading. Please wait.

1
MATH1342 S08 – 7:00A-8:15A T/R BB218 SPRING 2014 Daryl Rupp

2
What proportion of southern Iowa homes have soft water? A sample of 6 homes in 6 cities found 3 had soft water. What is the conclusion? 1. 0.50 of the homes in southern Iowa have soft water. 1. 0.50 of the homes in southern Iowa have soft water. 2. Approximately 0.50 of the homes in southern Iowa have soft water. 2. Approximately 0.50 of the homes in southern Iowa have soft water. 3. We can not make a conclusion. 3. We can not make a conclusion. 4. Between 0.33 an 0.67 of the homes have soft water, 4. Between 0.33 an 0.67 of the homes have soft water, 5. There is an 80% confidence that between 0.33 and 0.67 of the homes have soft water. 5. There is an 80% confidence that between 0.33 and 0.67 of the homes have soft water. NOTE: See Problem 10 of the homework for a great example

5
STATISTICS The science of collecting, organizing, summarizing and analyzing data to draw conclusions or answering questions, with a given amount of confidence concerning the answer. The science of collecting, organizing, summarizing and analyzing data to draw conclusions or answering questions, with a given amount of confidence concerning the answer. In other words, it is the method or process used in finding an answer to a question, with a specific amount of confidence that the answer is correct. In other words, it is the method or process used in finding an answer to a question, with a specific amount of confidence that the answer is correct.

6
THE SCIENTIFIC METHOD 1. Define the question & scope to be investigated 1. Define the question & scope to be investigated 2. Gather information & resources to define hypothesis 2. Gather information & resources to define hypothesis 3. Perform experiment & gather data 3. Perform experiment & gather data 4. Analyze date 4. Analyze date 5. Interpret data and draw conclusion which may lead to a starting point for continued investigation 5. Interpret data and draw conclusion which may lead to a starting point for continued investigation 6. Retest to verify results (usually done by others) or revise hypothesis and start new investigation 6. Retest to verify results (usually done by others) or revise hypothesis and start new investigation
 or revise hypothesis and start new investigation 6. Retest to verify results (usually done by others) or revise hypothesis and start new investigation.")
7
TWO TYPES OF STATSISTICS Descriptive is about organizing and summarizing data in order to picture the nature of the population or sample represented by the data. (Ch’s 2 – 3) Descriptive is about organizing and summarizing data in order to picture the nature of the population or sample represented by the data. (Ch’s 2 – 3) Inferential is the process or method of generalizing the results from a sample to the entire population and measuring the reliability of that answer (Ch’s 9 – 11, 4) Inferential is the process or method of generalizing the results from a sample to the entire population and measuring the reliability of that answer (Ch’s 9 – 11, 4)
 Descriptive is about organizing and summarizing data in order to picture the nature of the population or sample represented by the data. (Ch’s 2 – 3) Inferential is the process or method of generalizing the results from a sample to the entire population and measuring the reliability of that answer (Ch’s 9 – 11, 4) Inferential is the process or method of generalizing the results from a sample to the entire population and measuring the reliability of that answer (Ch’s 9 – 11, 4).")
8
DEFINITIONS POPULATION: The entire group of individuals being investigated (size is N). Must be precisely defined. POPULATION: The entire group of individuals being investigated (size is N). Must be precisely defined. INDIVIDUAL: One member of the entire group or population. INDIVIDUAL: One member of the entire group or population. SAMPLE: A subset of individuals of a given size (n) taken from the population. SAMPLE: A subset of individuals of a given size (n) taken from the population.
. Must be precisely defined. INDIVIDUAL: One member of the entire group or population. INDIVIDUAL: One member of the entire group or population. SAMPLE: A subset of individuals of a given size (n) taken from the population. SAMPLE: A subset of individuals of a given size (n) taken from the population..")
9
DEFINITIONS VARIABLE: A given aspect of an individual. This would be the definition of the aspect. For example, if a population or sample consists of people then the variable could be weight, height, color of eyes, gender, etc. What aspects could be found for a individual country? VARIABLE: A given aspect of an individual. This would be the definition of the aspect. For example, if a population or sample consists of people then the variable could be weight, height, color of eyes, gender, etc. What aspects could be found for a individual country? DATA: The possible observations or outcomes for a variable concerning individuals. This is a label or a count of a measurement. DATA: The possible observations or outcomes for a variable concerning individuals. This is a label or a count of a measurement. CHARCTERISTIC: A summary of a numerical variable of a population or sample such as mean, max, range or standard deviation. Label data can not be summarized. CHARCTERISTIC: A summary of a numerical variable of a population or sample such as mean, max, range or standard deviation. Label data can not be summarized.

10
DEFINITIONS DATA CONSISTS OF ATTRIBUTES (Labels): Colors, Judgments, Grades (as is A, B, C, D, F), Names. DATA CONSISTS OF ATTRIBUTES (Labels): Colors, Judgments, Grades (as is A, B, C, D, F), Names. DATA CONSISTS OF NUMBERS FROM MEASUREMENTS OR COUNTS: Weights, Polls, Surveys, Temperatures, Lengths, Bowling scores, Number of Home Runs. DATA CONSISTS OF NUMBERS FROM MEASUREMENTS OR COUNTS: Weights, Polls, Surveys, Temperatures, Lengths, Bowling scores, Number of Home Runs.
: Colors, Judgments, Grades (as is A, B, C, D, F), Names. DATA CONSISTS OF NUMBERS FROM MEASUREMENTS OR COUNTS: Weights, Polls, Surveys, Temperatures, Lengths, Bowling scores, Number of Home Runs. DATA CONSISTS OF NUMBERS FROM MEASUREMENTS OR COUNTS: Weights, Polls, Surveys, Temperatures, Lengths, Bowling scores, Number of Home Runs..")
11
DEFINITIONS Characteristics (numerical) that come from the POPULATION are called PARAMETERS. Characteristics (numerical) that come from the POPULATION are called PARAMETERS. Characteristics (numerical) that come from a SAMPLE are called STATISTICS. Characteristics (numerical) that come from a SAMPLE are called STATISTICS. If the data comes from labels then not called either (as no numerical summary is possible for Qualitative data). If the data comes from labels then not called either (as no numerical summary is possible for Qualitative data).
 that come from the POPULATION are called PARAMETERS. Characteristics (numerical) that come from a SAMPLE are called STATISTICS. Characteristics (numerical) that come from a SAMPLE are called STATISTICS. If the data comes from labels then not called either (as no numerical summary is possible for Qualitative data). If the data comes from labels then not called either (as no numerical summary is possible for Qualitative data)..")
12
DEFINITIONS QUALITATIVE DATA comes from LABELS. QUALITATIVE DATA comes from LABELS. QUANTITATIVE DATA comes from NUMERICAL data QUANTITATIVE DATA comes from NUMERICAL data

13
DEFINITIONS DISCRETE DATA comes from counts and are whole numbers (have no decimal parts). DISCRETE DATA comes from counts and are whole numbers (have no decimal parts). CONTINUOUS DATA comes from measurements and are real numbers (may have decimal parts) CONTINUOUS DATA comes from measurements and are real numbers (may have decimal parts) NOTE: LABELS are neither NOTE: LABELS are neither
. CONTINUOUS DATA comes from measurements and are real numbers (may have decimal parts) CONTINUOUS DATA comes from measurements and are real numbers (may have decimal parts) NOTE: LABELS are neither NOTE: LABELS are neither.")
14
A SIDE NOTE Statistics is all about the number line. Statistics is all about the number line. Draw a number line for the interval 0 to 5. Draw a number line for the interval 0 to 5. Draw a number line centered at o and going 6 units in each direction. Draw a number line centered at o and going 6 units in each direction. Draw a number line for the interval – 3 to +3. Draw a number line for the interval – 3 to +3. Draw a number line from – infinity to infinity Draw a number line from – infinity to infinity

15
DEFINITIONS TWO METHODS OF OBTAINING DATA: TWO METHODS OF OBTAINING DATA: OBSERVATION: Data from observing, only. Not interfering with the process in any way. OBSERVATION: Data from observing, only. Not interfering with the process in any way. EXPERIMENTATION: Data from controlling some factors of a process. Often involves comparing results of two or more values of a control factor. Involves the interference by the investigator. EXPERIMENTATION: Data from controlling some factors of a process. Often involves comparing results of two or more values of a control factor. Involves the interference by the investigator.

16
LEVELS OF MEASUREMENT (Defines how data can be analyzed) Nominal: Values of the variables are names or labels; they can not be ranked or ordered (like color of eyes). Ordinal: Values of the variables are names or labels but they can be ordered but no numeric value so cannot find differences (like letter grades)
.")
17
LEVELS OF MEASUREMENT Interval: Values of the variables have the property of being ordered and can be compared (find real differences) but have no absolute zero (like temperature). Interval: Values of the variables have the property of being ordered and can be compared (find real differences) but have no absolute zero (like temperature). Ratio: Values of the variables are like interval, but have absolute meaning – there is a 0 values that means that absence of value (like weight) Ratio: Values of the variables are like interval, but have absolute meaning – there is a 0 values that means that absence of value (like weight)
 but have no absolute zero (like temperature). Ratio: Values of the variables are like interval, but have absolute meaning – there is a 0 values that means that absence of value (like weight) Ratio: Values of the variables are like interval, but have absolute meaning – there is a 0 values that means that absence of value (like weight).")
18
SPECIAL NOTE The data you collect is not the answer or analysis to the question you are investigating. The data you collect is not the answer or analysis to the question you are investigating. The data you collect is the result of the question you ask or the instructions you give. The data you collect is the result of the question you ask or the instructions you give. Examples Examples

19
TYPES OF SAMPLING Sampling: Obtaining the data from a number (size n) of individuals from a population (size N). Sampling: Obtaining the data from a number (size n) of individuals from a population (size N). Simple Random Sampling: Where every individual in the population has an equal chance of being selected. The best and the goal of sampling methods. Simple Random Sampling: Where every individual in the population has an equal chance of being selected. The best and the goal of sampling methods.
 of individuals from a population (size N). Simple Random Sampling: Where every individual in the population has an equal chance of being selected. The best and the goal of sampling methods. Simple Random Sampling: Where every individual in the population has an equal chance of being selected. The best and the goal of sampling methods..")
20
TYPES OF SAMPLING Stratified Sampling: Separating the population into non overlapping groups (strata) and then selecting simple random samples from each group. Stratified Sampling: Separating the population into non overlapping groups (strata) and then selecting simple random samples from each group. Systematic Sampling: Obtained by selecting every k th member of the population. Systematic Sampling: Obtained by selecting every k th member of the population.
 and then selecting simple random samples from each group. Systematic Sampling: Obtained by selecting every k th member of the population. Systematic Sampling: Obtained by selecting every k th member of the population..")
21
TYPES OF SAMPLING Cluster Sampling: Dividing the population into groups (or clusters) and selecting all the individuals from that cluster. Cluster Sampling: Dividing the population into groups (or clusters) and selecting all the individuals from that cluster. Convenience Sampling: Individuals are selected on the ease of obtaining them and not randomly from the population. Convenience Sampling: Individuals are selected on the ease of obtaining them and not randomly from the population. Voluntary Sampling (Type of convenience): Worst possible. Voluntary Sampling (Type of convenience): Worst possible. See section 1.4 for complete discussion of sampling methods See section 1.4 for complete discussion of sampling methods
 and selecting all the individuals from that cluster. Convenience Sampling: Individuals are selected on the ease of obtaining them and not randomly from the population. Convenience Sampling: Individuals are selected on the ease of obtaining them and not randomly from the population. Voluntary Sampling (Type of convenience): Worst possible. Voluntary Sampling (Type of convenience): Worst possible. See section 1.4 for complete discussion of sampling methods See section 1.4 for complete discussion of sampling methods.")
22
BIAS IN SAMPLING Always Try to Avoid Bias Always Try to Avoid Bias Two Types: Intentional and Unintentional Two Types: Intentional and Unintentional Sampling: Method tends to favor one section of population. One section is under represented. Sampling: Method tends to favor one section of population. One section is under represented. Non-response Bias: From Voluntary Sampling where individuals can refuse to take part. Non-response Bias: From Voluntary Sampling where individuals can refuse to take part.

23
BIAS IN SAMPLING Response Bias: Answers do not reflect true feelings of responder Caused by: Response Bias: Answers do not reflect true feelings of responder Caused by: Interviewer error, the way the question is framed; Interviewer error, the way the question is framed; The choices and wording offered in survey; The choices and wording offered in survey; Order of questions or responses Order of questions or responses Plain old entry error. Plain old entry error. See 1.5 for complete discussion See 1.5 for complete discussion

24
Easy to Deceive Can be done graphically. Can be done graphically. Can be done numerically by focusing on numbers rather than relative proportion. Can be done numerically by focusing on numbers rather than relative proportion. Can be done by fudging numbers. Can be done by fudging numbers.

25
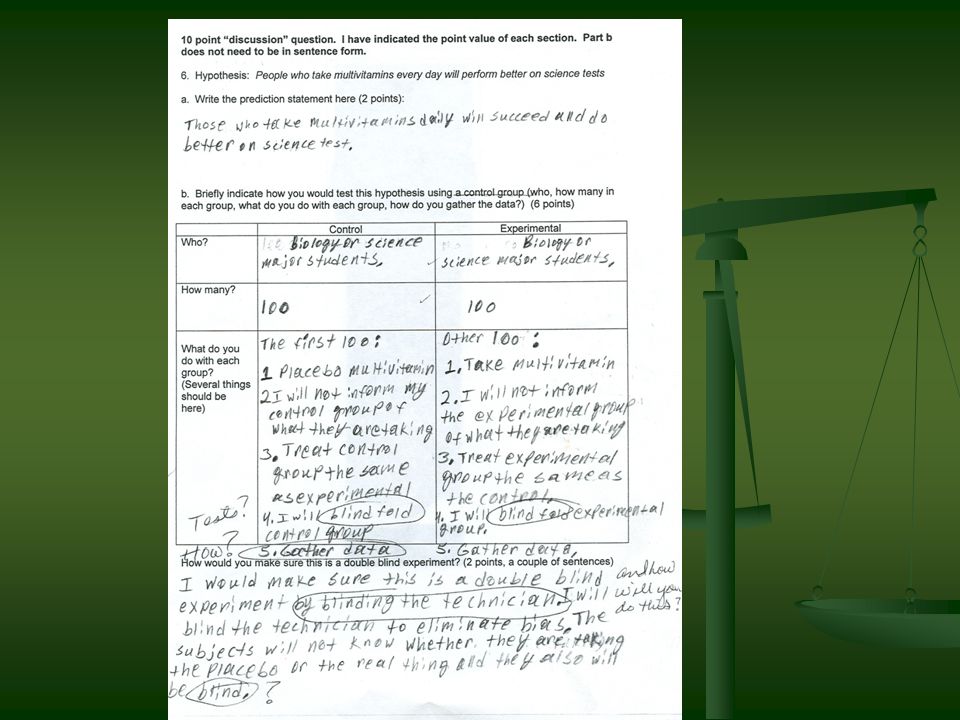
EXPERIMETAL TYPES CONTROL FACTORS: All processes have random results, but the results can be somewhat limited through control factors. By changing these factors the results can be changed. CONTROL FACTORS: All processes have random results, but the results can be somewhat limited through control factors. By changing these factors the results can be changed. BLIND STUDIES: Can lead to Bias. BLIND STUDIES: Can lead to Bias. DOUBLE BLIND STUDIES: The best. Used in many medical studies. Can involve the use of placebos or another medication. DOUBLE BLIND STUDIES: The best. Used in many medical studies. Can involve the use of placebos or another medication.

27
EXPERIMETAL TYPES

Similar presentations


 Chapter 1 Introduction and Data Collection.>")


