Download presentation
Presentation is loading. Please wait.

1
Innovation and Export the Secret to Growth in Manufacturing Searching for Solutions in Japan Dr John Blakemore Principal Blakemore Consulting International Sydney masc@blakemore.com.au www.blakemore.com.au

2
Australia Has a Problem Heavily in Deficit Despite Resources Boom

3
Trade Balance

4
JapanAustralia 1Economic Growth Rate (94 to 2004)%1.23.7 2GDP per Head$$36,170$32,020 3% workforce employed%52.050.8 4Expenditure on R&D % GDP%3.11.6 5Innovation Index5.74.4 6Unemployment (95 to 2004)%4.47.1 7Current Account (% of GDP)%3.7(6.2) 8Population Growth%0.21.1 9Inflation 2000 to 2005%(0.3)3.0 10Money Market Rate%0.05.5 11Household Savings Rate%6.9(3.0) 12Trade Balance$Bn132.0(18.1) 13Living Standard Rank GDP per Head20071122 14Living Standard Rank GDP per Head1900401 Australia Versus Japan
% GDP per Head$$36,170$32,020 3% workforce employed% Expenditure on R&D % GDP% Innovation Index Unemployment (95 to 2004)% Current Account (% of GDP)%3.7(6.2) 8Population Growth% Inflation 2000 to 2005%(0.3)3.0 10Money Market Rate% Household Savings Rate%6.9(3.0) 12Trade Balance$Bn132.0(18.1) 13Living Standard Rank GDP per Head Living Standard Rank GDP per Head Australia Versus Japan")
5
CSIRO Exp vs Comparative Adv

6
Parameters 1 The resources boom and a weak US$ has led to an elevation of the $A and squeezed manufactured exports…Dutch/Spanish Disease in the future? Labour costs often blamed (incorrect?) Serious infrastructure constraints Servicing costs on foreign debt high Interest rates high by global standards and will go up higher when Net Financial Debt seen as a problem (60% GDP, CAD = 6% GDP) Italy highest on record in 1924 at 7.1% of GDP, then, in 1925 what happened?
 Serious infrastructure constraints Servicing costs on foreign debt high Interest rates high by global standards and will go up higher when Net Financial Debt seen as a problem (60% GDP, CAD = 6% GDP) Italy highest on record in 1924 at 7.1% of GDP, then, in 1925 what happened .")
7
Parameters 2 R&D and Innovation are the key drivers of manufacturing growth and sustainability Australia’s private R&D investment is very low by world standards Australia concentrates its innovation and R&D in the middle of the supply chain. This effort is more valuable closer to the customer.

8
Innovation and Performance We need to be flexible and fast like Australia 2 in the America’s Cup in 1983 when we came from behind 3 to 1 and had to win the next 3 races in a row Even though we lost the next 3 starts we won the cup. The secret was the Ben Lexcen’s innovation. We need a winged keel!!!

9
Why Japan? Trades in Surplus despite being poor in natural resources and energy International manufacturers well above the rest in quality and value dedspite strong currency Able to move the culture of precision and manufacturing capability to a new high Live on innovation for growth

10
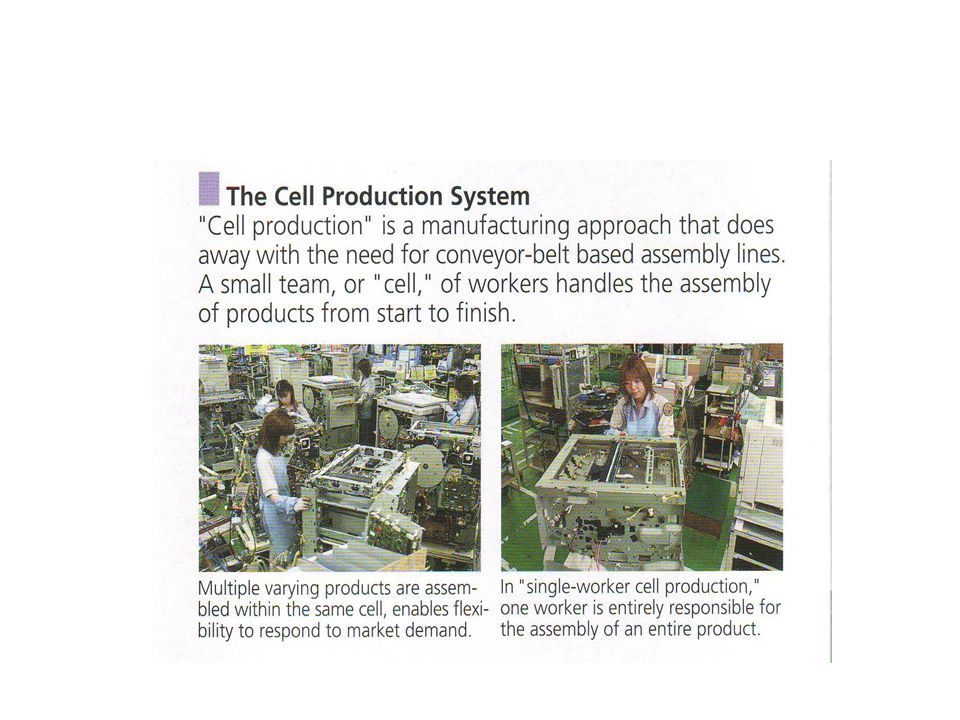
Which Companies? Canon (Excellent Quality) Honda (No 1 for Reliability) Toyota (TPS, Lean) Kawai ( Sydney International Piano Comp) Panasonic (Good all rounders) Sony????? ( Innovative but Unreliable)
 Honda (No 1 for Reliability) Toyota (TPS, Lean) Kawai ( Sydney International Piano Comp) Panasonic (Good all rounders) Sony . ( Innovative but Unreliable).")
11
Manufacturing or Service? There is no such thing as a pure manufacturing company All companies are service driven What is your position in the supply chain?

13
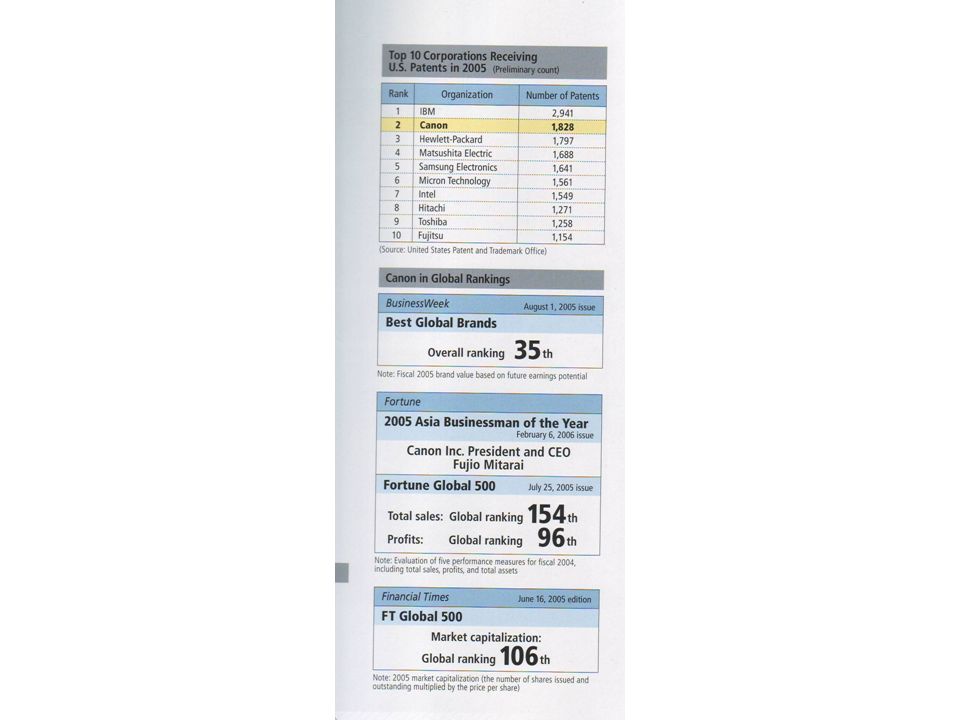
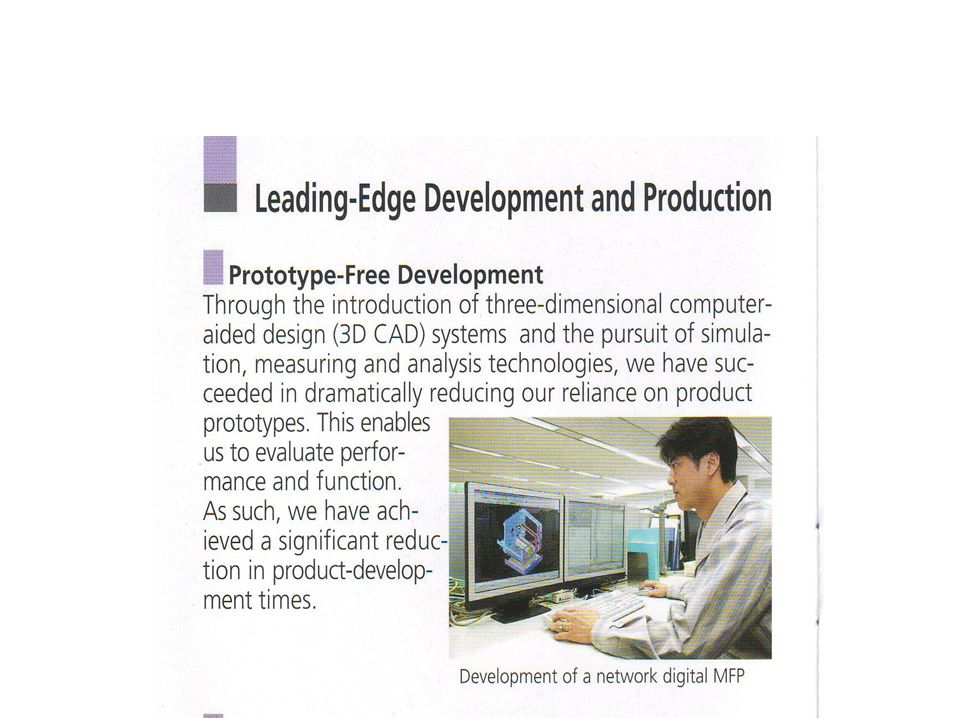
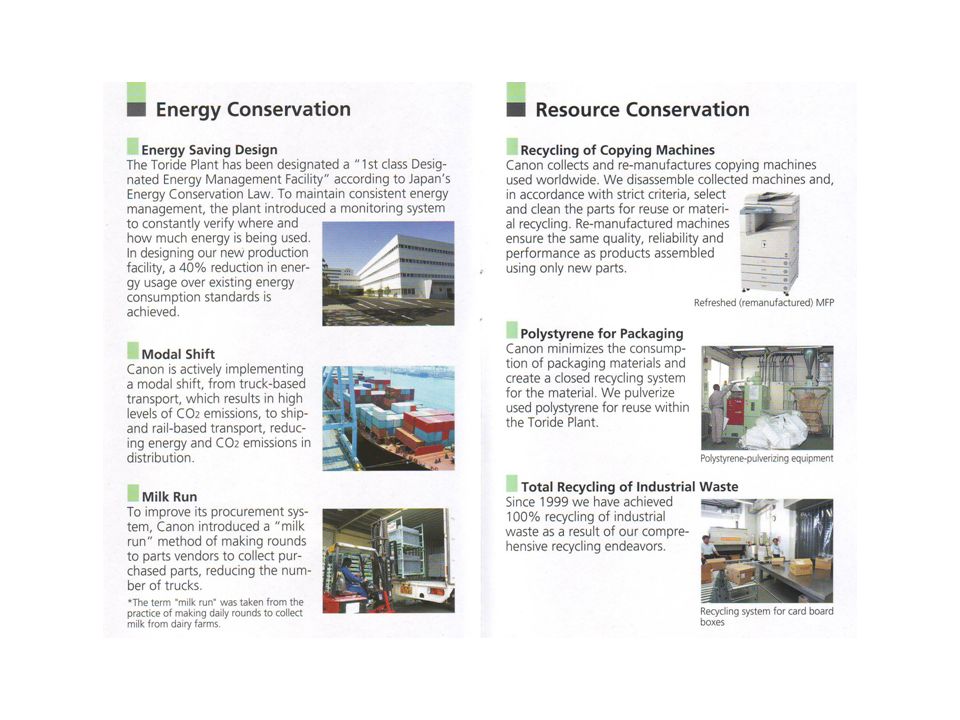
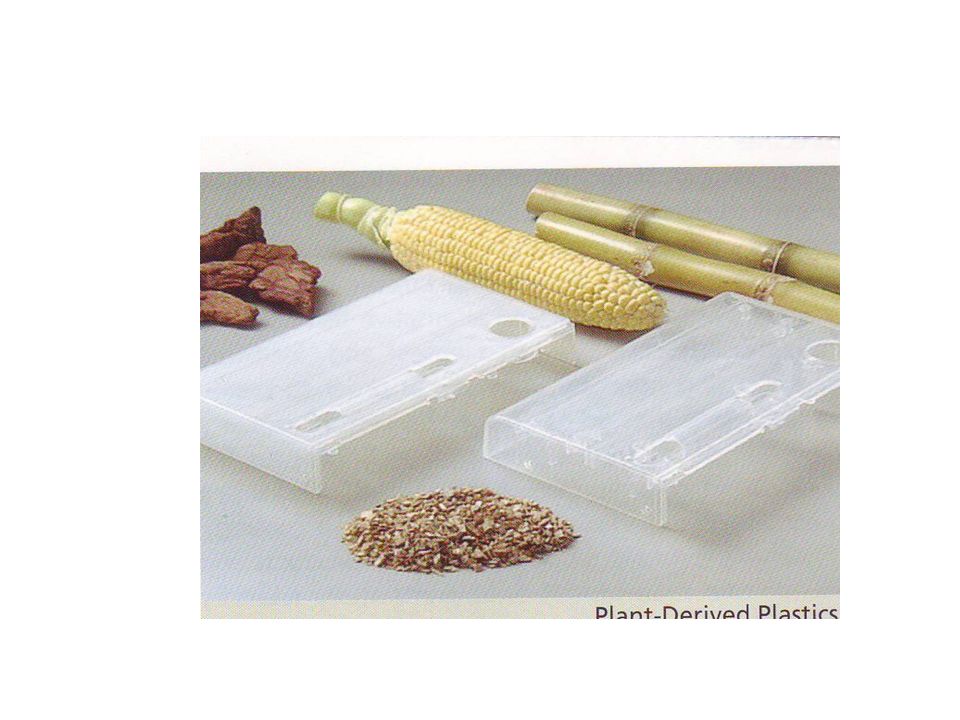
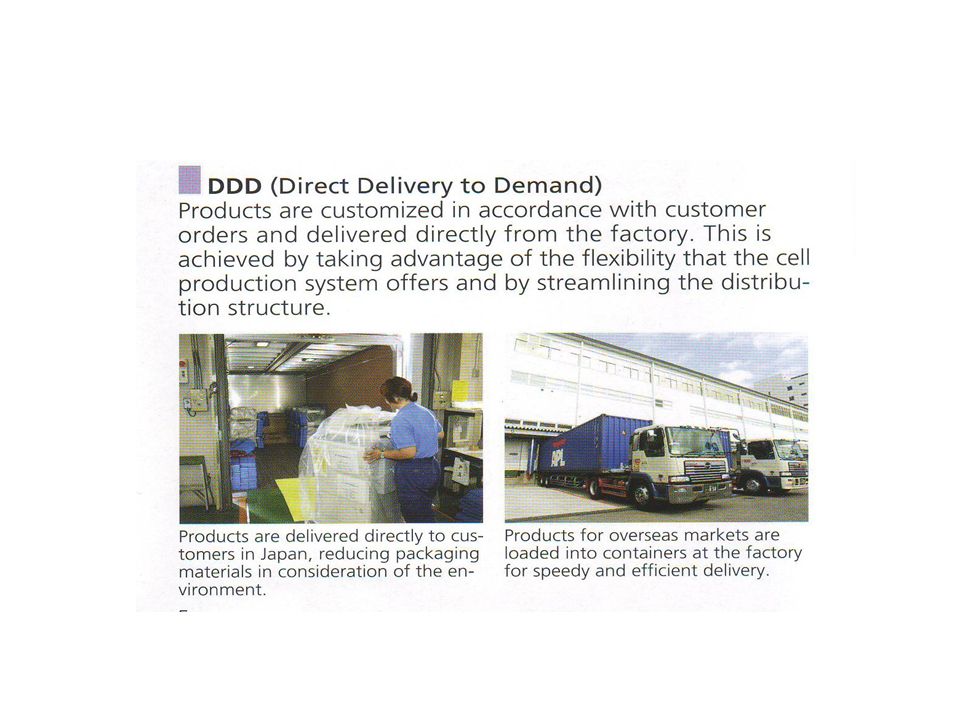
Canon Performance

23
Key Operational Ratios On Time Deliveries % (CROTD, Actual) =100% Changes to plan (nil) Planning lead Time (target 1 day) Lead Time ( Time to produce from RM = CRLT) Value Added Time (Run Time/ 168 )(aim 100%) Measures (Setup,Run,BD,PMT,Idle,CU), Manned Time (% Available = run time) % Major Ops with adequate backup personnel = 100%
 =100% Changes to plan (nil) Planning lead Time (target 1 day) Lead Time ( Time to produce from RM = CRLT) Value Added Time (Run Time/ 168 )(aim 100%) Measures (Setup,Run,BD,PMT,Idle,CU), Manned Time (% Available = run time) % Major Ops with adequate backup personnel = 100%")
24
My Australian R&D and Innovation Grant Observations 800 R&D Innovation Applications (6yrs) 50% received grants, 5% successful IP mostly exploited Overseas (e.g. Shi Zhengrong and Suntech) Tasmanian windfarm technology to China Small no. people rich Little National Benefit Favours Product over Process Innovation Commercial Ready needs Improvement!
 Tasmanian windfarm technology to China Small no. people rich Little National Benefit Favours Product over Process Innovation Commercial Ready needs Improvement!.")
25
Innovation Process versus Product There is no point in adding a new product to a bad system. Honda, Canon, Kawai, Toyota, Panasonic, all link Process and Product Innovation

26
Australian R&D How successful are we?

27
Reasons for Failure of Australian R&D and its Commercialisation Poor Understanding of the: 1.connection between Process & Product Innovation 2.use of correct resources (inc Partnerships, Pana/Leica) 3.ways to release working capital to max Technology 4.needs of the market (needs versus wants) 5.scientific method (observation and measurement) 6.need to articulate the concept and plan 7.way to raise funds to support the application 8.best way to use capital 9.measurement of risk 10.need to tap the wisdom of the worker 11. financial institutions risk averse

28
Where Do You Start? The World is your Market 1.Integrate processes and systems, pull by customer, then spread out both ways. 2. Substitute pull for MRP on short planning cycles 3. Use internal digital data on shorter periods 4. Hook up digitally with customers & suppliers 5. Eliminate forecasting as much as possible

29
How do we Implement Creative Manufacture and Innovation, The Step Beyond Lean ? It is all about People, Training, Culture, Leadership and Commitment

30
Rule 1 Make to Order (MTO) Demand = Production Pull by Customer Apply Continuous flow rules (26) Continuously reduce batch sizes by reducing the Economic Production Run (One piece Flow?) Plan by replacement short Lead t Reduce forecasting as much as possible
 Demand = Production Pull by Customer Apply Continuous flow rules (26) Continuously reduce batch sizes by reducing the Economic Production Run (One piece Flow ) Plan by replacement short Lead t Reduce forecasting as much as possible")
31
Rule 2 Maximum Flexibility Machine and Labour Match Manufacturing Capability with Demand Tirelessly improve flexibility by reducing EPR’s Continuously reduce lead time Focus on the financial parameters to prioritise Aim for continuous flow Maximise the use of Appropriate Technology (Six Sigma) A process can be treated like a machine (Adam Smith)
 A process can be treated like a machine (Adam Smith)")
32
Rule 3 Innovate Drive Product Innovation with Process Innovation

33
Rule 4 Use Digital Data Effectively Recognise that Digital Data can be obtained at the POS and sent to any point in the supply chain

34
Rule 5 Design for Flexibility Reduce Complexity Modularize Introduce Complexity late in SC Universal design (Toyota) Backup suppliers (standardise)
 Backup suppliers (standardise)")
35
Rule 6 Reduce Waste in All Forms Planning waste Expenses waste Resources waste

36
Some Values of Key Parameters Days Inventory = 8 Days (Canon Australia actually 38 Days but 30 Days on Water) Value add % = Never stop Improving (Samurai Warrior, Toyota < 10%) Planning Cycle = 7 days to one day R&D as % Sales = > 5% Process Control at 6 Sigma On Time Deliveries (CRLT) = 100%
 Value add % = Never stop Improving (Samurai Warrior, Toyota < 10%) Planning Cycle = 7 days to one day R&D as % Sales = > 5% Process Control at 6 Sigma On Time Deliveries (CRLT) = 100%")
37
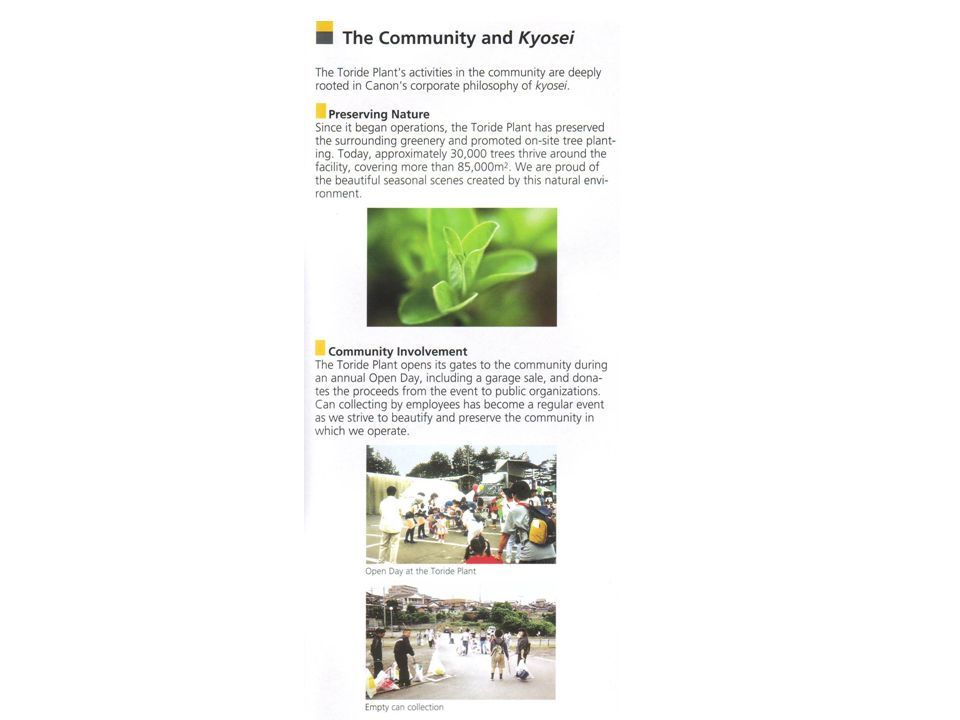
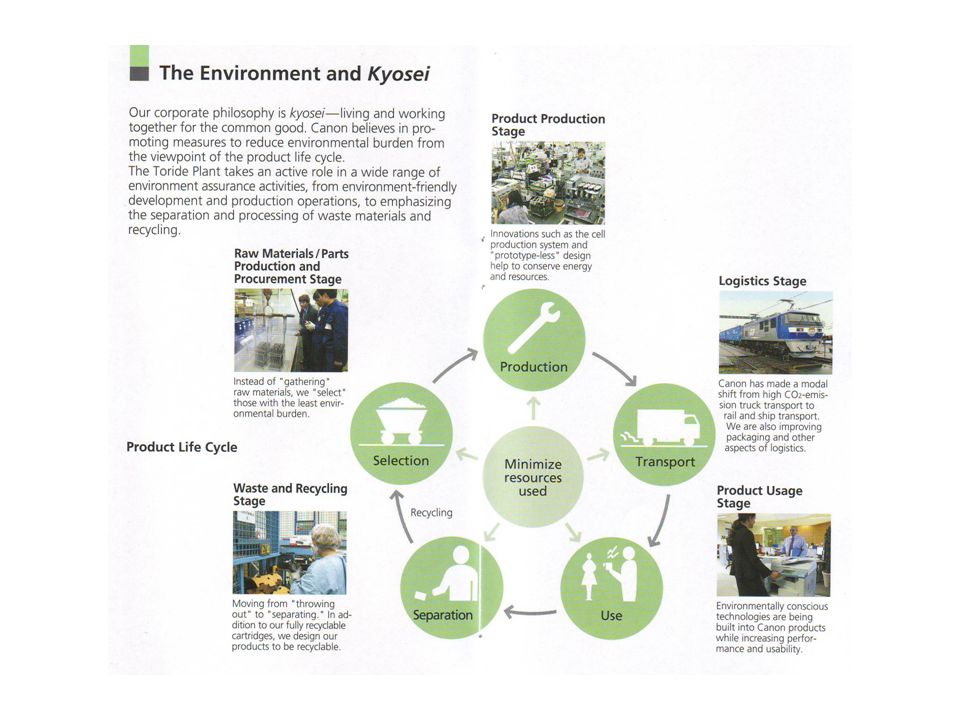
Kyosei Kyosei = Living and Working Together for the common good Kaizen = Continuous Improvement Genchi genbutsu = place of understanding Obeya = big room Sensai = teacher Poka-yoke = mistake-proofing Jidoka = stop machines (Toyoda Loom) Miyamoto Musashi “The Book of Five Rings” the Samurai warrior after Shogun liberation
 Miyamoto Musashi The Book of Five Rings the Samurai warrior after Shogun liberation")
38
Australian Example 1 Profit in $300M T/O (Ref Blakemore Consulting Reports )
")
39
Australian Example 2 (2X Productivity (Ref Blakemore Consulting Reports) Defectives
 Defectives")
40
Conclusion Build a flexible system that can respond to changing markets quickly and optimize the supply chain. Remove wasteful inventory by matching lead time and cycle time and continuously increasing value added time Use the capital released from wasteful inventory to innovate flexible systems and processes that can respond faster to new products. Continuously innovate new products and processes Use a consistent strategy based on the systems of Honda, Toyota and Canon Use all resources and be aware of the tools and knowledge available and foster partnerships with the best.

41
The End

Similar presentations


: Demonstrate understanding of how internal factors interact within a business that operates in a global context.>")


