Download presentation
Presentation is loading. Please wait.

1
Association of Metropolitan School Districts Presentation to Legislators December 2004

2
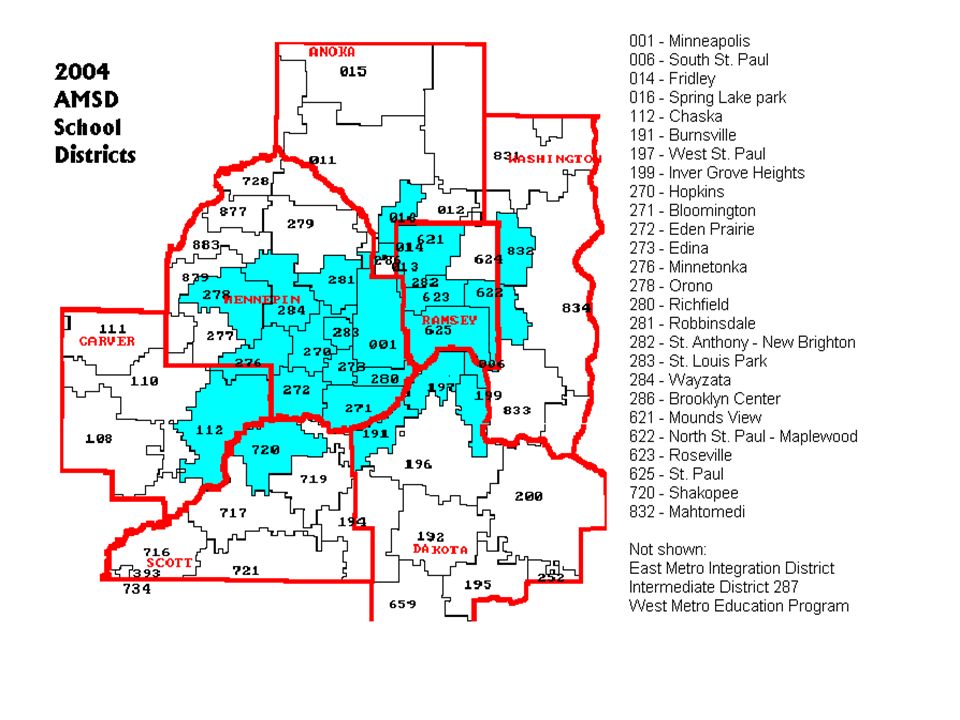
Association of Metropolitan School Districts AMSD represents: 26 Metro Area School Districts 3 Joint Powers Districts 242,688 students 29% of the E-12 students in Minnesota

4
AMSD’s Mission To advocate for state education policy that enables metropolitan school districts to improve student learning.

5
Presentation Overview Stabilize education funding Invest in educational excellence Eliminate the readiness gap Provide local control Improve teaching and assessment

6
Stabilize Education Funding

7
Identify a dedicated funding stream to pay for the state takeover of public education. There are several options that could restore some stability to education funding, including but not limited to: – Close income tax loops and increase compliance – Expand the sales tax base – Reinstate a general education property tax levy – Grant targeted levy authority to school boards

8
Invest in Educational Excellence

9
Average Annual Earnings of Workers by Educational Attainment Source: The Big Payoff: Educational Attainment and Synthetic Estimates of Work-Life Earnings. U.S. Census Bureau, July 2002.

10
Investments in Education Lead to Higher Income According to Art Rolnick, Senior Vice President and Director of Research at for the Federal Reserve Bank of Minneapolis: Minnesota’s per capita average income was 14 percent below the national average in 1929, but with increased investments in education, Minnesota’s average per capita income is now 8 percent above the national average.

11
Youth dependency: 0-14 population per 100 aged 15 to 64 Elderly dependency: 65+ population per 100 aged 15 to 64 Dependency ratios in Minnesota projected to rise Source: McCurry, Martha, Long-term Illustrative Population Projections for Minnesota. State Demographic Center, March 2003.

12
Invest in Educational Excellence Recommendation #1 Provide, at minimum, an inflationary increase in the basic formula allowance.

13
AMSD Districts Face Budget Shortfalls AMSD districts project a combined $88 million shortfall for the 2005-06 school year. (See Handout #1 for detail by district) Between FY 2003 and FY 2005, AMSD districts already reduced their budgets by over $200 million.
 Between FY 2003 and FY 2005, AMSD districts already reduced their budgets by over $200 million..")
14
Declining Enrollment Fails to Fully Explain Shortfalls House Research estimates total public school enrollment in Minnesota will only decline by 0.1% between the FY 2004-5 biennium and the FY 2006-07 biennium. In St. Paul only $4 million out of a $24.3 million deficit is attributable to declining enrollment. In the North St. Paul/ Maplewood/Oakdale school district only $491,000 out of a $4.5 million deficit is attributable to declining enrollment. Even school districts with increasing enrollment, such as Wayzata and Edina, face deficits for the 2005-06 school year.

15
Basic Formula Lags Behind Inflation Fiscal Year Basic formula increase (excluding roll-ins) CPIDifference 1992-930.0%3.0%-3.0% 1993-940.0%2.5%-2.5% 1994-950.0%3.0%-3.0% 1995-961.8%2.8%-1.0% 1996-970.0%2.3%-2.3% 1997-982.4%1.7%0.7% 1998-992.5%2.0%0.5% 1999-005.1%3.7%1.4% 2000-014.6%3.2%1.3% 2001-022.9%1.1%1.8% 2002-032.8%2.1%0.7% 2003-040.0%3.3%-3.3% 2004-050.0%2.1%(est)-2.1% Total22.1%32.8%-10.7%
 CPIDifference %3.0%-3.0% %2.5%-2.5% %3.0%-3.0% %2.8%-1.0% %2.3%-2.3% %1.7%0.7% %2.0%0.5% %3.7%1.4% %3.2%1.3% %1.1%1.8% %2.1%0.7% %3.3%-3.3% %2.1%(est)-2.1% Total22.1%32.8%-10.7%")
16
Education Related Cost Increases Between 1992 and 2004 College Tuition and Fees107% Private Catholic School Tuition (elementary) 89% Education Books and Supplies 84% Childcare and Nursery School 73% Total General Education Revenues 44% Basic Formula (excluding roll-ins) 22% Source: AMSD analysis of Bureau of Labor Statistics data and The National Catholic Education Association
 89% Education Books and Supplies 84% Childcare and Nursery School 73% Total General Education Revenues 44% Basic Formula (excluding roll-ins) 22% Source: AMSD analysis of Bureau of Labor Statistics data and The National Catholic Education Association")
17
Average MN teacher salaries have not kept pace with salaries in other sectors (1992-2002) Increase in Minnesota per capita personal income61% Increase in average private sector wage in MN 51% Increase in average government worker wage in MN 34% Increase in average MN teacher salary28% Sources: The Bureau of Economic Analysis, MN Department of Employment and Economic Development and the National Education Association
 Increase in Minnesota per capita personal income61% Increase in average private sector wage in MN 51% Increase in average government worker wage in MN 34% Increase in average MN teacher salary28% Sources: The Bureau of Economic Analysis, MN Department of Employment and Economic Development and the National Education Association")
18
Minnesota’s rank in education spending relative to income plunged over the past decade Source: U.S Census Bureau: Public Education Finances Report

19
Invest in Educational Excellence Recommendation #2 Fully fund the special education formula or allow school boards to levy for the difference between revenue expected under the state formula and amount of funding actually received.

20
Special Education Cross Subsidy approaches $120 million for AMSD Districts The Special Education Cross Subsidy is the amount of general education revenue a district must spend on special education due to insufficient funding of state and federal mandates. The total Cross Subsidy for AMSD districts is $119 million. (See Handout #2 for detail by district)
.")
21
Special Education Appropriation Falls Short Currently, there is an insufficient appropriation of funds to cover the regular special education formula. For AMSD districts, the gap between the formula and the appropriation is nearly $30 million. (See Handout #3 for detail by district)
.")
22
Invest in Educational Excellence Recommendation #3 Amend the basic formula to address market driven, operating cost differentials

23
OCCUPATION CATEGORY TWIN CITIES DULUTHFARGOROCHESTER ST. CLOUD Business & Financial $25.03$21.19$20.67$23.28$20.58 Construction$24.32$20.27$15.50$19.29$19.18 Management$41.46$30.08$29.15$38.44$31.11 Office and Administrative $14.59$12.58$11.70$14.47$12.06 Higher wages make it more expensive to conduct business in the Twin Cities Note: Highest wage in each category is highlighted Source: AMSD analysis of Department of Economic and Economic Development (DEED) Data Mean Hourly Wages for Different Occupation Groups by Geographic Location
 Data Mean Hourly Wages for Different Occupation Groups by Geographic Location.")
24
Teacher salaries in the metro area are higher than in other regions of the state

25
Higher housing costs in the Twin Cities affect the cost of labor

26
A greater portion of teachers’ salaries are required to pay for housing in the metro area

27
Like housing costs, rent is higher in the metro area

28
GM = Greater MinnesotaAMCPU = Adjusted Marginal Cost Pupil Unit Source: AMSD Analysis of Department of Education 2004 What If Report 2005 General Education Revenue per AMCPU

29
Without Basic Education Aid GM = Greater MinnesotaAMCPU = Adjusted Marginal Cost Pupil Unit Source: AMSD Analysis of Department of Education 2004 What If Report

30
Metro School Districts Receive a Lower Level of Referendum Aid

31
TOTAL REVENUERANK FOR TOTAL REVENUE BLOOMINGTON$5,829.13117 BROOKLYN CENTER$6,288.9653 BURNSVILLE$5,854.58124 CHASKA$5,716.60164 EDEN PRAIRIE$5,688.13179 EDINA$6,026.8992 FRIDLEY$5,888.03118 HOPKINS$6,219.5561 INVER GROVE HEIGHTS$5,852.14125 MAHTOMEDI$5,434.76247 MINNEAPOLIS$7,264.8918 MINNETONKA$6,172.0566 MOUNDS VIEW$5,869.74121 NORTH ST. PAUL/ MAPLEWOOD$5,894.59116 ORONO$5,581.65203 RICHFIELD$6,198.8863 ROBBINSDALE$6,035.2488 ROSEVILLE$6,143.8071 SHAKOPEE$5,726.82159 SOUTH ST. PAUL$5,851.90126 SPRING LAKE PARK$5,970.16102 ST. ANTHONY/ NEW BRIGHTON$5,636.83194 ST. LOUIS PARK$6,434.3143 ST. PAUL$6,869.0826 WAYZATA$5,690.06178 WEST ST.PAUL / MENDOTA / EAGAN$5,899.98114 FY 2005 GENERAL ED FUNDING FOR AMSD DISTRICTS PER AMCPU

32
TOTAL AIDRANK FOR TOTAL AID BLOOMINGTON$4,903.35322 BROOKLYN CENTER$5,826.6167 BURNSVILLE$5,014.50289 CHASKA$5,013.55290 EDEN PRAIRIE$4,754.04336 EDINA$4,723.37341 FRIDLEY$5,166.26245 HOPKINS$4,830.60335 INVER GROVE HEIGHTS$4,978.50300 MAHTOMEDI$4,859.88330 MINNEAPOLIS$6,586.5721 MINNETONKA$4,719.61342 MOUNDS VIEW$4,907.82320 NORTH ST. PAUL/ MAPLEWOOD$5,053.03281 ORONO$4,724.15340 RICHFIELD$5,250.89207 ROBBINSDALE$5,159.38250 ROSEVILLE$4,856.28331 SHAKOPEE$5,168.31243 SOUTH ST. PAUL$5,142.03258 SPRING LAKE PARK$5,098.21272 ST. ANTHONY/ NEW BRIGHTON$4,738.65337 ST. LOUIS PARK$4,898.47325 ST. PAUL$6,527.7925 WAYZATA$4,737.50338 WEST ST.PAUL / MENDOTA / EAGAN$4,888.70328 FY 2005 GENERAL ED FUNDING FOR AMSD DISTRICTS PER AMCPU

33
Eliminate the Readiness Gap

34
The number of LEP students has doubled in the past 6 years

35
The number of special education students has grown by 11% since 1998

36
Between 1998 and 2004, the number of low income students increased by almost 7%

37
Eliminate the Readiness Gap Recommendation #1 Ensure 3-4 year olds have access to quality early childhood education using: State Funding Local Levy Authority

38
Early Childhood Education Produces a High Return on Investment Art Rolnick’s study of the Perry Preschool Project: Estimated Annual Rate of Return = 16%

39
Early childhood education produces economic benefits for the participant and for society Rolnick’s estimate of Perry Project Costs and Benefits Over 27 Years

40
Rolnick’s study of the Perry Project: Economic effects at age 27

41
Eliminate the Readiness Gap Recommendation #2 Ensure that at-risk children have access to full- day kindergarten as a first step toward implementing universal, full-day kindergarten or grant levy authority to school boards.

42
Benefits of Full-Day Kindergarten Improved Academic Achievement – Improved standardized test scores – Greater progress in literacy, math, general learning skills, and social skills – Higher rating for first grade readiness – Reduction in the achievement gap

43
Benefits of Full-Day Kindergarten Better social and emotional development – Greater opportunity for individual attention and instruction – More emphasis on child initiated over teacher-led activities – More opportunities for social interactions

44
Benefits of Full-Day Kindergarten: Minneapolis A 2002 study in Minneapolis showed full-day kindergarten narrows the gap in early literacy, especially for minority groups. Students in full-day classes had a higher gain in number of letter sounds, rhyming words, picture vocabulary, letter identification and sight words than students in half-day.

45
Letter Sound Gains from Fall to Spring for Half Day vs. Full-Day Kindergarten Source: MPS Research, Evaluation & Assessment – October 2002.

46
District 191 Full-Day Kindergarten Study A 2004 U of M study found that full-day kindergarten students in District 191 had higher scores than their half-day counterparts in all three measures monitored. The three measures used were: recognition of upper case letters, recognition of lower case letters, and counting to 100. Source: Center for Applied Research and Educational Improvement, District 191 Full-Day Kindergarten Program: Evaluation of Year One- 2003-04, University of Minnesota, 2004.

47
Minnesota Full-Day Kindergarten Enrollment Lags Behind the National Average Sources: MDE “Public School Kindergarten Enrollment for 2003-04” February 2004 and the U.S. Census Bureau 2001.

48
Provide local control

49
Rationale for Providing Local Control Locally elected school boards are in the best position to respond to the unique needs of their communities. A one-size fits all approach to education does not work. Local control is a bedrock principle of our democratic system. Decentralization improves responsiveness to local concerns, stimulates innovation and participation, and increases the accountability of locally elected officials.

50
“Schools cannot do this Alone” By Jamie Vollmer Vollmer outlines the numerous responsibilities that have been added to public schools since 1900. (See Handout #5) He notes that in almost 5 decades, although mandates have increased, most states have not added a single minute to the school day.
 He notes that in almost 5 decades, although mandates have increased, most states have not added a single minute to the school day..")
51
Provide Local Control Allow School Boards to Levy for: Transportation Deferred Maintenance Technology

52
Deferred Maintenance In 1999, the Department of Education estimated unmet facility needs for school districts would reach $4.6 billion over the decade. Of the $4.6 billion in unmet facility needs, nearly one third of the cost ($1.5 billion) was attributable to deferred maintenance. Source: Recommendations of the K-12 Facilities and Infrastructure Task Force: A Report to the Senate K-12 Education Budget Division on Suggested Statutory Changes to Improve School Facility Financing in the State of Minnesota, January 20, 1999
 was attributable to deferred maintenance. Source: Recommendations of the K-12 Facilities and Infrastructure Task Force: A Report to the Senate K-12 Education Budget Division on Suggested Statutory Changes to Improve School Facility Financing in the State of Minnesota, January 20,")
53
Eliminate or raise the cap on local operating levies Nearly one-fourth of districts (81 out of 343) are already exempt from the cap because they receive sparsity aid. Of the eight districts receiving the most referendum revenue, none are from the metro area. Of the 23 districts above the cap, only 7 are from the metro area.

54
Improve Teaching and Assessment

55
Improve Assessment Tools Expedite implementation of a statewide value- added assessment system to more accurately measure student progress. Align state assessments with state standards. Improve statewide accountability reports so they provide a more complete and accurate picture of schools and to reflect individual student growth. Use limited resources more efficiently

56
Modernize the compensation system and collective bargaining process Enhance and modernize the teacher compensation system to attract and retain the best and the brightest into the teaching profession. Repeal the January 15 th deadline for settling teacher contracts and the corresponding $25 per pupil penalty. Improve the collective bargaining process by implementing total package, final offer, binding arbitration if requested by either party. Use limited resources more efficiently

57
Summary Stabilize education funding Invest in educational excellence Eliminate the readiness gap Provide local control Improve teaching and assessment

58
For more information Contact AMSD @ (651) 999-7325 Or check out our website at www.amsd.org
 Or check out our website at")
Similar presentations


 5 th highest personal income (1) 27 th largest GNP in the World (ahead of Sweden, Belgium,>")


 5 th highest personal income (1) 12 th highest personal income per student (1) 48 th in combined.>")


