Download presentation
Presentation is loading. Please wait.

1
Jonathan Rubens, November 18, 2009

2
VC fundraising to lowest point in 16 years in the third quarter. 17 funds raised $1.6 billion Q3 2009; smallest number of funds raising money since Q3 1994, and smallest amount raised since 1Q 2003 ($938 million). Largest funds raised Q3 2009: Khosla Ventures III, $750 million (for an early stage fund); Draper Fisher Jurvetson X, $196 million. (Source: NVCA/Thomson Reuters)
. Largest funds raised Q3 2009: Khosla Ventures III, $750 million (for an early stage fund); Draper Fisher Jurvetson X, $196 million. (Source: NVCA/Thomson Reuters).")
3
YearSilicon Valley TotalNational Total 1999$ 17,289,188,300$ 51,474,502,000 2000$ 32,409,005,700$ 100,662, 20,100 2001$ 12,161,613,900$ 38,692,099,700 2002$ 6,871,319,600$ 21,045,474,900 2003$ 6,429,811,000$ 19,164,811,200

4
Silicon Valley TotalNational Total 2004$ 7,826,760,000$ 21,998,609,800 2005$ 8,177,639,900$ 22,944,951,900 2006$ 9,565,899,800$ 26,438,886,800 2007$10,859,086,400$ 30,538,555,300 2008$10,782,144,100$ 27,958,705,800 2009 (through Q3 only) $ 4,916,818,100$ 12,246,954,800
 $ 4,916,818,100$ 12,246,954,800")
5
RegionQ1 2009Q2 2009Q3 20092009 Q1 – Q3 Silicon Valley $1,310,784,800$1,372,075,400$2,234,007,900$4,916,686,100 LA / OC$ 223,917,200$ 179,578,100$ 39,182,000$ 642,677,300 San Diego $ 91,974,300$ 251,879,000$ 63,328,500$ 580,181,800 Sac’o/ NoCal $ 7,000,000$ 9,865,000$ 1,950,000$ 18,815,000 CA - total $1,633,676,300$1,813,397,500$2,711,468,400$6,158,542,200

6
200420052006200720082009 Seed investments as a percent of total investment 2.1%4.0%4.6%4.7%5.6%10.7%

7
Q1 + Q2 2009, five IPOs raised $967 million. Q3 2009 20 IPOs raised $5.8 billion 10 VC-backed IPOs Jan 1 -Oct. 20, 2009. (Source: NVCA)
.")
8
I-Bank concentration: fewer boutique banks and fewer companies willing to use them Longer time to IPO: 2008 median company age of 9.6 years vs. 4.5 years 1998 90’s: 80% of IPOs smaller than $50M; 2000s: 20% of IPOs smaller than $50M;

9
2008 vs. 2007: Angel $ down 26% to $19.2 B; VC total investment down 8% to $30.9 B Q1-Q2 09 vs. 08: 27% less $, slightly more deals vs same time last year, down overall. 19% less money invested at the earliest stages: 27% seed/startup, 58% post-seed. More follow-on investing? Less risk-tolerant angels? More institutionalized angel investing? (UNH – CVR)
.")
10
Kereitsu Forum – invests after $500K to $1.5 million seed round, often in a Series A alongside another institutional investor Band of Angels – recently more follow-on than seed investing; often “lead a syndication of $2-3 million”

11
Angels Forum: “focus is seed and early stage companies seeking $100K to $1 million” Sand Hill Angels: “as little as $100K to more than $500K”

12
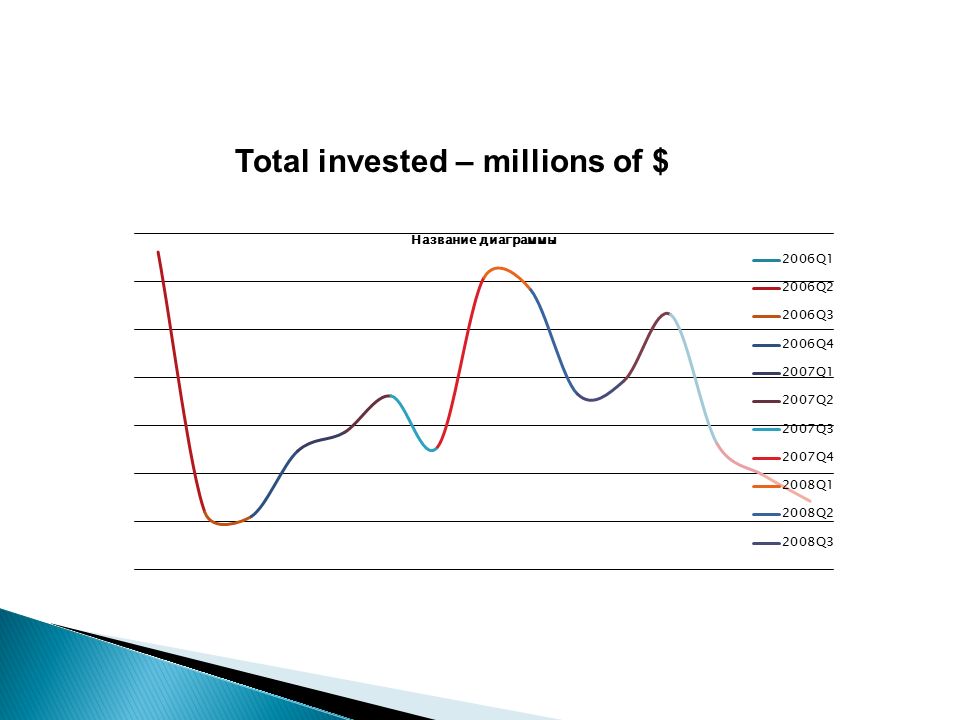
Round/year/qtrEarlyABC+ 2006Q166.2145392.65299.4548.1025 2006Q212.09358.435281.195.7425 2006Q311.1328.3473.5142.35 2006Q424.7715371.1204672.83975.232 2007Q128.623523.19637.93356.7787 2007Q236.23679.87896.543313.256 2007Q325.5785867.431109.53348.5919 2007Q460.9111300.7921104.09338.0163 2008Q158.333381740.4521859.57449.2514 2008Q236.6541337.1361934.263863.8289 2008Q339.34981064.3241690.9803.7373 2008Q453.195731003.2061164.98631.2143 2009Q126.2795488.299904.057574.9434 2009Q219.7085866.81011.31656.7903 2009Q314.295434.175903.965673.0571 Total invested – millions of $ Source: CrunchBase

13
Total invested – millions of $

15
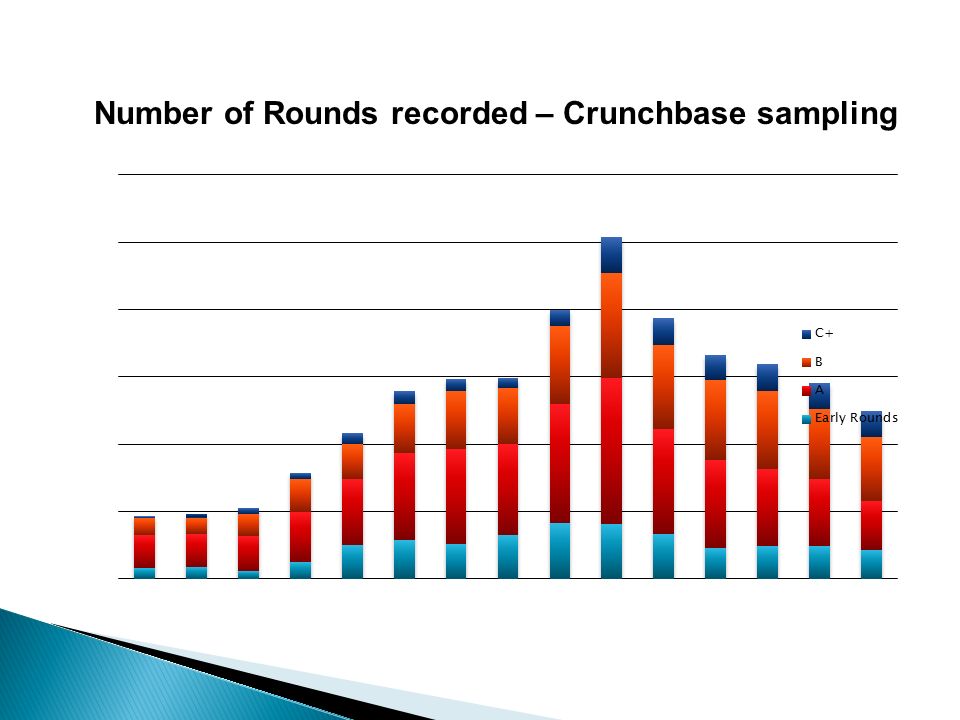
Round/year/qtrEarly RoundsABC+ 2006Q11649253.25 2006Q21848255.5 2006Q311.552338.333333 2006Q42575497.8 2007Q151985216 2007Q2581297318.2 2007Q3521418617 2007Q465.51358314 2008Q182.517711623.28571 2008Q281.521715553.66667 2008Q36615612540.66667 2008Q445.513111936.57143 2009Q148.5115 40.14286 2009Q24910010339 2009Q343739439 Number of Rounds recorded – Crunchbase sampling

17
Round / year / qtrEarlyABC+ 2006Q124.54062518.7156253.00640625 2006Q20.75562522.402187517.568755.98390625 2006Q30.6937520.5187529.593758.896875 2006Q41.5482187523.19502542.05187560.952 2007Q11.788937532.69937539.87062522.2986688 2007Q22.26437542.49187556.033937519.5785 2007Q31.5986562554.21437569.34562521.7869938 2007Q43.806937581.299569.00562521.1260188 2008Q13.64583625108.77825116.22312528.0782125 2008Q22.29087583.571120.89143853.9893063 2008Q32.459362566.52025105.6812550.2335813 2008Q43.3247331362.70037572.8112539.4508938 2009Q11.6424687530.518687556.503562535.9339625 2009Q21.2317812554.17563.20687541.0493938 2009Q30.893437527.135937556.497812542.0660688 Average Round Size millions $

18
Average Round Size millions $

19
Average Round Size Millions $

20
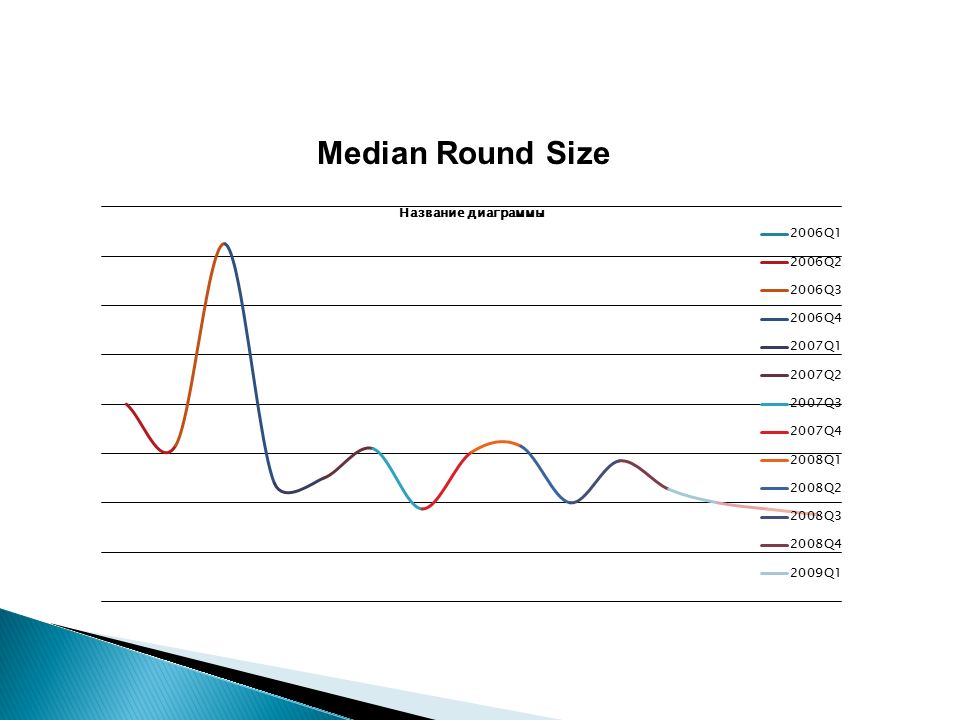
Round/year/qtrEarlyABC+ 2006Q10.461112.55125 2006Q20.3162558.78.79375 2006Q30.7254.2510.511.625 2006Q40.24410.59.8 2007Q10.2531012.914 2007Q20.314910.93 2007Q30.18753.51010.79167 2007Q40.30253.31018.21429 2008Q10.3153.71011.04286 2008Q20.23812.45833 2008Q30.2854.51012.53542 2008Q40.22753.56.59.463929 2009Q10.2377.7625 2009Q20.187536.99.176429 2009Q30.176252.56.69.592857 Median Round Size

24
Combination of incubator services, mentoring, microinvestments, for 2-8% Seed investment plus RFR A round by affiliate later- stage fund Examples:YCombinator, TechStarts, SeedCamp, LaunchBox, DreamIt Ventures, Highland Capital Partners, Bay Partners

25
UNH study: 13.4 of IPOs had angels as only investors Companies with angel-only financing reached IPO sooner than purely VC-backed companies IPOs with angel-only backing may tend to generate higher proceeds than VC-only IPOs UMD: angel-only or VC-only companies were less likely to fail and more likely to have a successful liquidity event; companies that were backed by both angels & VC funds had inferior outcomes

Similar presentations


 368-5545 www.woodsidefund.com W O O D S I D E F U N D “Challenges and Funding of Seed and Early Stage.>")

