Download presentation
Presentation is loading. Please wait.

1
Acceleration of the sea surface fCO2 growth rate in the North Atlantic Subpolar Gyre (1993-2008). N. Metzl, A Corbière, G. Reverdin, A.Lenton, T. Takahashi, A. Olsen, T. Johannessen, D. Pierrot, R. Wanninkhof, S. R. Ólafsdóttir, J. Olafsson and M. Ramonet CARBOOCEAN Final meeting, Bergen, 5-10/10/09

2
xCO2 from GlobalView 2009 Observing the decadal CO2 change in the ocean ? …. Acceleration of the Atm. CO2 growth rate since 90s

3
Global net flux: 2 (+/-1) PgC/yr Important improvement, but climatology is for a virtual (e.g. non ENSO) and fixed year (here 2000) What are the temporal variations of the ocean carbon sink ? Air-Sea CO2 flux climatology (Takahashi et al, 2009)
 and fixed year (here 2000) What are the temporal variations of the ocean carbon sink . Air-Sea CO2 flux climatology (Takahashi et al, 2009).")
4
Moving from the climatology to trends One global synthesis based on observations (CO2 fluxes) (adapted from Le Quéré et al., in rev, 2009) ?? Sink decreases Sink increases Different regions….different trends

5
Moving from the climatology to trends (1) A zoom in the North Atlantic (…Go game) (adapted from Le Quéré et al., in rev 2009) Sink decreases Sink increases ???? Different regions….different trends

6
Schuster et al. DSR SOCOVV,2009 Moving from the climatology to trends (2) Another view in the North Atlantic (1990-2006)
 Another view in the North Atlantic ( ).")
7
Schuster et al. DSR SOCOVV,2009 Annual trend in pCO 2 (μatm/yr) between 1990 and 2006 The North Atlantic carbon sink decreases almost everywhere Clear signal in the subpolar gyre Atmospheric growth rate pCO2 trend subpoplar gyre Different regions….different trends
 between 1990 and 2006 The North Atlantic carbon sink decreases almost everywhere Clear signal in the subpolar gyre Atmospheric growth rate pCO2 trend subpoplar gyre Different regions….different trends.")
8
Schuster et al. DSR SOCOVV,2009 Main driver of oceanic fCO2 increase in 1990-2006: Warming in the North Atlantic Subpolar Gyre Sea Surface Temperature trends in 1990-2006 Different regions….different processes

9
Another view of North Atlantic CO2 fluxes ???….??? CLIM Schuster et al. DSR,2009 Different models….different trends

10
Ocean CO2 trends in the North Atlantic Is the ocean CO2 sink still decreases in recent years (after 2006) ? Is warming/cooling always explains these changes ? Schuster et al. DSR 2009 ??????

11
Acceleration of the sea surface fCO2 growth rate in the North Atlantic Subpolar Gyre (1993-2008). N. Metzl, A Corbière, G. Reverdin, A.Lenton, T. Takahashi, A. Olsen, T. Johannessen, D. Pierrot, R. Wanninkhof, S. R. Ólafsdóttir, J. Olafsson and M. Ramonet CARBOOCEAN Final meeting, Bergen, 5-10/10/09

12
Another view of the sea surface fCO2 changes Decadal variations in the North Atlantic Subpolar Gyre 1993-2008

13
Original data, T,S DIC, TA used to calculate fCO2 Trends in winter

14
Winter Trends in the North Atlantic Subpolar Gyre Different periods ….different trends

15
For recent years: comparing fCO2cal and fCO2mes fCO2 cal: 5-7 µatm/yr fCO2mes: 5-6 µatm/yr Wanninkhof et al.Olsen et al.

16
Winter Trends in the North Atlantic Subpolar Gyre NO NAO link ? Drivers before and after 2003?

17
Drivers ? …. Back to original data, T,S DIC, TA + - = +- ++ + + + += = =--

18
Drivers of the oceanic f CO 2 trend d fCO2/ dt =( fCO2 / SST)(d SST/dt) + ( fCO2 / SSS)(d SSS/ dt) + ( fCO2/ DIC)(d DIC / d t) + ( fCO2/ TA)(d TA / d t) Different periods….different trends … different processes
(d SST/dt) + ( fCO2 / SSS)(d SSS/ dt) + ( fCO2/ DIC)(d DIC / d t) + ( fCO2/ TA)(d TA / d t) Different periods….different trends … different processes")
19
Ratio DIC/TA: surface temporal changes and water column distribution North/South contrast Proposed scenario: rapid fCO2 increase in recent years linked to vertical mixing/convection (ARGO -Vage et al, 2008)
")
20
Back to the first slide Acceleration of the Atm. CO2 growth rate xCO2 from GlobalView 2009 Observing the decadal CO2 change in the ocean ?

21
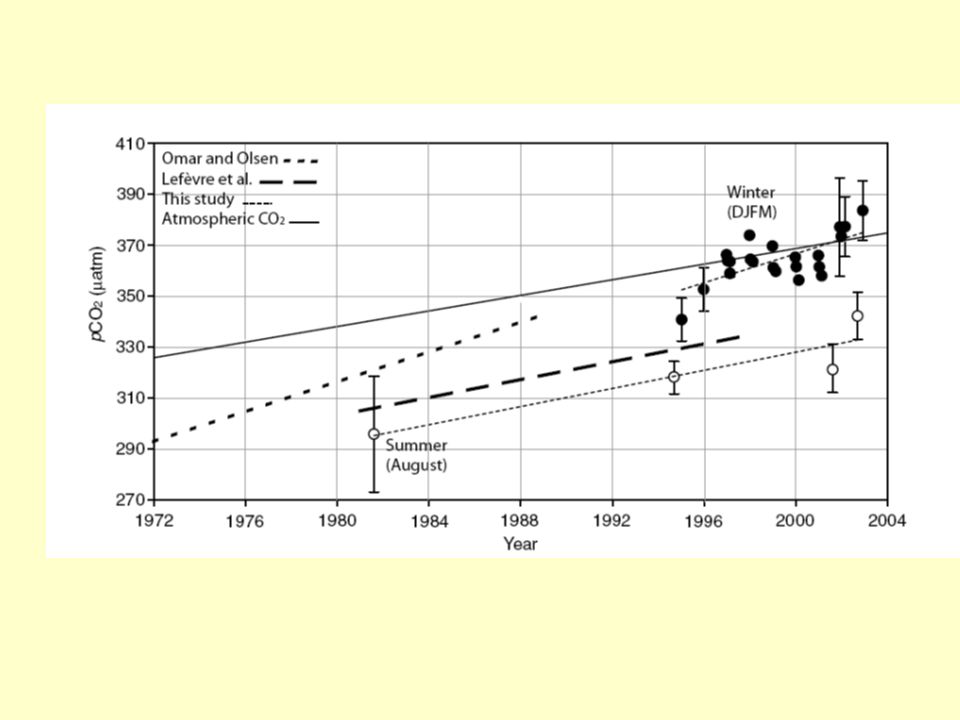
Ocean versus atmospheric CO2 increase North Atlantic Subpolar Gyre Ocean CO2 growth rate is faster than atmosphere The ocean sink decreases

22
Evolution of oceanic and atmospheric CO 2 in the North Atlantic Take home messages (1 fCO2 trends and processes) +3 µatm/yr +6 µatm/yr Warming Convection Corbière et al. (2007), Metzl et al., (2009) NO NAO
, Metzl et al., (2009) NO NAO.")
23
Evolution of oceanic CO 2 in the North Atlantic Take home message 2 (fCO2 and pH changes) Metzl, Unpublished
 Metzl, Unpublished")
24
Observed decadal changes of sea surface fCO2 (and fluxes) Different regions………….. Different trends Different inversions……….Different trends Different periods………….. Different trends Different periods………….. Different processes Next: Investigate different data-set (LDEO – SOCAT) Investigate different ocean and coupled models …………………..work in (different ) progress
 Investigate different ocean and coupled models …………………..work in (different ) progress.")
25
SOCAT Under QC >7 Mdata Takahashi et al DSR 2009 > 3 Mdata (r) Evolutions of surface ocean CO 2 After SOCOVV meeting, 2 data-bases !!!!
 Evolutions of surface ocean CO 2 After SOCOVV meeting, 2 data-bases !!!!")
26
Heat fluxes anomalies in winter (1999-2008) Vage et al. 2008
 Vage et al. 2008")
27
Maximum winter mixed-layer in 2008 Vage et al. 2008

28
Temporal variations of Air-Sea CO2 fluxes recent past, present and future Coupled Climate Carbon Cycle Models (source, T.Roy LSCE/IPSL) 5yr 40 yr
 5yr 40 yr")
29
CCCC Models (source, T.Roy LSCE/IPSL) Need to validate the temporal trends
 Need to validate the temporal trends")
30
Air-Sea CO2 flux based on atmospheric CO2 data Nm 8/3/09

31
8/3/09 Global Ocean Air-sea CO2 flux ?????

33
Schuster et al. DSR SOCOVV,2009 Annual trend in pCO 2 (μatm/yr) between 1990 and 2006 The North Atlantic carbon sink decreases almost everywhere Clear signal in the subpolar gyre Atmospheric growth rate pCO2 trend subpoplar gyre
 between 1990 and 2006 The North Atlantic carbon sink decreases almost everywhere Clear signal in the subpolar gyre Atmospheric growth rate pCO2 trend subpoplar gyre.")
Similar presentations
 Achievements and challenges Nicolas Gruber Environmental Physics, ETH Zürich, Zurich, Switzerland. Using input from.>")

 Workshop.>")


, L. Merlivat (1) and K.>")
 Rowan Sutton (Uni. Reading) and Doug Smith (UK Met Office) Analysis of a decadal prediction system:>")


 ASCENDS Science Working Group Meeting (February 2012; NASA Goddard Space Flight Center)>")
 Understanding Sea-level Rise and Variability 6-9 June, 2006 Paris,>")