Download presentation
Presentation is loading. Please wait.

1
Federal Funding The Process The New Directions Terry A. Ring

2
The Argument for Science Good for the Workforce –Higher Pay Good for Quality of Life Good for the Economy

3
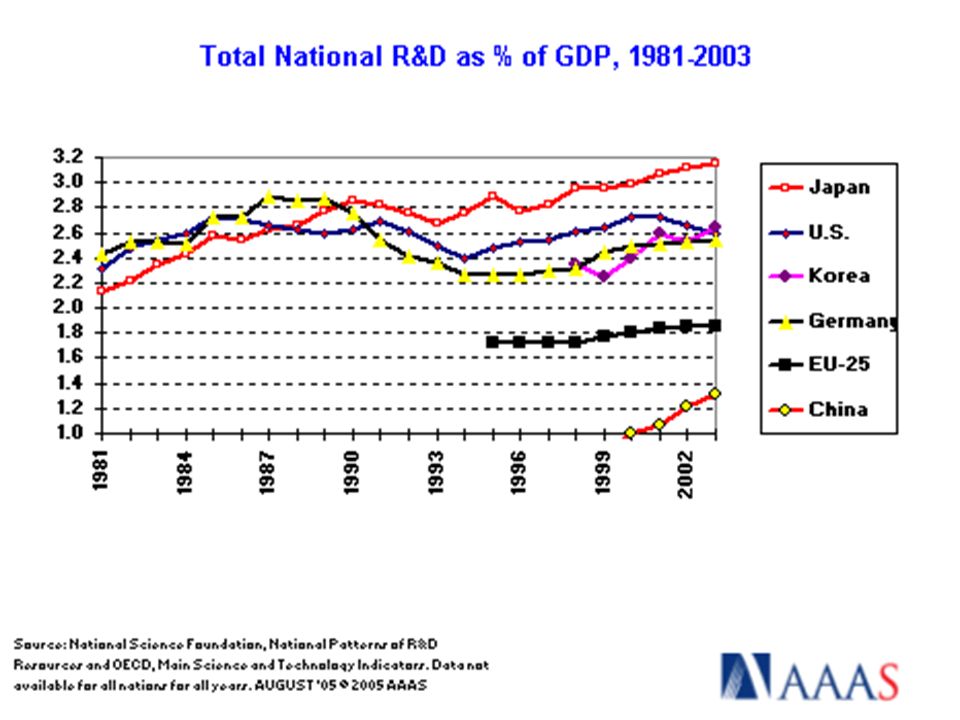
Economic Growth

5
US R&D Funding Reasons for Concern –Corporate Migration Clothing Manufacturing Research Labs –Balance of Payments –International Competitiveness Funding New Businesses –Venture Capital »Startup $ drying up after the dot com bubble burst Government Regulation –EPA –Homeland security Energy Costs

10
SOME WORRISOME INDICATORS When asked in spring 2005 what is the most attractive place in the world in which to “lead a good life”1, respondents in only one of the 16 countries polled (India) indicated the United States. For the cost of one chemist or one engineer in the United States, a company can hire about five chemists in China or 11 engineers in India.2 For the first time, the most capable high-energy particle accelerator on Earth will, beginning in 2007, reside outside the United States.3 The United States is today a net importer of high-technology products. Its share of global hightechnology exports has fallen in the last 2 decades from 30% to 17%, and its trade balance in hightechnology manufactured goods shifted from plus $33 billion in 1990 to a negative $24 billion in 2004.4 Chemical companies closed 70 facilities in the United States in 2004 and have tagged 40 more for shutdown. Of 120 chemical plants being built around the world with price tags of $1 billion or more, one is in the United States and 50 in China.

11
SOME WORRISOME INDICATORS Fewer than one-third of US 4th grade and 8th grade students performed at or above a level called “proficient” in mathematics; “proficiency” was considered the ability to exhibit competence with challenging subject matter. Alarmingly, about one-third of the 4th graders and one-fifth of the 8 th graders lacked the competence to perform basic mathematical computations.6 US 12th graders recently performed below the international average for 21 countries on a test of general knowledge in mathematics and science. In addition, an advanced mathematics assessment was administered to US students who were taking or had taken precalculus, calculus, or Advanced Placement calculus and to students in 15 other countries who were taking or had taken advanced mathematics courses. Eleven nations outperformed the United States, and four countries had scores similar to the US scores. No nation scored significantly below the United States

12
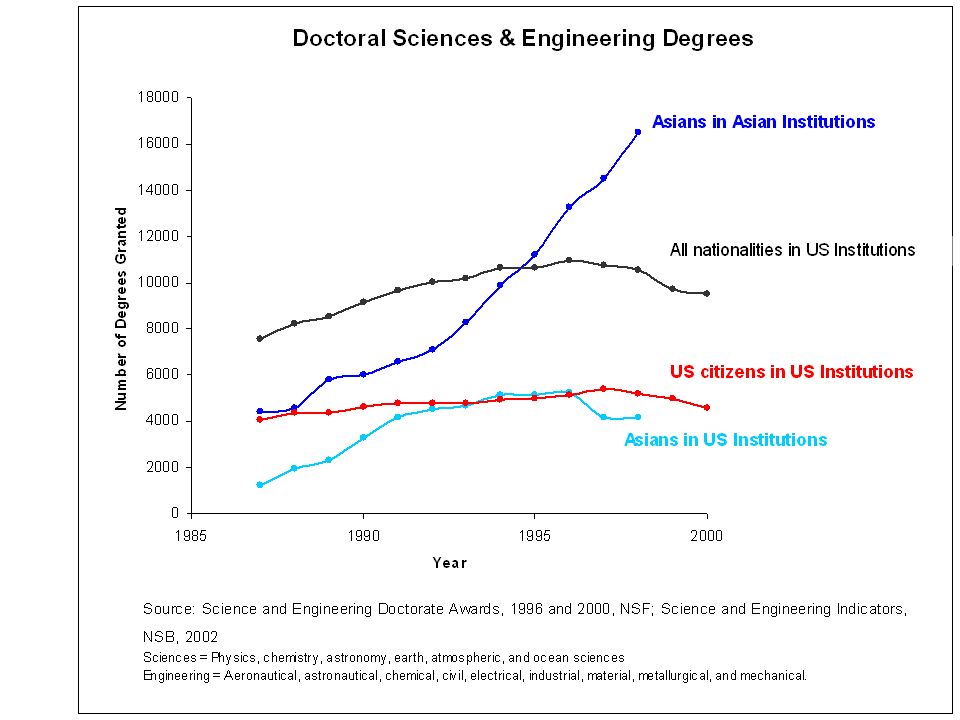
SOME WORRISOME INDICATORS In 1999, only 41% of US 8th grade students received instruction from a mathematics teacher who specialized in mathematics, considerably lower than the international average of 71%. In one recent period, low-wage employers, such as Wal-Mart (now the nation’s largest employer) and McDonald’s, created 44% of the new jobs, while high-wage employers created only 29% of the new jobs. In 2003, only three American companies ranked among the top 10 recipients of patents granted by theUnited States Patent and Trademark Office. In Germany, 36% of undergraduates receive their degrees in science and engineering. In China, the figure is 59%, and in Japan 66%. In the United States, the corresponding figure is 32%. The United States is said to have 10.5 million illegal immigrants, but under the law the number of visas set aside for “highly qualified foreign workers” dropped to 65, 000 a year from its 195,000 peak. In 2004, China graduated over 600,000 engineers, India 350,000, and America about 70,000. In 2001 (the most recent year for which data are available), US industry spent more on tort litigation than on R&D.
 and McDonald’s, created 44% of the new jobs, while high-wage employers created only 29% of the new jobs. In 2003, only three American companies ranked among the top 10 recipients of patents granted by theUnited States Patent and Trademark Office. In Germany, 36% of undergraduates receive their degrees in science and engineering. In China, the figure is 59%, and in Japan 66%. In the United States, the corresponding figure is 32%. The United States is said to have 10.5 million illegal immigrants, but under the law the number of visas set aside for highly qualified foreign workers dropped to 65, 000 a year from its 195,000 peak. In 2004, China graduated over 600,000 engineers, India 350,000, and America about 70,000. In 2001 (the most recent year for which data are available), US industry spent more on tort litigation than on R&D..")
13
The Issue

14
Organizations Doing Things About This AAAS ACS APS MRS AIChE CCR

15
Types of Bills in Congress Authorization Bills – establish programs and polities –Can also set recommended budget levels E.G. NIH Doubling Bill (Contract with America), NSF Doubling Bill Appropriation Bills – Actual Funding
, NSF Doubling Bill Appropriation Bills – Actual Funding.")
16
Process for FY-X June – Memo to Agency Heads from Administration –From OMB and OSTP –Outlines Administration Directions for the future of Science and Technology Funding July to Dec - Agency Discussions with OMB February – Presidents Budget sent to Congress March to June – Congressional Committee Hearings –Statement of Administration Policy –House & Senate Guidelines decided by Leadership July to October 1 – Appropriations Bills (12) passed by House and Senate, –Conference committee to iron out differences Signed into Law by President If not passed by Oct. 1 –Continuing Resolution(s) Continue to spend at last year’s level –Limited Funding Actions and No New Starts Wait for new funding until Appropriation Bill is signed by President –Agency shuts down
 Continue to spend at last year’s level –Limited Funding Actions and No New Starts Wait for new funding until Appropriation Bill is signed by President –Agency shuts down.")
17
Process for FY-X June – Memo to Agency Heads from Administration –From OMB and OSTP –Outlines Administration Directions for the future of Science and Technology Funding July to Dec - Agency Discussions with OMB February – Presidents Budget sent to Congress March to June – Congressional Committee Hearings –Statement of Administration Policy –House & Senate Guidelines decided by Leadership July to October 1 – Appropriations Bills (12) passed by House and Senate, –Conference committee to iron out differences Signed into Law by President If not passed by Oct. 1 –Continuing Resolution(s) Continue to spend at last year’s level –Limited Funding Actions and No New Starts Wait for new funding until Appropriation Bill is signed by President –Agency shuts down CCR White Paper Agency Visits CCR White Papers (NSF, DOE, NIH, etc) Congressional Visits Action Alerts Info on Funding Status http://www.aaas.org/spp/rd/ orhttp://www.aaas.org/spp/rd/ http://thomas.loc.gov/home/approp/app06.html
 Continue to spend at last year’s level –Limited Funding Actions and No New Starts Wait for new funding until Appropriation Bill is signed by President –Agency shuts down CCR White Paper Agency Visits CCR White Papers (NSF, DOE, NIH, etc) Congressional Visits Action Alerts Info on Funding Status orhttp://")
18
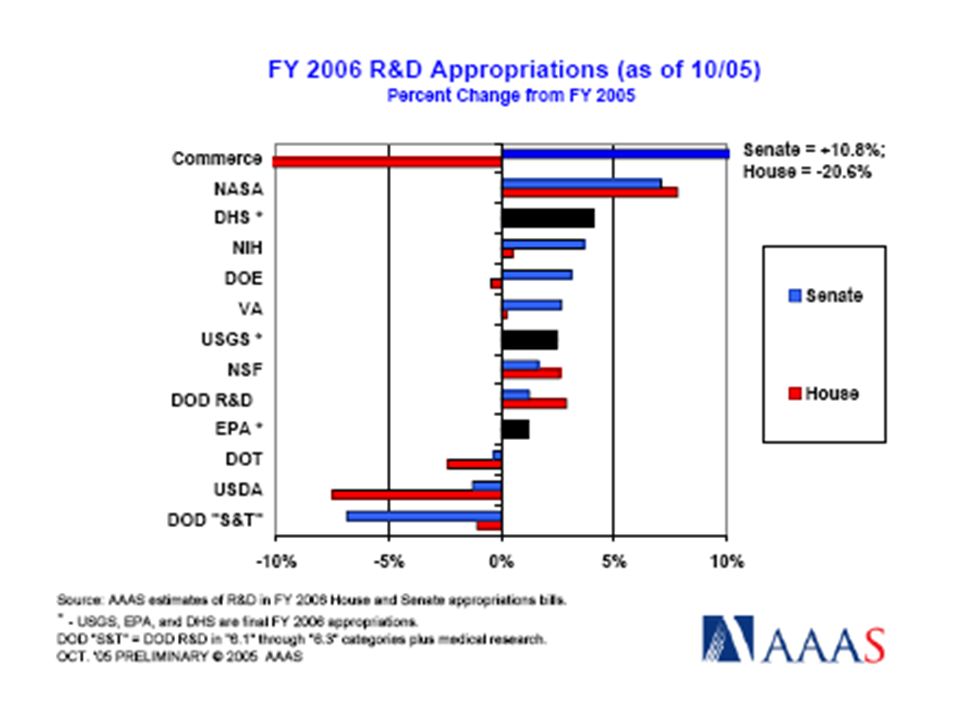
Table 2. Estimated Research by Agency Senate Action on R&D in the FY 2006 Budget (as of September 30, 2005) (budget authority in millions of dollars) Action by Senate FY 2005FY 2006 Chg. from RequestChg. from FY 2005 Est. *RequestSenateAmountPercentAmountPercent Basic Research: Health and Human Services15,11415,23515,7595243.4%6464.3% National Institutes of Health15,11115,23515,7595243.4%6494.3% National Science Foundation3,4163,4643,47490.3%581.7% Department of Defense *1,5131,3191,4451269.6%-69-4.5% Department of Energy2,8242,7122,9061947.1%822.9% Office of Science2,7872,6822,8721907.1%843.0% National Aeronautics & Space Admin.*2,2892,1992,214160.7%-75-3.3% Department of Agriculture8517888748610.9%232.7% Department of the Interior **363034413.9%-3.4% Department of Homeland Security **85112 00.0%2731.8% Smithsonian **115121120-0.4%54.7% Environmental Protection Agency **667067-3-3.9%11.2% Department of Commerce (NIST)617463-11-14.9%23.9% All Other392411406-5-1.1%143.7% ________ Total Est. Basic Research26,76226,53627,4769403.5%7142.7% RESEARCH (basic and applied): Health and Human Services28,70228,96029,7197592.6%1,0173.5% National Institutes of Health27,48727,80528,6228172.9%1,1354.1% National Science Foundation3,6953,7413,751100.3%561.5% Department of Defense *6,8745,6276,7991,17220.8%-75-1.1% Department of Energy5,6365,4035,7433406.3%1071.9% Office of Science2,7872,6822,8721907.1%843.0% National Aeronautics & Space Admin.*4,7045,4305,391-40-0.7%68714.6% Department of Agriculture1,9441,7311,90717710.2%-37-1.9% Department of the Interior **566525563387.3%-3-0.5% Department of Homeland Security **493511 00.0%183.6% Environmental Protection Agency **431455436-19-4.1%51.2% Department of Commerce91281997615719.2%657.1% NOAA53645758112427.1%458.5% NIST368351386359.9%184.8% Department of Transportation457535471-64-11.9%143.1% Department of Veterans Affairs745748766182.4%212.8% Department of Education18617617710.4%-9-5.0% All Other531528553254.7%224.1% ________ TOTAL EST. RESEARCH55,87655,18857,7642,5754.7%1,8883.4% AAAS estimates of basic and applied research in FY 2006 appropriations bills. All figures are rounded to the nearest million. Changes calculated from unrounded figures. * - FY 2005 figures for DOD and NASA have been adjusted since the release of AAAS Report XXX: R&D FY 2006 to reflect DOD FY 2005 emergency supplementals in Public Law 109-13 and the NASA May 2005 FY 2005 Operating Plan. ** - FY 2006 Senate figures are final (House-Senate conference) funding levels. September 30, 2005 - AAAS estimates of Senate appropriations bills. These figures may be amended or rejected by the full Senate.
 (budget authority in millions of dollars) Action by Senate FY 2005FY 2006 Chg. from RequestChg. from FY 2005 Est. *RequestSenateAmountPercentAmountPercent Basic Research: Health and Human Services15,11415,23515, %6464.3% National Institutes of Health15,11115,23515, %6494.3% National Science Foundation3,4163,4643, %581.7% Department of Defense *1,5131,3191, % % Department of Energy2,8242,7122, %822.9% Office of Science2,7872,6822, %843.0% National Aeronautics & Space Admin.*2,2892,1992, % % Department of Agriculture %232.7% Department of the Interior ** %-3.4% Department of Homeland Security ** %2731.8% Smithsonian ** %54.7% Environmental Protection Agency ** %11.2% Department of Commerce (NIST) %23.9% All Other %143.7% ________ Total Est. Basic Research26,76226,53627, %7142.7% RESEARCH (basic and applied): Health and Human Services28,70228,96029, %1,0173.5% National Institutes of Health27,48727,80528, %1,1354.1% National Science Foundation3,6953,7413, %561.5% Department of Defense *6,8745,6276,7991, % % Department of Energy5,6365,4035, %1071.9% Office of Science2,7872,6822, %843.0% National Aeronautics & Space Admin.*4,7045,4305, % % Department of Agriculture1,9441,7311, % % Department of the Interior ** %-3-0.5% Department of Homeland Security ** %183.6% Environmental Protection Agency ** %51.2% Department of Commerce %657.1% NOAA %458.5% NIST %184.8% Department of Transportation %143.1% Department of Veterans Affairs %212.8% Department of Education %-9-5.0% All Other %224.1% ________ TOTAL EST. RESEARCH55,87655,18857,7642,5754.7%1,8883.4% AAAS estimates of basic and applied research in FY 2006 appropriations bills. All figures are rounded to the nearest million. Changes calculated from unrounded figures. * - FY 2005 figures for DOD and NASA have been adjusted since the release of AAAS Report XXX: R&D FY 2006 to reflect DOD FY 2005 emergency supplementals in Public Law and the NASA May 2005 FY 2005 Operating Plan. ** - FY 2006 Senate figures are final (House-Senate conference) funding levels. September 30, AAAS estimates of Senate appropriations bills. These figures may be amended or rejected by the full Senate..")
Similar presentations


 Program AAAS.>")


