Download presentation
Presentation is loading. Please wait.

2
The graph is a hoirzontal line. Velocity is zero.

3
The slope > 0 (positive). The object is moving towards the end position
. The object is moving towards the end position")
4
The slope <0 (negative). The object is moving towards the start position
. The object is moving towards the start position")
5
Speed or velocity is at middle instant of the time interval.

6
Constructing Speed time graph or velocity time graph

8
Construct from a distance-time graph (or a displacement-time graph)
")
9
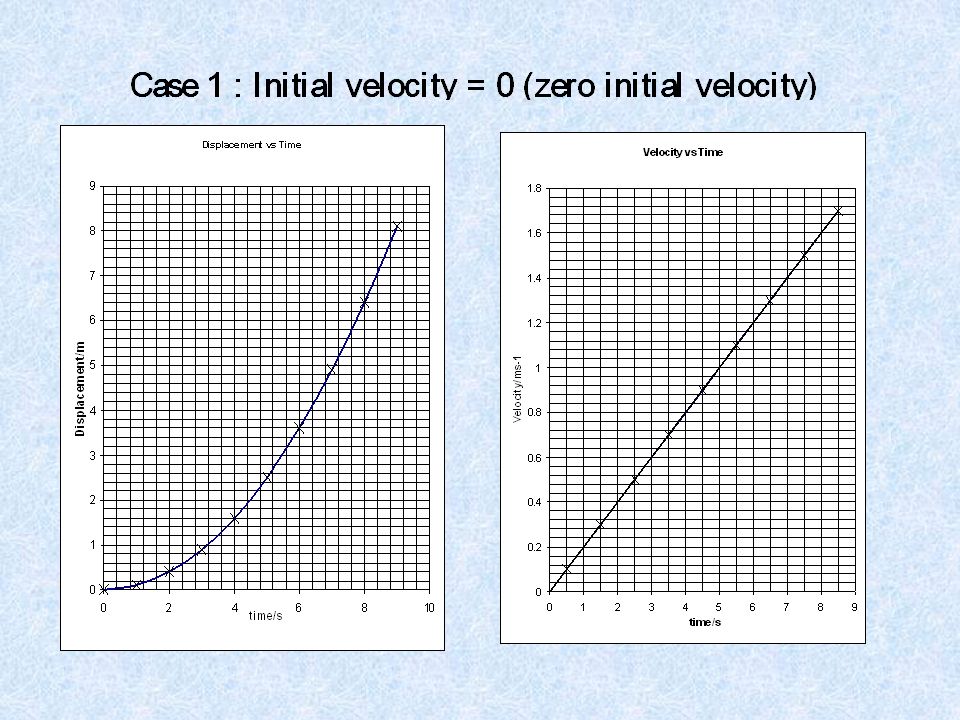
Displacement and v-t graph The following slides show you the relationship between displacement (S) and the v-t graph (velocity-time graph)
 and the v-t graph (velocity-time graph)")
10
Area = 0.6 x (0.2- 0.1) Area = speed x time = distance Graph area under the graph? area under the graph from t = 0.1s to 0.2s is the distance travelled during t=0.1s to 0.2s

11
V1V1 Displacement travelled by the object from time t 1 to t 2 = area A

12
The area under v-t graph V/ms -1 t/s v2v2 v1v1 t2t2 t1t1 Displacement due to v 1 from t 1 to t 2 Displacement due to the increase of velocity from v 1 to v 2 from t 1 to t 2

17
c is the y-intercept, c = 0. Slope m= a. The equation isv =at y = mx

18
‘at’ or ‘v’ t S = area

19
ymxc

20
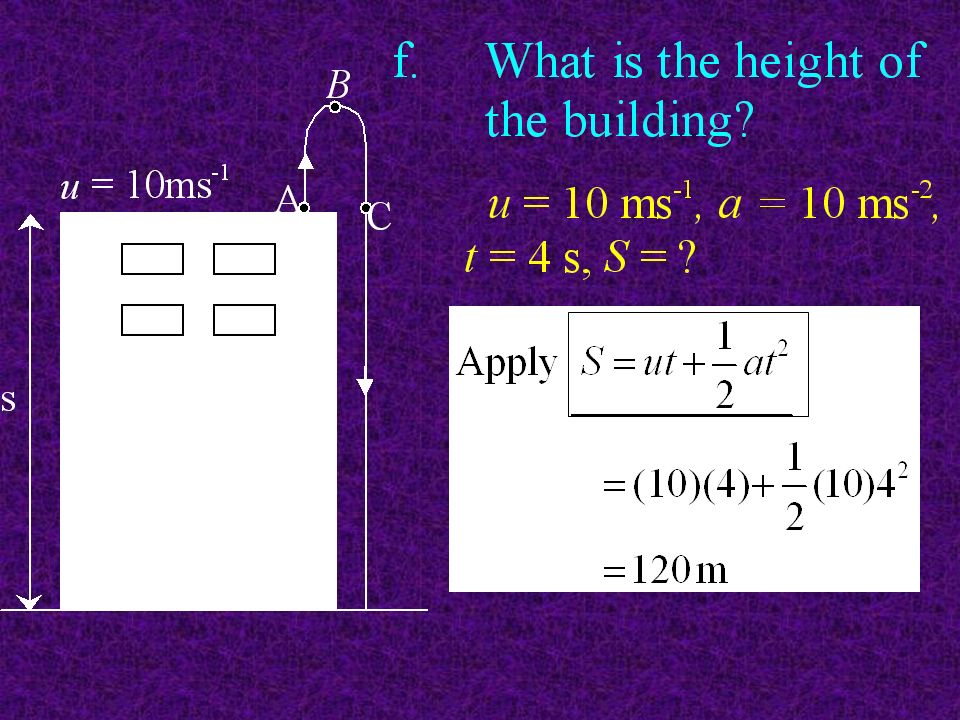
u ut at t 1/2 (a t 2 ) u v t S=(u+v)t/2
 u v t S=(u+v)t/2")
21
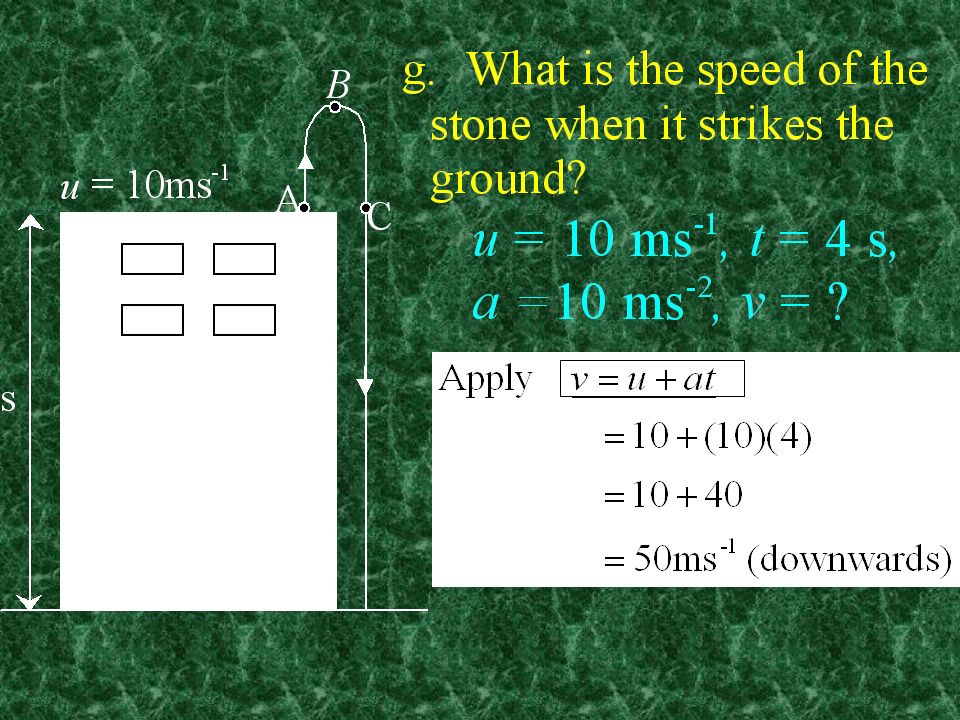
no s v a t

22
u,v,a& scan be ‘+’ or ‘-’ depend on direction

23
v = - 4ms -1 Case 1 u = 1ms -1 v = 4ms -1 t = 3s a = ? Case 2 ‘+’direction u = 1ms -1 t = 5s

Similar presentations


 graph is equal to the: A. acceleration B. distance travelled C. time interval.>")
 Graph Slope of a DT graph gives speed D This is a graph of an object not moving. No slope = No speed T.>")


 is defined as the rate of change of velocity. It has units of m/s 2 Acceleration can be positive, negative, or zero. An.>")

