Download presentation
Presentation is loading. Please wait.

1
PLANT DESIGN II (CAB 4023) PRODUCTION OF 396, 000 TONNE OF AMMONIA PER YEAR
GROUP 11 MUHAMMAD FAIZ MOHD FUDZAILI MUHAMMAD FAUZI KHAMIS MUHAMMAD NUR AZIZI ABDUL AZIZ NUR IZZATI BUJANG AMRI SOFIA KEETASOPON SUPERVISOR: DR MOHANAD EL-HERBAWI

2
GENERAL OVERVIEW

4
INTRODUCTION

5
BACKGROUND STUDY Commercially known as anhydrous ammonia
Ammonia is a colourless gas with a sharp, penetrating odour. The heart of ammonia manufacture is the Haber process One of the most essential material of the world nitrogen industry

6
USAGE OF AMMONIA Household cleansing agent Fertilizer products
Manufacture synthetic fibers : nylon and rayon Neutralize acidic by-products of petroleum refining

7
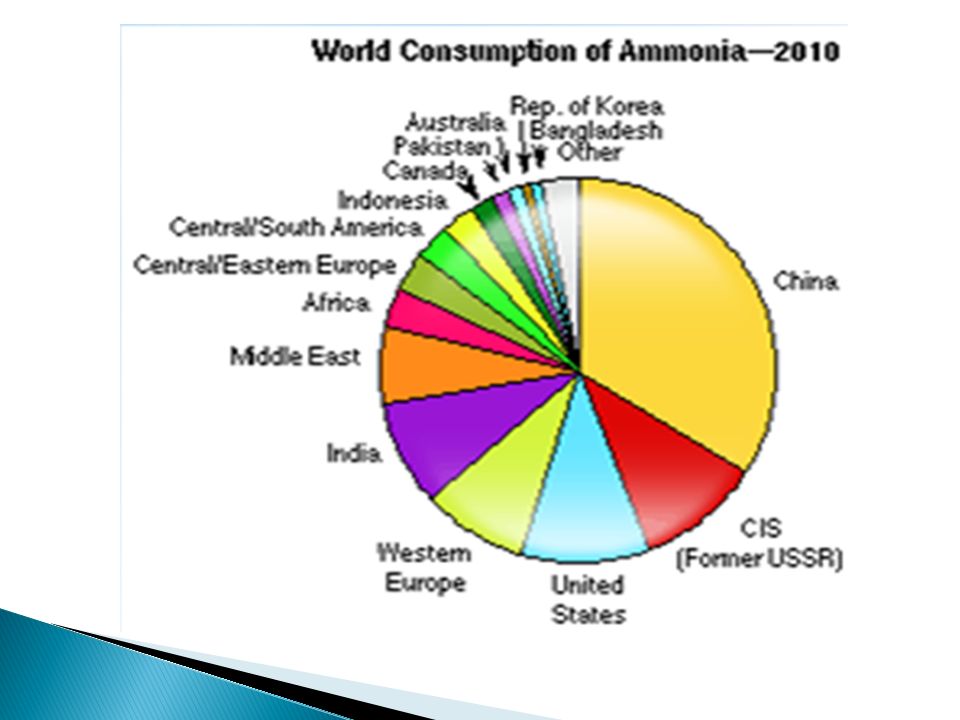
MARKET STUDY 78% used for fertilizer production.
3% used in direct application 19% consumed for industrial end uses. Continuous growth in the ammonia import correspond to demand for fertilizer production. The additional ammonia availability in the market from low cost capacity will displace local production in other regions where gas costs are higher e.g. Europe and US Source : AFA 15th International Forum

9
Global ammonia capacity is projected to be 224.1 Mt NH3 in 2014.
Global ammonia capacity is projected to increase between 2010 and 2015 at an annual growth rate of 3.5%, equating to a net expansion of 37.4 Mt NH3 over 2009. Global ammonia capacity is projected to be Mt NH3 in 2014. Much of the growth in ammonia capacity is associated with new urea capacity. Global urea capacity will expand by a net 30% between 2009 and 2014 corresponds to a compound annual growth rate of 5.4%. International trade of urea and merchant ammonia is projected to expand by 15 and 20%, between and 2014.

10
PROBLEM STATEMENT Students are required to:
Select the most convenience way to produce ammonia. Calculate the mass balance. Perform heat integration for selected process. Perform study on control and instrumentation. Conduct the economics evaluation. Identify the environmental and safety issues related to the plant.

11
To design a process plant that produce
OBJECTIVE To design a process plant that produce 396, 000 tonnes ammonia per year.

12
ALTERNATIVE PROCESSES

13
Synthesis gas production
Three process steps of industrial ammonia production: Synthesis gas production Gas purification Synthesis of ammonia

14
SYNTHESIS GAS PRODUCTION
Alternative Processes Steam Reforming Process Partial Oxidation Process Electrolysis Process

15
Steam Reforming Process
Reaction : CH4 + H2O → CO + 3 H2 CO + H2O → CO2 + H2 CH4 + 2 H2O → CO2 + 4 H2 Process Description : Natural gas consists mainly of methane and refinery gas is a mixture of hydrocarbon gases. The resulting gas mixture contains by volume about 57% hydrogen, 21% nitrogen, 10% carbon dioxide 11% carbon monoxide and some impurities. Advantages: Produced more hydrogen if compare to other processes. Less energy requirement. Economically competitive due to the low price of the feedstock. Less carbon monoxide produced.

16
Partial Oxidation Process
Reaction : CnH(2n + 2) + ½ nO2 → nCO + (n + 1)H2 Process Description : Oxygen is used instead of air for the reaction This process is adapted to the partial oxidation of coal and fuel oil The carbonaceous materials are burned with a limited quantity of oxygen in the presence of steam at a temperature of about C Disdvantages: Demands careful control of the feed rates to the combustion chamber. Heat resisting materials are needed for the construction of the reaction vessels bricks. Not economically competitive due to the high price of the oxygen. More carbon monoxide produced. 5. Less hydrogen produced.
 + ½ nO2 → nCO + (n + 1)H2. Process Description : Oxygen is used instead of air for the reaction. This process is adapted to the partial oxidation of coal and fuel oil. The carbonaceous materials are burned with a limited quantity of oxygen in the presence of steam at a temperature of about C. Disdvantages: Demands careful control of the feed rates to the combustion chamber. Heat resisting materials are needed for the construction of the reaction vessels bricks. Not economically competitive due to the high price of the oxygen. More carbon monoxide produced. 5. Less hydrogen produced.")
17
Electrolysis Process Reaction : H2O ↔ H2 + O2 Process Description :
Two electrodes are placed in a vessel full of water. The cathode is an iron plate and the anode is a nickel iron plate. A diaphragm of asbestos is placed between the electrodes. Advantages: Yields very pure hydrogen Disadvantage : Has been utilized commercially where low-cost electricity is available, such as Canada but high cost of electricity in Malaysia.

18
SYNTHESIS GAS PRODUCTION
CHOOSEN! Steam Reforming Process Partial Oxidation Process Electrolysis Process Produced more hydrogen if compare to other process. Less energy requirement. Economically competitive due to the low price of the feedstock Less carbon monoxide produced.

19
CO2 REMOVAL Process Advantages Disadvantages Water scrubbing
Simple plant No heat load Solvent availability at minimal cost Excessive loss of hydrogen Very high pumping load Poor CO2 removal efficiency CHOOSEN! Amine Rapid absorption Excellent stability Easy regeneration High heat consumption on reactivation Less economical at high concentration of CO2 Hot carbonate Inexpensive absorbent Rapid absorption Reactivation up to 100% Less economical at low CO2 concentrations Usually followed by a second absorber to reach low CO2 concentrations in gas

20
SYNTHESIS OF AMMONIA CHOOSEN! Designation Pressure, atm
Tempera-ture, °C Catalyst Recircu-lation Conversion, % Bleed to remove inert CHOOSEN! Haber-Bosch 550 Doubly promoted iron Yes 10-30 Claude Promoted iron No 40-85 Casale 600 500 Promoted iron Yes 15-18 No Fauser 200 500 Promoted iron Yes 12-23 *40 % conversion of the gas upon passage through a single converter and 85 % conversion after passage through a series of converters. Gas is vented after one passes through the converters.

21
PLANT DESIGN

22
INPUT-OUTPUT STRUCTURE
Recycle Purge Product(NH3) Feed (NG, Air, Steam) Process By-Product (H2O,CO2) Purification of feed stream is not required Purge stream is required Recycle is required (Product & By-Product)
 Feed. (NG, Air, Steam) Process. By-Product. (H2O,CO2) Purification of feed stream is not required. Purge stream is required. Recycle is required (Product & By-Product)")
23
REACTOR DESIGN Flow Pattern Models of Reactor Reactor Type
Principal Application Advantages Disadvantages Continuous Stirred Tank Reactor (CSTR) Gas-liquid reaction Consistent product quality due to reproducible process control Low operating costs Wide range of throughput Final conversion lower than in other basic reactor types Unfavorable if the reaction must take place in high pressure Tubular Reactor Homogeneous gas phase reactions Favorable conditions for temperature control by heat supply or heat removal No moving mechanical parts High throughput Very high degree of specialization Relative large pressure drop CHOOSEN!
 Gas-liquid reaction. Consistent product quality due to reproducible process control. Low operating costs. Wide range of throughput. Final conversion lower than in other basic reactor types. Unfavorable if the reaction must take place in high pressure. Tubular Reactor. Homogeneous gas phase reactions. Favorable conditions for temperature control by heat supply or heat removal. No moving mechanical parts. High throughput. Very high degree of specialization. Relative large pressure drop. CHOOSEN!")
24
Reactor Configurations Fluidized-bed Catalytic
REACTOR DESIGN Reactor Configurations Fixed-bed Catalytic Reactor Fluidized-bed Catalytic The fixed-bed (packed-bed) reactor is a tubular reactor that is packed with solid catalyst particles. Most designs approximate to plug-flow behavior. In fluidized-bed reactors, solid material in the form of fine particles is held in suspension by the upward flow of the reacting fluid. CHOOSEN!
 reactor is a tubular reactor that is packed with solid catalyst particles. Most designs approximate to plug-flow behavior. In fluidized-bed reactors, solid material in the form of fine particles is held in suspension by the upward flow of the reacting fluid. CHOOSEN!")
25
Fixed-bed Catalytic Reactor
REACTOR SELECTION Packed with solid catalyst particles. Highest conversion per weight of catalyst. Behaves as plug flow allows efficient contacting between reactants and catalyst. Flexible Fixed-bed Catalytic Reactor

26
SEPARATION SYSTEM In general, a series of separations are required after the reaction has taken place. The purposes are follows: - To achieve desired product purity. - To recover unconverted reactants. - To remove the hazardous or undesired components before discharging them to environment.

27
Heterogeneous mixture To separate water and gas (N2 and H2)
SEPARATION SYSTEM Heterogeneous mixture (liquid and gas) Two-phase separator To separate water and gas (N2 and H2) To separate fully converted ammonia product (liquid) and partially converted ammonia product (gas)
 Two-phase separator. To separate water and gas (N2 and H2) To separate fully converted ammonia product (liquid) and partially converted ammonia product (gas)")
28
MATERIAL BALANCE

29
HEAT INTEGRATION

30
What is pinch technology? Objective of pinch analysis
Methodology for minimizing energy consumption by optimizing heat recovery systems Objective of pinch analysis To achieve financial saving by constructing the best process heat integration To optimize the process heat recovery and reducing external utility loads

31
METHODOLOGY Identification of hot, cold and utility streams in the process Thermal data extraction for process and utility streams Selection of initial ∆Tmin value Construction of problem table algorithm Identification Tpinch, QH,min and QC,min via heat cascade table Construction of heat exchanger network Calculation of energy saving

32
Cold Stream Hot Stream Back

33
Supply temperature TS(°C) Target temperature TT(°C)
Stream Supply temperature TS(°C) Target temperature TT(°C) Utility ∆H (kW) No. Name (Refer to iCON) Name Type 1 E105 H1 Hot 427.22 204.44 2 E103 H2 220.00 40.00 3 E115 H8 460.00 300.00 4 E116 H9 150.00 5 E107 C1 Cold 50.00 290.00 6 E113 C2 30.00 189.61 7 E114 C3 350.00 Back
 Target temperature TT(°C) Utility. ∆H (kW) No. Name (Refer to iCON) Name. Type. 1. E105. H1. Hot E103. H E115. H E116. H E107. C1. Cold E113. C E114. C Back.")
34
Ts*= Ts - ∆T/2 Tt*= TT + ∆T/2 NOTE THAT::
Stream Supply temperature TS(°C) Target temperature TT(°C) CP(kW/°C) Shifted temperature (°C) Utility ∆H (kW) ∆Tmin/2 No. Name (Refer to iCON) Name Type TS* TT* 1 E105 H1 Hot 427.22 204.44 422.22 199.44 5 2 E103 H2 220.00 40.00 215.00 35.00 3 E115 H8 460.00 300.00 455.00 295.00 4 E116 H9 150.00 145.00 E107 C1 Cold 50.00 290.00 55.00 6 E113 C2 30.00 189.61 194.61 7 E114 C3 350.00 355.00 Ts*= Ts - ∆T/2 Tt*= TT + ∆T/2 NOTE THAT:: 1 CP = ∆H/∆T, ∆H is obtained from iCON 2 ∆Tmin = 10˚C Back
 Target temperature TT(°C) CP(kW/°C) Shifted temperature (°C) Utility. ∆H (kW) ∆Tmin/2. No. Name (Refer to iCON) Name. Type. TS* TT* 1. E105. H1. Hot E103. H E115. H E116. H E107. C1. Cold E113. C E114. C Ts*= Ts - ∆T/2. Tt*= TT + ∆T/2. NOTE THAT:: 1. CP = ∆H/∆T, ∆H is obtained from iCON. 2. ∆Tmin = 10˚C. Back.")
35
Interval Temperature (˚C)
PROBLEM TABLE ALGORITHM Interval Temperature (˚C) Stream Population ∆Tinterval (°C) ∑CPC -∑CPH (kW/°C) ∆Hinterval(kW) Surplus/Deficit 455.00 32.78 Surplus 422.22 67.22 355.00 60.00 295.00 80.00 215.00 15.56 199.44 4.83 194.61 49.61 145.00 90.00 55.00 20.00 35.00 109 102 110 103 106 104 105 Back
 Stream Population. ∆Tinterval (°C) ∑CPC -∑CPH (kW/°C) ∆Hinterval(kW) Surplus/Deficit Surplus Back.")
36
Interval temperature (˚C) Adjusted heat cascade (kW)
HEAT CASCADE TABLE Interval temperature (˚C) ∆Hinterval (kW) Heat flow (kW) Adjusted heat cascade (kW) 455.00 0.0000 422.22 355.00 295.00 215.00 199.44 194.61 145.00 55.00 35.00 QH,min Tpinch (˚C): /2 = 460˚C QC,min
 ∆Hinterval (kW) Heat flow (kW) Adjusted heat cascade (kW) QH,min. Tpinch (˚C): /2. = 460˚C. QC,min.")
37
Combine Composite Curve
Grand Composite Curve Back

38
GRID DIAGRAM

39
Above pinch region: Cpc > Cph Below pinch region: Cph > Cpc
1 Cp rules: Below pinch region: Cph > Cpc No temperature crossover of hot and cold stream through the heat exchanger 2

40
GRID DIAGRAM WITH HEAT EXCHANGER DESIGN
1) kW/2 = kW/˚C x (460˚C - T) 2) T = ˚C Back
 kW/2 = kW/˚C x (460˚C - T) 2) T = ˚C. Back.")
41
COMPARISON ON TOTAL UTILITY CONSUMPTION
Total Utility Consumption Before HI Name (Refer to iCON) ∆H (kW) Remaining Heat For Cooling Requirement (kW) C102 C103 C109 C110 H104 0.0000 H105 H106 Total Total Utility Consumption After HI
 ∆H (kW) Remaining Heat For Cooling Requirement (kW) C C C C H H H Total Total Utility Consumption After HI.")
42
Total Utility Consumption
ENERGY SAVING AFTER HEAT INTEGRATION Total Utility Consumption Base Case Design Before HI (kW) After HI Energy Saved % Reduction 70.05% = (222, kW – 65, kW) / kW = 70.05%
 After HI Energy Saved % Reduction % = (222, kW – 65, kW) / kW. = 70.05%")
43
PLANT LAYOUT

44
PLANT LAYOUT

45
PROCESS FLOWSHEETING

46
INSTRUMENTATION & CONTROL

47
SAFETY & LOSS PREVENTION

48
HAZARD AND OPERABILITY STUDY (HAZOP)
Objective of HAZOP To indentify potential hazards and potential operability problems that may arise from the deviations of design intent.

49
LIST OF HAZOP GUIDE WORDS
NO None of design intent is achieved. MORE Quantitative increase LESS Quantitative decrease REVERSE The logical opposite of the intention AS WELL AS An additional activity occur PART OF Only some of design intent is achieved OTHER THAN Complete substitution

50
HAZOP ANALYSIS HAZOP Study Nodes Node 1
Methanator (R105) including incoming line discharge from heat exchanger (E117) Node 2 Ammonia Converter (R106) including incoming line discharge from heat exchanger (E105) Node 3 Ammonia Separator (V106) including incoming line discharge from cooler (E120)
 including incoming line discharge from heat exchanger (E117) Node 2. Ammonia Converter (R106) including incoming line discharge from heat exchanger (E105) Node 3. Ammonia Separator (V106) including incoming line discharge from cooler (E120)")
51
Node 1

52
HAZOP ANALYSIS: NODE 1 Parameter : Flow Guide Word Deviation
Possible Causes Consequences Safeguards Recommendations NO No Flow 1. Line (S22) leakage. 2. Loss of feed supply. 3. Blockage inside pipeline (S22). 1. No process gas into the reactor 2. Release of toxic material. 1. Flow indicator is provided. 2. Perform regular schedule inspection on process line. 1. Install gas detection system is provided. 2. Install No Flow alarm
 leakage. 2. Loss of feed supply. 3. Blockage inside pipeline (S22). 1. No process gas into the reactor. 2. Release of toxic material. 1. Flow indicator is provided. 2. Perform regular schedule inspection on process line. 1. Install gas detection system is provided. 2. Install No Flow alarm.")
53
Parameter : Flow Guide Word Deviation Possible Causes Consequences
Safeguards Recommendations LESS Less Flow 1. Partially plug line. 2. Control valve failure. 3. Line (S22) leakage. 1. Pressure drop inside the reactor (R105) 2. Less process gas into reactor. 1. Flow indicator is provided. 2. Perform regular schedule inspection on process line. 1. Install gas detection system is provided.
 leakage. 1. Pressure drop inside the reactor (R105) 2. Less process gas into reactor. 1. Flow indicator is provided. 2. Perform regular schedule inspection on process line. 1. Install gas detection system is provided.")
54
Parameter : Flow Guide Word Deviation Possible Causes Consequences
Safeguards Recommendations MORE More Flow 1. Control valve failure. 1. Over pressure inside the reactor. 2. May lead to reactor explosion 3. Undesired product quality 1. Flow indicator is provided. 2. Perform regular schedule inspection on process line. 1. Install gas detection system is provided. 2. Install high flow alarm. REVERSE Reverse Flow 1. Back pressure. 2. Failure of pressure controller. 3. Compressor trips. 1. Reverse flow from reactor (R105) 2. Less of product yield. 1. Flow indicator is provided. 2. regular schedule inspection on process line. 1. Install Non-return/check valve
 2. Less of product yield. 1. Flow indicator is provided. 2. regular schedule inspection on process line. 1. Install Non-return/check valve.")
55
Parameter : Temperature
Guide Word Deviation Possible Causes Consequences Safeguards Recommendations LOW Low Temperature 1. Malfunction of heat exchanger (E117) 1. Rate of reaction is reduced. 1. Temperature indicator is provided. 1. Install low temperature alarm. HIGH High Temperature 1. Failure of cooler. 2. Poor heat transfer in the cooler. 3. HE (E117) failure. 1. Less of product goes to the storage. 1. Temperature indicator is provided. 2. High temperature alarm is provided. 1. Install high temperature alarm.
 1. Rate of reaction is reduced. 1. Temperature indicator is provided. 1. Install low temperature alarm. HIGH. High Temperature. 1. Failure of cooler. 2. Poor heat transfer in the cooler. 3. HE (E117) failure. 1. Less of product goes to the storage. 1. Temperature indicator is provided. 2. High temperature alarm is provided. 1. Install high temperature alarm.")
56
Parameter : Pressure Guide Word Deviation Possible Causes Consequences
Safeguards Recommendations LOW Low Pressure 1. Compressor failure. 2. Pipe leakage. 1. Impact to reactor. 2. May lead to reverse flow. 1. Pressure indicator is provided to notify operator. 1. Install high temperature alarm. 2. Install Low pressure alarm. HIGH High Pressure 1. Failure of pressure relief valve. 2. More process gas into the reactor. 3. Pipe blockage. 1. Pipe vibration. 2. May lead to explosion. 1. Pressure indicator is provided to notify operator. 1. Install high pressure alarm. 2. Install emergency shutdown system.

57
WASTE TREATMENT

58
Generally, the effluent discharge from Ammonia Plant needs to comply with Environmental Quality (Sewage and Industrial Effluents) Regulations, (Regulation 8(1) Third Schedule, Standard A, EQA 1979). The main consideration in wastewater treatment system is the COD and BOD value. Parameter Unit Standard A B Temperature °C 40 pH Value - 6.0 – 9.0 5.5 – 9.0 BOD at 20°C mg/L 20 50 COD 100 Oil and Grease Not detectable 10.0

59
WASTE STREAM Stream No. Component Composition Flow rate (kg/hour)
Phase W6 Hydrogen % 0.04 Liquid Nitrogen % 2.89 Carbon dioxide % 173.78 Water % 54 % Gas % Methane % 294.57 Ammonia % 176.38

60
WASTEWATER STREAM

61
WASTEWATER STREAM

62
WASTEWATER TREATMENT SYSTEM

63
PROCESS ECONOMICS & COST ESTIMATION

64
PLANT SITE SELECTION 1 (selected) 2 Selected Site
Gebeng Industrial Estate Phase IV Pasir Gudang Industrial Estate Kerteh Petrochemical Integrated Complex Types of Industrial 5 Price and Land Areas 4 3 Raw Material Sources Transportation Utilities TOTAL MARKS 23/25 21/25 22/25 PERCENTAGES (%) 88 76 80 RANKING 1 (selected) 2 CHOOSEN!
 RANKING. 1 (selected) 2. CHOOSEN!")
65
COMPARISON ON PLANT SITE LOCATION

66
GEBENG INDUSTRIAL ESTATE

67
ECONOMICS EVALUATION Total Capital Investment:
= Fixed Capital Investment + Working capital + Land Cost = RM 379,071, RM 18,953, RM 6,151,254.01 = RM 404,175,833.56 ≈ RM 404 million Total Cost of Production/Total Operating Cost: = Fixed Cost + Variable Charges + General Expenses = RM 71,415, RM 180,306, RM 7,581,420.56 ≈ RM 259,303,035.12

68
PROFITABILITY ANALYSIS
UNDISCOUNTED CASH FLOW ANALYSIS From Cumulative cash flow diagram for undiscounted rate above: The rate of return is 26.51% Payback time is 3.3 years after plant start-up

69
DISCOUNTED CASH FLOW DIAGRAM
From the discounted cash flow diagram above: At minimum discount rate of 15%, the net present value is RM550 million with payback time of 3.5 years The discounted cash flow rate of return is 74.95%

70
From the economic analysis done, the plant is estimated to have a capital investment of RM 215 million. At discount rate of 15%, the net present value of 550 million is attainable for a project life of 20 years and payback time of 3.5 years. With DCFRR of 74.95% and rate of return of 41.33% which is larger than the minimum attractive rate of return of 15%, the project is economically attractive and feasible.

71
CONCLUSION

Similar presentations


 from Terephthalic Acid (PTA) and Ethylene Glycol (EG). PROJECT.>")

 14/15 Fall semester Instructor: Rama Oktavian Office Hr.: M.13-15, Tu. 13-15, W.>")


