Download presentation
Presentation is loading. Please wait.

1
BEING ALIVE AND WELL AT WIND RIVER >Being Alive = Avoiding Premature Death >Being Well = Not needing high medical expenditures Methods I H S RPMS database Tabulation Cox Proportional Hazards Model for survival data Logistic Regression

2
Premature Death Figure 1--Numbers of Deaths by Age by Diagnosis o Two Peaks in Age of Death, Early (35-39) Late (70-74) Early Death Mainly Alcohol Coroner’s “Unnatural Deaths” (Accidents, Homicides, Suicides) Drugs Late Death Major Disease (Diabetes, Heart Disease, Lung Disease)
 Late (70-74) Early Death Mainly Alcohol Coroner’s Unnatural Deaths (Accidents, Homicides, Suicides) Drugs Late Death Major Disease (Diabetes, Heart Disease, Lung Disease)")
4
Premature Death Coroner’s “Unnatural Deaths” are Accidents, Homicide, and Suicide Figure 1 shows these deaths are mainly young deaths Figure 2 shows that these deaths are not only young but also largely “alcohol and/or drug” related (76%) By contrast, 22% of “Natural Deaths” are alcohol or drug related
 By contrast, 22% of Natural Deaths are alcohol or drug related")
6
Premature Death Table 2g--Odds Ratios=the odds of those with a diagnosis dying compared to the baseline with no diagnoses Figure 2g--Years lost= Life Expectancy of Baseline minus Life Expectancy of those positive for a diagnosis listed in Table 2g Alcohol alone increased Odds of Death 7.4 times, 32.5 years of life lost, 113 younger deaths Alcohol and drugs alone increased Odds of Death 16.9 times, 42.3 years of life lost, 31 younger deaths Alcohol and Tobacco alone increased Odds of Death 5.0 times, 19.6 years of life lost, 220 younger deaths Alcohol, Drugs, Tobacco alone increased Odds of Death 7.2 times, 26 years of life lost, 110 younger deaths

8
Premature Death Alcohol, and interactions with Alcohol, in Table 2g had a total of 620 early deaths compared to 267 late deaths By contrast, Major Disease and interactions with Major Disease had a total of 233 early deaths and 723 late deaths This is consistent with Figure 1 Table 2g also showed Depression and PTSD/Stress with a small positive treatment effect that increased life expectancy a small amount over the baseline—a hint about what can help

9
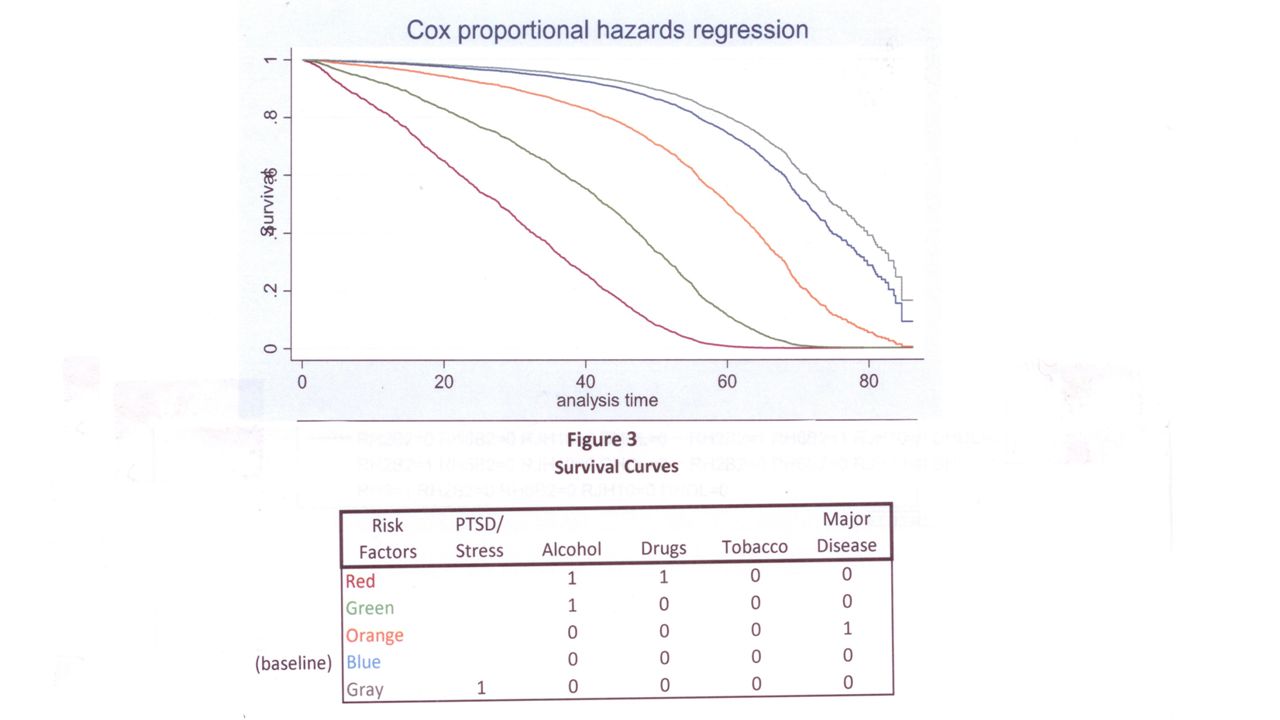
Premature Death Figure 3—Survival Curves from the data in Table 2g o The vertical axis shows the proportion of patients alive and the horizontal axis shows analysis time/age o The curves drop with age, from all patients alive to all dead o Life Expectancy is the median, the point where half are alive and half dead. o The Survival Curves drop more quickly for patients with early death diagnoses o Curves drop fastest in this order: (1) Alcohol and Drugs, (2) Alcohol, (3) Major Disease, (4) baseline, and (5) PTSD/Stress
 Alcohol and Drugs, (2) Alcohol, (3) Major Disease, (4) baseline, and (5) PTSD/Stress.")
11
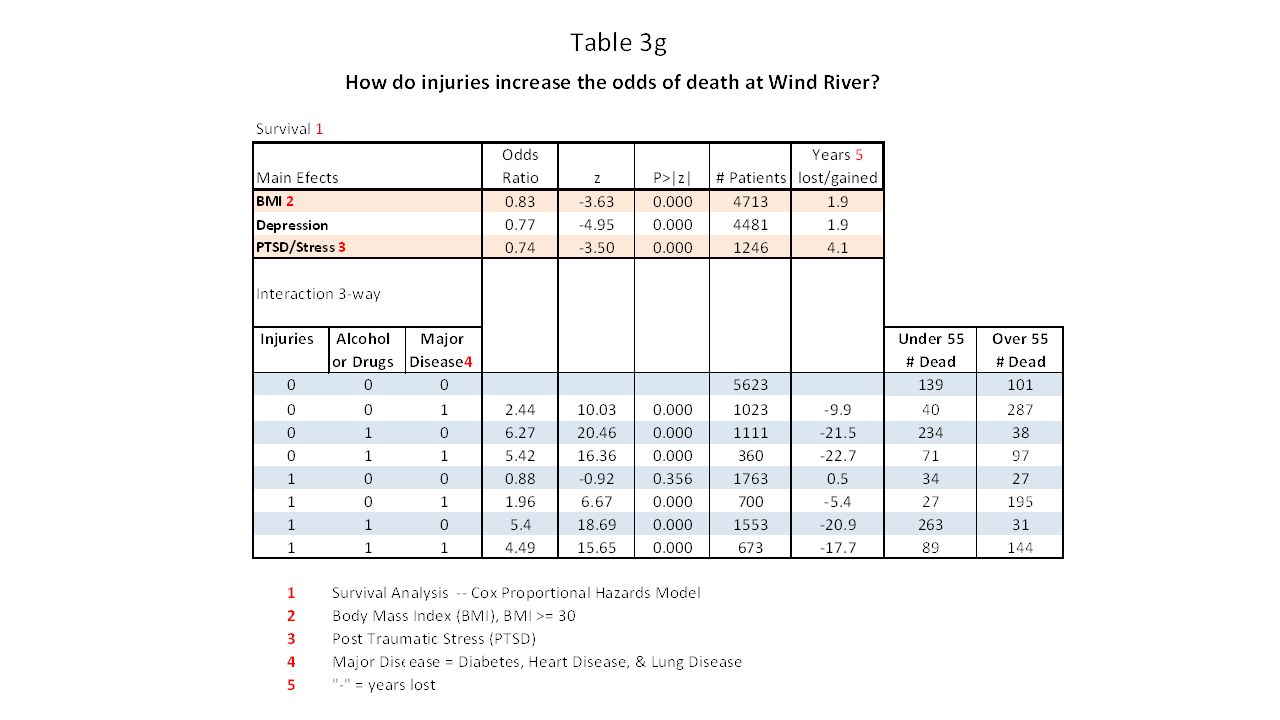
Premature Death Are injuries/accidents the leading cause of death? Previous data suggested this, but lacked context with comorbid variables and medical and behavioral histories Table 3g shows the effect of injuries in the context comorbid variables and histories Injuries alone do not increase the Odds of Death, Odds Ratio=.88, 34 younger deaths & 27 older deaths Injuries with Major Disease, increased the Odds of Death 2.0 times, 5.4 years of life lost, 27 younger deaths & 195 older deaths Injuries with Alcohol/Drugs, increased the Odds of Death 5.4 times, 20.9 years of life lost, 263 younger deaths & 31 older deaths

13
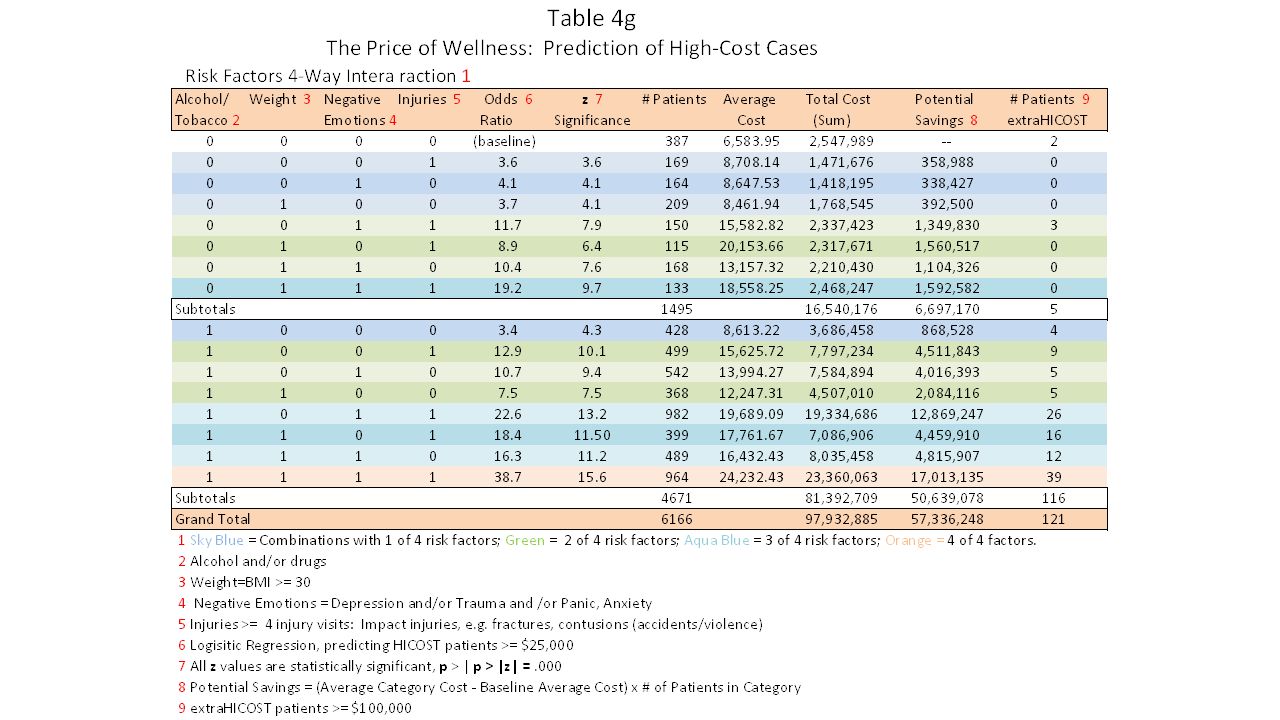
HIGH Medical Costs Figure 4g—The Cost of Wellness o Referred Care (Contract Health) Costs for 14 years, FY2000-FY2014, excluding Medicare and Medicaid costs. o 102.5 million spent, 4.6 million, under age 15, and 97.9 million age 15 and over. (Medicare/Medicaid covers many younger and many older patients). Table 4g covers ages 15 and up, most without alternative resources, private insurance low. o Four risk factors analyzed: Alcohol/Tobacco, Weight, Negative Emotions, Injuries—potentially preventable factors. o Odds of being a High Cost Case (over $25,000) is a function of the number of risk factors a patient has o Average Odds Ratio with: One risk factor=3.7, Two risk factors=10.4, Three risk factors=19.1, Four risk factors 38.7
. Table 4g covers ages 15 and up, most without alternative resources, private insurance low. o Four risk factors analyzed: Alcohol/Tobacco, Weight, Negative Emotions, Injuries—potentially preventable factors. o Odds of being a High Cost Case (over $25,000) is a function of the number of risk factors a patient has o Average Odds Ratio with: One risk factor=3.7, Two risk factors=10.4, Three risk factors=19.1, Four risk factors")
15
High Medical Costs In Table 4g, costs for Alcohol/Tobacco and interactions with this factor, totaled 81.4 million Costs without Alcohol/Tobacco and interactions with it totaled 16.5 million, a difference of 64.9 million The number of extra high-cost patients (>$100,00), with Alcohol/Tobacco and its interactions, outnumbered the patients without this risk factor 116 to 5.
, with Alcohol/Tobacco and its interactions, outnumbered the patients without this risk factor 116 to 5.")
16
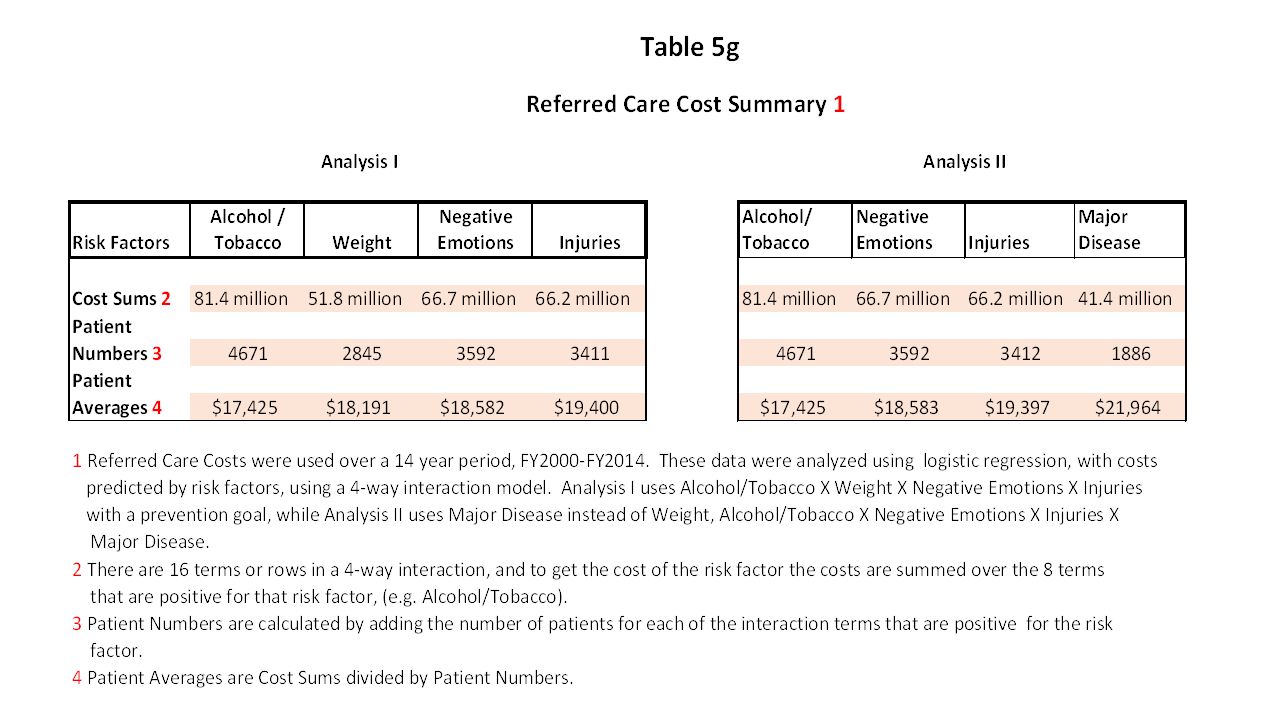
High Medical Costs Table 5g – Referred Care Cost Summary Analysis I summarizes Table 4g Analysis II adds Major Disease and drops Weight In both analyses, Alcohol/Tobacco & its interactions, have higher total costs than the other risk factors and their interactions For Alcohol/Tobacco higher costs are related to higher patient numbers (prevalence) Slightly higher average costs (per patient costs) are associated with the other risk factors due to lower prevalence The Costs for Alcohol/Tobacco (81.4 million) are much greater than the costs for Major Illness (41.4 million) in spite of higher per patient costs for Major Illness
 Slightly higher average costs (per patient costs) are associated with the other risk factors due to lower prevalence The Costs for Alcohol/Tobacco (81.4 million) are much greater than the costs for Major Illness (41.4 million) in spite of higher per patient costs for Major Illness")
18
Conclusion Priority Attention to Alcohol/Substance Treatment and Prevention is needed to save lives and reduce medical costs What would Priority Attention look like? Integration across institutions: Indian Health service, Tribal Treatment Programs, Vocational Rehabilitation, Legal System (Jails), Schools, Places of Employment (Casinos), Local Inpatient Treatment, Department of Family Services
, Schools, Places of Employment (Casinos), Local Inpatient Treatment, Department of Family Services.")
19
Conclusion Use technology to improve the integration, quality, availability, and efficiency, and monitoring of treatment. Computer Based Interventions and Treatment Followed by group counseling (covering topics initiated on the computer) Individual Counseling as needed after the above Use of smart phones for monitoring and positive interventions for younger people.
 Individual Counseling as needed after the above Use of smart phones for monitoring and positive interventions for younger people..")
20
Conclusion Treatment is completed under the direction of a Clinical Supervisor, following clinical treatment plans Treatment teams may involve different institutions The clinical supervision by a licensed professional (MD if needed), and on site treatment, would qualify the computer based, group or individual treatment for insurance reimbursement, helping sustain the programs Individual incentives given to clients to promote continuation and completion
, and on site treatment, would qualify the computer based, group or individual treatment for insurance reimbursement, helping sustain the programs Individual incentives given to clients to promote continuation and completion")
21
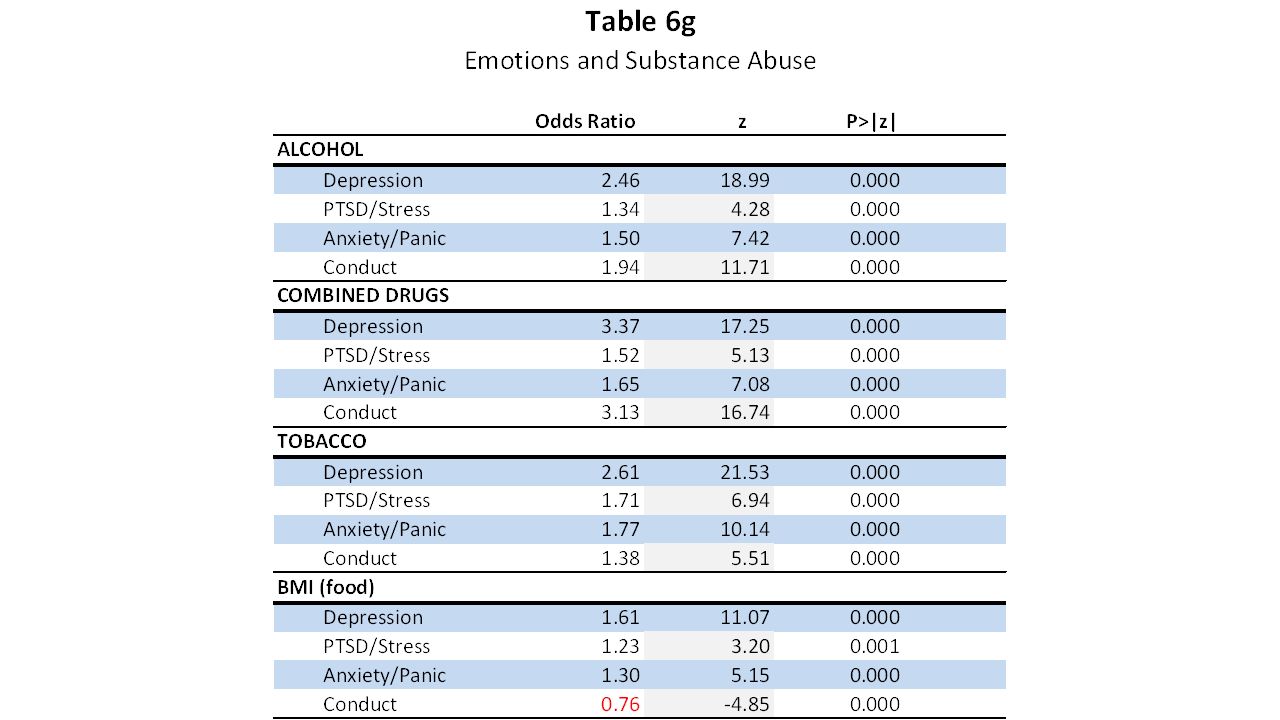
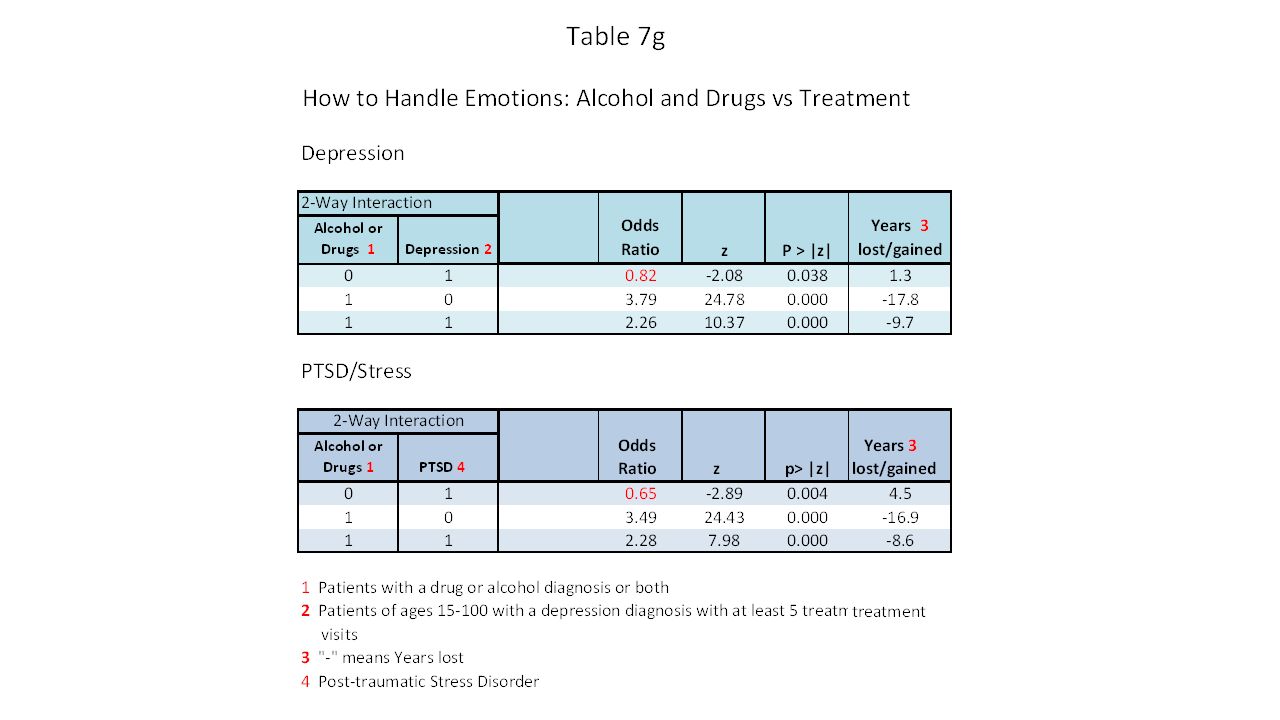
Addendum Substance Abuse has comorbid conditions—Depression PTSD/Stress, Anxiety/Panic, Conduct problems (see Table 6g) These comorbid conditions need treatment for substance treatment to be effective—conversely treatment for depression & PTSD/Stress is not effective when clients are using alcohol/drugs (see Table 7g) Computer_based treatment can be effective in treating depression & PTSD/Stress, assisting counselors with less familiarity with the topic
 These comorbid conditions need treatment for substance treatment to be effective—conversely treatment for depression & PTSD/Stress is not effective when clients are using alcohol/drugs (see Table 7g) Computer_based treatment can be effective in treating depression & PTSD/Stress, assisting counselors with less familiarity with the topic")
Similar presentations