Download presentation
Presentation is loading. Please wait.

1
First 5 Placer Summary of 2013-14 Demographics, Services Provided & Accomplishments

2
2 2013-14 Summary of Demographics, Services Provided & Accomplishments Overview of Demographics of Individuals Served By Category By Region By Ethnicity By Language Services by Protective Factor Framework Family Strengthening Community Strengthening Overall Accomplishments

3
3 Total Count of Individuals Directly Served Population Served2013-20142012-2013Change Children Age 0-55,2854,905+380 Parents/Caregivers/ Guardians 10,5728,4372,135 Other Family Members907899+8 Child Care/Other Service Providers 1,1681,004+164 Total Served17,93215,245+2,687

4
Total Count of Individuals Directly Served By Fiscal Year 4

5
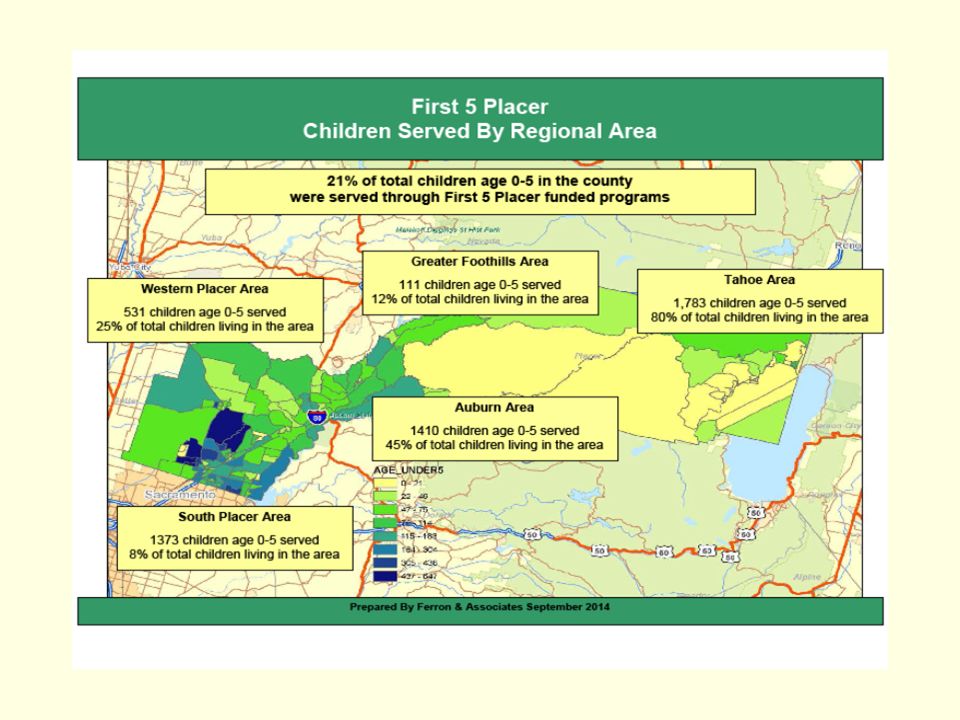
5 Total Children Age 0-5 & Parents Served: By Region 2013-14 Total Children & Parents = 15,857

6
6 Children Age 0-5 and Parents Served Countywide through First 5 Placer funded programs Percentage of Total Children Age 0-5 & Parents Served Countywide* 2013- 2014 2012- 2013 % of Children Age 0-521%19% % of Parents of Children Age 0-5 23%18% *Based on 2010 US Census Countywide Population

8
Total Children Age 0-5 & Parents Served: By Ethnicity 2013-14 Total Children & Parents = 15,857 8

9
9 % of County’s Children Age 0-5 and their Parents Served by Ethnicity 2013-142012-13 Native American25%70% Asian/PI4%5% African American/Black14%13% Hispanic/Latino25%20% White11%9% Multiracial8% Total Children Age 0-5 & Parents Served: By Ethnicity

10
10 Total Children Age 0-5 & Parents Served: By Language 2013-14 Total Children & Parents = 15,857

11
11 Services and Accomplishments by Protective Factor Framework Included in 2011-2016 Strategic Plan: Family Strengthening Community Strengthening

12
12 Family Strengthening Five Protective Factors included in Strategic Plan Increased Individual and Family Social Connections Increased Knowledge of Parenting & Child Development Enhanced Development of Children Concrete Support in Times of Need Enhanced Parental Resilience

13
13 Family Strengthening 18 major funded programs worked on improving five Family Strengthening Protective Factors By design, 10 of the 18 funded programs reported Protective Factor survey results for parents they served 8 of 18 programs reported their accomplishments based on other tailored measures/surveys

14
14 Family Strengthening: Overall Improved Individual And Family Social Connections Funded program strategies included: Having regular informational or social events for families to meet with each other and foster new relationships. Offering enrichment, sporting or exercise activities for families. Families have reduced isolation from peers, family and community. 34% of total parents participated in social activities and support groups with their children and other parents.

15
15 Increased Knowledge of Parenting & Child Development Funded program strategies included: Offering frequent interactions between parents and staff with coaching. Providing opportunities for parent education & parent-to- parent peer experiences. Parents have more appropriate expectations and use more developmentally-appropriate and positive guidance with their children. 39% of total parents participated in parenting classes and/or support groups. Family Strengthening: Overall

16
Improved Child Development/Nurturing & Attachment Funded program strategies included: Using curriculum and teaching interactions to help children learn to share, be respectful of others, and express themselves through language. Fostering ongoing engagement and communication with parents about their children's social and emotional development. Being nurtured and developing bonds with caring adults in early life affects all aspects of children’s behavior and development. 83% of children age 0-5 and 24% of parents participated in early childhood enrichment or education program. 16

17
Family Strengthening: Overall Concrete Support in Times of Need Funded program strategies included: Letting parents know about available community resources and linking parents with service providers who speak their language. Listening for family stress and initiating positive conversations about family needs. Families have increased stability, reduced stress, and care helped to avoid and/or overcome crises. 73% of total parents served received information, resources and referrals, and/or were linked to services. 17

18
Family Strengthening: Overall Increased Parental Resilience Funded program strategies included: Utilizing counseling as part of integrated service team Helping parents to understand the causes of stress and how it affects health, relationships and family life, and learn concrete skills to prevent and relieve stress Parents have increased ability to find solutions, build trusting relationships, bounce back from all types of challenges, and are able to seek assistance when needed 22% of total parents received support to increase individual and family resilience; 17% received counseling and/or case management services 18

19
19 Family Strengthening: Protective Factor Parent Survey Background Protective Factor survey includes 20-items that are rated by pre- and post-parent response. Created by the FRIENDS National Resource Center for Community-based Child Abuse Prevention, in collaboration with University of Kansas Institute for Education Research and Public Service. Being used by a number of CA First 5’s and other States as a tool for assessment of needs, program improvement and evaluation. Four field tests have been completed using the survey, and a reliability and validity study has been conducted.

20
20 Family Strengthening: Protective Factors Results from Protective Factor parent survey are intended to assist the: First 5 Commission in understanding what is changing for families across the funded programs; Funded programs in self-assessment and guiding improvements. Not intended to be used as a stand-alone tool for individual program evaluation. Intended to be used in combination with other outcome measures, and with the results from other assessments, descriptive measures, or survey tools.

21
Results of Pre- and Post-Protective Factor Parent Survey 2013-2014 Protective Factor*NMean PRE-Mean POST-Change** Social Connections 2705.786.18+0.40 Knowledge of Parenting 2705.936.31+0.38 Child Dev/Nurturing & Attachment 2706.486.58+0.10 Concrete Support in Times of Need 2705.335.88+0.55 Parental Resilience 2705.535.88+0.35 *Scale of 1 to 7; with 23% response rate **T-test results indicate that there is a statistically significant probability that the mean post-score will be different than the mean pre-score and this is not due to chance. 21

22
22 Community Strengthening Three Protective Factors in Strategic Plan Healthy Community Beliefs and Clear Standards Caring and Supportive Community Connections and Networks Community-based Opportunities for Participation

23
23 Community Strengthening 6 major funded programs and First 5 worked on improving three Community Strengthening protective factors All 6 programs reported accomplishments based on individualized measures and/or surveys

24
24 Community Strengthening: Overall Healthy Community Beliefs and Clear Standards Funded program strategies included: Conducting parent meetings, community forums or workshops to talk with parents. Seeking opportunities to sponsor joint events or informational sessions in the community. Communities that provide increased access to information on child health and development, and parent education and support, are seen to actively or visibly appreciate children and youth and their families.

25
25 Community Strengthening: Overall Healthy Community Beliefs and Clear Standards 12% of total parents participated in nutrition, fitness, health & safety classes/events, received safety equipment, received health insurance assistance and/or legal resources and support. 40% of total parents received phone assistance to determine interest/eligibility for CalFresh (154% increase over last year). 213 low cost car seats (47% increase over 2012-13) and 215 bike helmets (55% increase over last year) distributed.
. 213 low cost car seats (47% increase over ) and 215 bike helmets (55% increase over last year) distributed..")
26
26 Community Strengthening: Overall Caring and Supportive Community Connections and Networks Funded program strategies included: Providing a common set of outcomes, such as using the protective factor framework, to foster positive outcomes for families across systems. Creating service collaborations, coordinating or aligning services, and/or utilizing common intake and/or assessment tools. Community networks that sustain children and their families are a source of protection, support and advocacy. These networks reduce fragmentation and encourage integration.

27
27 Community Strengthening: Overall Caring and Supportive Community Connections and Networks 1,168 family service professionals built connections to networks and teams, and participated in training and enrichment around early childhood development and care, nutrition, maternal depression, and nonviolent communication. 22 First 5 partners indicated 93 key community partners they work closely with to effectively deliver programs & services; 168 individuals from agencies in the Tahoe region worked together through the Community Collaborative (CCTT).
..")
28
28 Community Strengthening: Overall Opportunities for Community-based Participation Funded program strategies included: Creating opportunities for volunteers to participate in community activities. Partnering with businesses and service organizations to be involved in strengthening families. Communities that engage in volunteerism create opportunities for people to solve problems and communicate beneficial expectations for children and youth.

29
29 Community Strengthening: Overall Opportunities for Community-based Participation 56% of funded agencies provided opportunities for families to volunteer within their organization or in support of their community. 52% of funded agencies utilized volunteers to support their service delivery. 72% of funded agencies indicated receiving additional funding and/or resources from sources other than First 5 in the last year.

30
Results of Annual Organizational Survey on Implementation of Protective Factor Framework 30

31
Results of Annual Organizational Survey on Implementation of Protective Factor Framework 31

32
32 Overall Accomplishments Successful strategies used to reach children age 0-5, parents, family members and service providers. Consistent delivery of services and progress toward achieving intended outcomes Expanding implementation of protective factor framework. Increasing expansion of service networks. Strengthening of community mindedness.

33
33 Summary of 2013-14 Programs, Outcomes & Accomplishments Questions or Comments? Ferron & Associates October 2014 First 5 Placer

Similar presentations


,>")


 2006 Program Instruction Overview May 2006 Melissa Lim Brodowski Office on Child Abuse and Neglect,>")
