Download presentation
Presentation is loading. Please wait.

1
Principles of Chromatography

2
Chromatography is the most powerful tool for separating & measuring the components of a complex mixture. Quantitative & qualitative analysis

3
What is Chromatography? 1) Solvent Extraction : transfer of a solute from phase 1 phase 2 S (in phase1) S (in phase 2) partition coefficient
 Solvent Extraction : transfer of a solute from phase 1 phase 2 S (in phase1) S (in phase 2) partition coefficient.")
4
2) Chromatography : same as extraction a) One phase: held in place stationary phase. solid material (packing material) Another phase : fluid phase mobile phase. sample gas (GC) liquid (LC) What is Chromatography?
 Another phase : fluid phase mobile phase. sample gas (GC) liquid (LC) What is Chromatography .")
5
b) A solute equilibrates between a mobile and a stationary phase. The more it interacts with the stationary phase, the slower it is moved along a column. Xm Xs Ks = [X]s / [X]m Solutes with a large Ks value will be retained more strongly by the stationary phase.

6
What is Chromatography?

7
c) The science & art of separation d) Originator : adsorption chromatography by M.Tswett in 1903 e) Eluent, eluate, elution. What is Chromatography?

8
elution : always (100%) dilution What is Chromatography?
 dilution What is Chromatography")
9
3) Types of Chromatography Is divided into categories on the basis of the mechanism of interaction of the solute v.s. the stationary phase. What is Chromatography?

10
polar s.p. What is Chromatography? for GC & LC for GC

11
21.1 What is Chromatography? resin-SO 3 - gel filtration resin-N(CH 3 ) 3 + by size
 3 + by size")
12
What is Chromatography? Ask Yourself 20-A p.461 pH, and ionic strength the most selective one

14
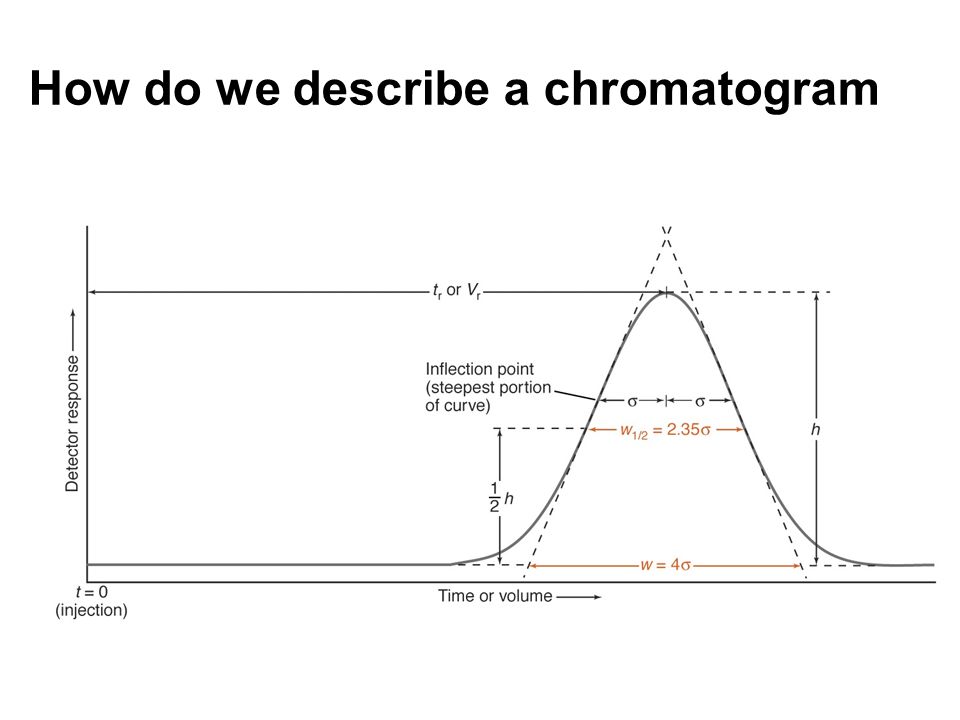
How do we describe a chromatogram 1) Chromatogram : A graph showing the detectors response as a function of elution time : band’s shapes, position, resolution.
 Chromatogram : A graph showing the detectors response as a function of elution time : band’s shapes, position, resolution.")
15
2) For individual band : a)Retention time (t r ) : the time needed after injection for an individual solute to reach detector. b)An ideal chromatographic peak Gaussian shape. w ½ = 2.35σ, w = 4σ How do we describe a chromatogram
An ideal chromatographic peak Gaussian shape. w ½ = 2.35σ, w = 4σ How do we describe a chromatogram.")
18
3)For pairs of bands a)Efficiency : two factors contribute to how well components are separated : the widths of the peaks : the wider the peak, the poorer separation. the spacing in time : the further apart, the better separation. How do we describe a chromatogram

19
b)Theoretical plates (N): (from distillation) the more plates on a column, the more equilibration steps, and the better the separation. Number of plates on column : N = 5.55(t r /w ½ ) 2 Plate height : H = L/N The smaller plate height narrower peaks better separation How do we describe a chromatogram
 2 Plate height : H = L/N The smaller plate height narrower peaks better separation How do we describe a chromatogram.")
20
c) Resolution (Rs) How do we describe a chromatogram
 Resolution (Rs) How do we describe a chromatogram")
21
Qualitative: Co-chromatography Detector: –Mass spectrometer –IR, UV-VIS spectrophotometer d) Qualitative & Quantitative analysis How do we describe a chromatogram
 Qualitative & Quantitative analysis How do we describe a chromatogram")
22
Figure illustrates the point that computers and humans may not choose the same baseline for measuring area. P.464 Qualitative and Quantitative Analysis

23
Internal Standards An internal standard is known amount of a compound, different from analyte, that is added to an unknown. To use an internal standard, we prepare a known mixture of standard and analyte and measure the relative response of the detector to the two species. In Figure 5-6, the area under each peak is proportional to the concentration of each compound injected into the column. P.119

24
[X] and [S] are the concentrations of analyte and standard after they have been mixed together. P.119
![[X] and [S] are the concentrations of analyte and standard after they have been mixed together.](http://images.slideplayer.com/21/6282078/slides/slide_24.jpg "P.119.")
25
Example : Using an Internal Standard In a chromatography experiment, a solution containing 0.083 7 M X and 0.066 6 M S gave peak areas of A x =423 and A S =347. To analyze the unknown, 10.0 mL of 0.146 M S were added to 10.0 mL of unknown, and the mixture was diluted to 25.0 mL in a volumetric flask. This mixture gave the chromatogram in Figure 5-6, with peak areas A x =533 and A S =582. Find the concentration of X in the unknown. P.119

26
SOLUTION : P.120 Because X was diluted from 10.0 to 25.0 mL when the mixture with S was prepared, the original concentration of X in the unknown was (25.0/10.0)(0.057 21 M)=0.143 M.
( M)=0.143 M.")
27
Why do bands spread ? 1) Why broadening? a) diffusion b) slow equilibration of solute between the m.p and s.p. c) irregular flow paths.
 diffusion b) slow equilibration of solute between the m.p and s.p. c) irregular flow paths..")
28
Why do bands spread ? 2)Longitudinal diffusion : the faster the flow the less a band spends in column. the less time for diffusion. broadening
Longitudinal diffusion : the faster the flow the less a band spends in column. the less time for diffusion. broadening.")
29
Why do bands spread ? 3)solute requires time to equilibrate between phases. (s.p. m.p.) with temp. broadening u Can’t equilibrate rapidly enough. m.p. s.p.
 with temp. broadening u Can’t equilibrate rapidly enough. m.p. s.p..")
30
Why do bands spread ? Solute requires a finite time to equilibrate between the mobile and stationary phases.

31
P.466 4) A Separation Has an Optimum Flow Rate The rate of mass transfer between phases increases with temperature. Optimum resolution (minimum plate height) occurs at an intermediate flow rate. Curves show measured plate height in gas chromatography of n-C 17 H 36 at 175°C, using N 2, He, or H 2 mobile phase. Why do bands spread ?
 occurs at an intermediate flow rate. Curves show measured plate height in gas chromatography of n-C 17 H 36 at 175°C, using N 2, He, or H 2 mobile phase. Why do bands spread .")
32
5)Multiple paths Band spreading from multiple flow paths. The smaller the stationary-phase particles, the less serious is this problem. This process is absent in an open tubular column.

33
Why do bands spread ? 6) Plate height equation
 Plate height equation")
34
Plate height equation Why do bands spread ?

35
7) open tubular columns Packed column (A, B, C 0 in van Deemter’s eqn.) Open tubular column (A = 0 in van Deemter’s eqn.) resolution ( ∵ H & column length ) sample capacity ( ∵ less s.p.)
 open tubular columns Packed column (A, B, C 0 in van Deemter’s eqn.) Open tubular column (A = 0 in van Deemter’s eqn.) resolution ( ∵ H & column length ) sample capacity ( ∵ less s.p.)")
36
Why do bands spread ? 8) Funny shapes
 Funny shapes")
37
Mass Spectrometry

38
P.470 Mass Spectrometry Mass spectrometry measures the masses and abundances of ions in the gas phase. A Mass Spectrometer Figure next page shows a transmission quadrupole mass spectrometer, which is the most common mass separator in use today. The mass separator consists of four parallel metal rods to which a constant voltage and a radio-frequency oscillating voltage are applied.

39
Transmission quadrupole mass spectrometer. P.470 Figure 21-13

40
Ionization: 1) Electron ionization 2) Chemical ionization Mass Spectrometry
 Electron ionization 2) Chemical ionization Mass Spectrometry")
41
1) Electron ionization M + e - M + + e - + e - 70 eV -55 eV 0.1eV Molecular ion break into fragments. Base peak: most intense peak.

42
2) Chemical ionization CH 4 + e - CH 4 + + 2e - CH 4 + + CH 4 CH 5 + + CH 3 CH 5 + + M CH 4 + MH + CH 4 + CH 3 + + H CH 3 + + CH 4 C 2 H 5 + + H 2
 Chemical ionization CH 4 + e - CH e - CH CH 4 CH CH 3 CH M CH 4 + MH + CH 4 + CH H CH CH 4 C 2 H H 2")
43
Total ion Chromatograms is a reconstructed total ion chromatogram showing all ions from seven opium alkaloids found in street heroin. Selected ion Chromatograms: –Simplify analysis –improve S/N

44
P.473 Information in a Mass Spectrum Nominal Mass : C 4 H 9 Br is 136

45
Information in a mass spectrum Rxn : CH 3 (CH 2 ) 2 CH 2 –OH + Br - CH 3 (CH 2 ) 2 CH 2 –Br 1–Butanol 1–Bromobutane
 2 CH 2 –OH + Br - CH 3 (CH 2 ) 2 CH 2 –Br 1–Butanol 1–Bromobutane")
46
CH 3 15 CH 2 14 Br 79 C 4 H 9 79 Br + 50.0% C 4 H 9 81 Br + Information in a mass spectrum Fragmentation Patterns

47
Information in a mass spectrum Isotope Patterns C n H x O y N z 12 C/ 13 C Intensity = n x 1.1% Ex: C 6 H 6 (M+1)/M + = 6 x 1.1 % Nitrogen Rule: A compound: odd nominal mass / odd number of N atoms; even nominal mass/ even number of N atoms
/M + = 6 x 1.1 % Nitrogen Rule: A compound: odd nominal mass / odd number of N atoms; even nominal mass/ even number of N atoms")
Similar presentations


 Gas Chromatography>")


 Format will be similar to other exams I will.>")


