Download presentation
Presentation is loading. Please wait.

1
Chapter 26 An Introduction to Chromatographic Separations
Chromatography permit the scientist to separate closely related components of complex mixtures. In all chromatographic separations the sample is transported in a mobile phase, which may be a gas, a liquid, or a supercritical fluid. This mobile phase is then forced through an immiscible stationary phase, which is fixed in place in a column or on a solid surface. The two phases are chosen so that the components of the sample distribute themselves between the mobile and stationary phase to varying degrees.

2
Classification of Chromatographic Methods
Chromatographic methods can be categorized in two ways. The first classification is based upon the physical means by which the stationary and mobile phases are brought into contact. In column chromatography, the stationary phase is held in a narrow tube through which the mobile phase is forced under pressure. In planar chromatography, the stationary phase is supported on a flat plate or in the interstices of a paper; here, the mobile phase moves through the stationary phase by capillary action or under the influence of gravity.

3
Classification of Chromatographic Methods
A more fundamental classification of chromatographic methods is one based upon the types of mobile and stationary phases and the kinds of equilibria involved in the transfer of solutes between phases. Three general categories of chromatography: (1) liquid chromatography, (2) gas chromatography, and (3) supercritical-fluid chromatography. The mobile phases in the three techniques are liquids, gases, and supercritical fluids respectively.
 liquid chromatography, (2) gas chromatography, and (3) supercritical-fluid chromatography. The mobile phases in the three techniques are liquids, gases, and supercritical fluids respectively.")
5
Elution Chromatography on Columns
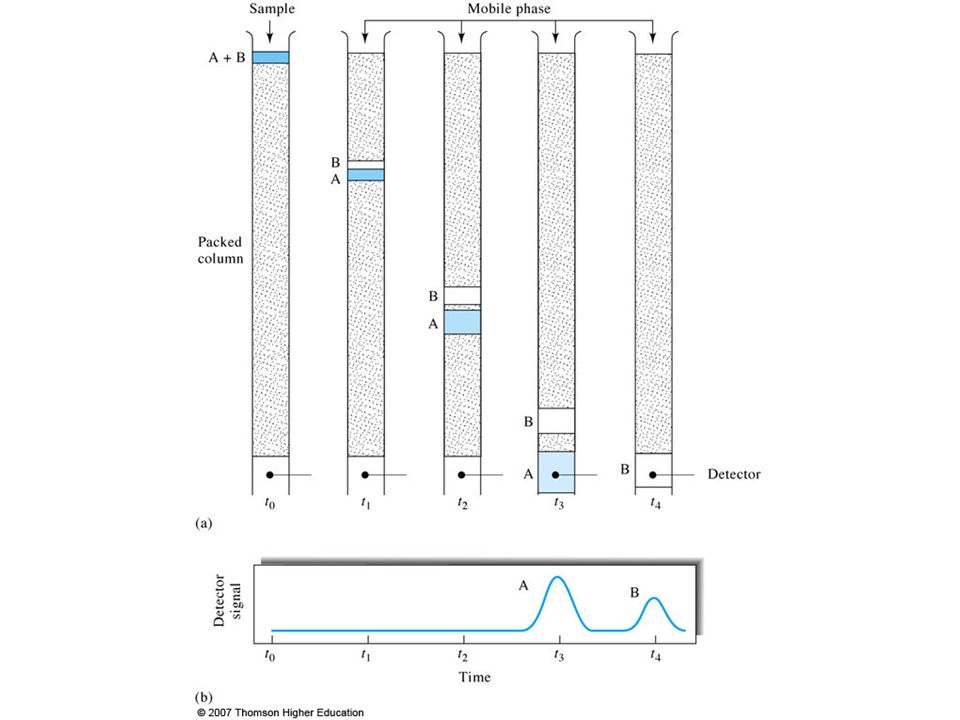
Elution involves washing a species through a column by continuous addition of fresh solvent. The sample is introduced at the head of a column, whereupon the components of the sample distribute themselves between the two phases. Introduction of additional mobile phase (the eluent) forces the solvent containing a part of the sample down the column, where further partition between the mobile phase and fresh portions of the stationary phase occurs.
 forces the solvent containing a part of the sample down the column, where further partition between the mobile phase and fresh portions of the stationary phase occurs.")
7
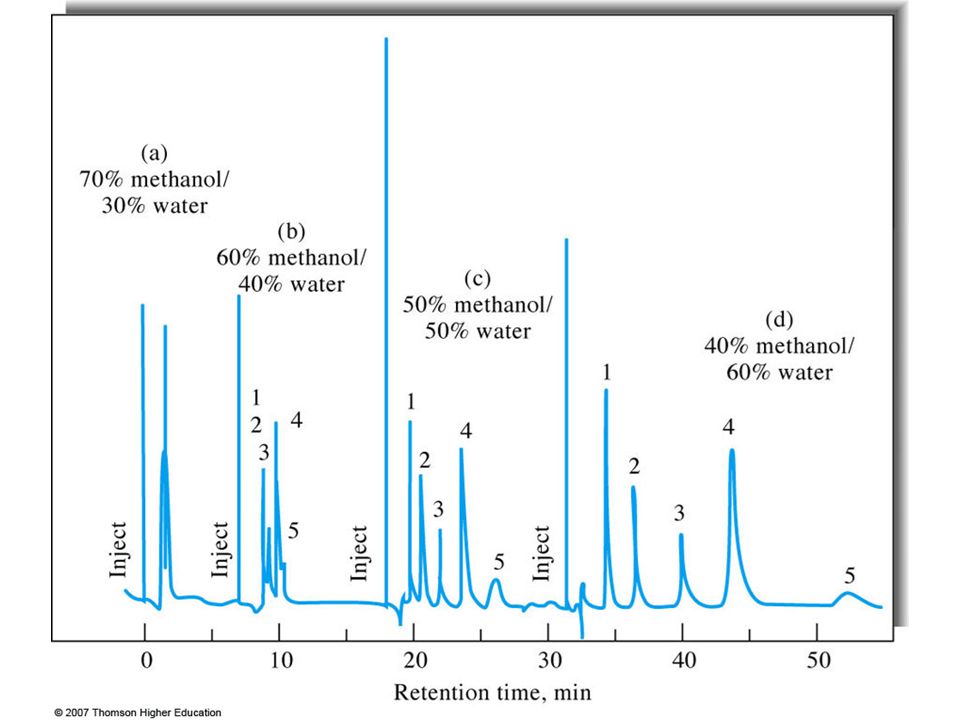
Chromatograms If a detector that responds to solute concentration is placed at the end of the column and its signal is plotted as function of time (or of volume of the added mobile phase), a series of peaks is obtained. Such a plot, called a chromatogram, is useful for both qualitative and quantitative analysis. The positions of peaks on the time axis may serve to identify the components of the sample; the areas under the peaks provide a quantitative measure of the amount of each component.
, a series of peaks is obtained. Such a plot, called a chromatogram, is useful for both qualitative and quantitative analysis. The positions of peaks on the time axis may serve to identify the components of the sample; the areas under the peaks provide a quantitative measure of the amount of each component.")
9
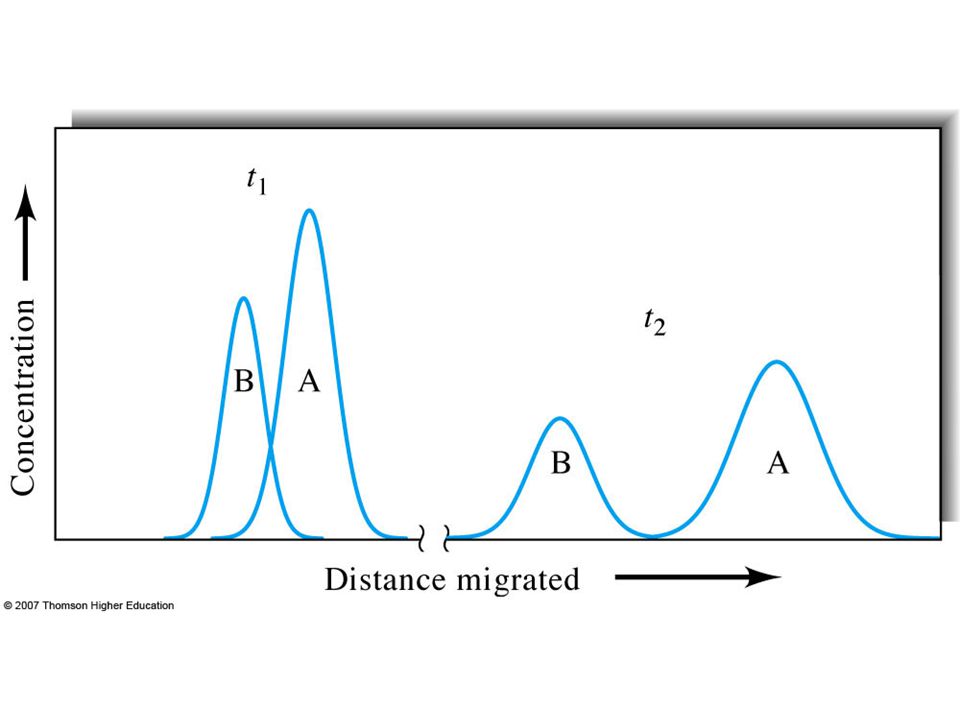
MIGRATION RATES OF SOLUTES
The effectiveness of a chromatographic column in separating two solutes depends in part upon the relative rates at which the two species are eluted. These rates are determined by the magnitude of the equilibrium constants for the reactions by which the solutes distribute themselves between the mobile and stationary phases.

11
Distribution Constants
The distribution equilibria involved in chromatography involve the transfer of an analyte between the mobile and stationary phases. Amobile Astationary The equilibrium constant K for this reaction is called the distribution constant, the partition ratio, or the partition coefficient, K = cS/cM where cs is the molar concentration of the solute in the stationary phase and cM is its molar concentration in the mobile phase. K is constant over a wide range of solute concentrations.

12
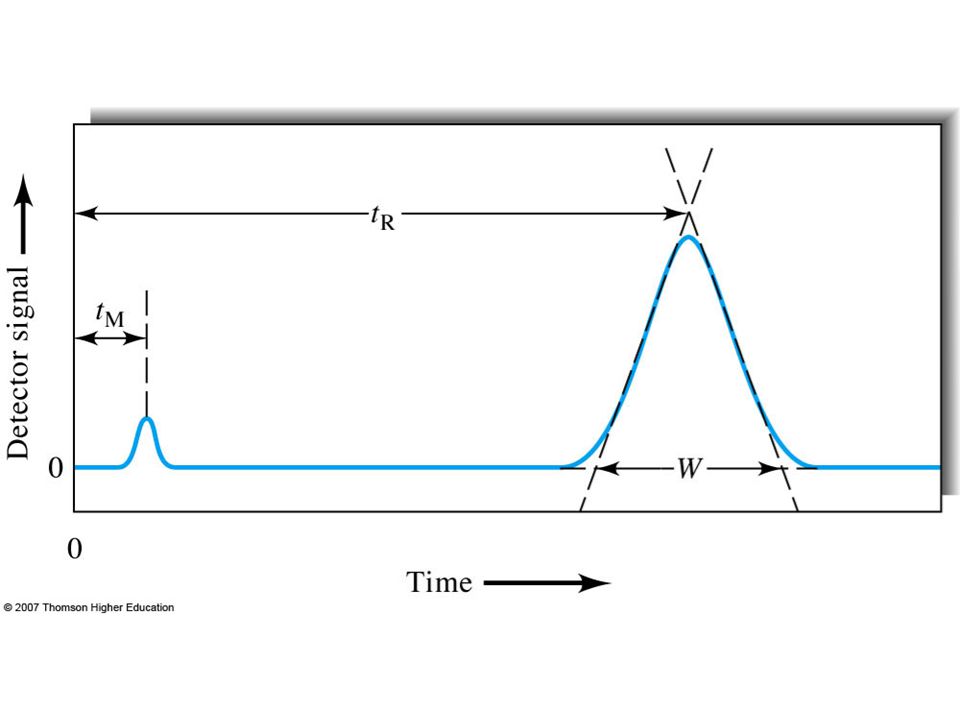
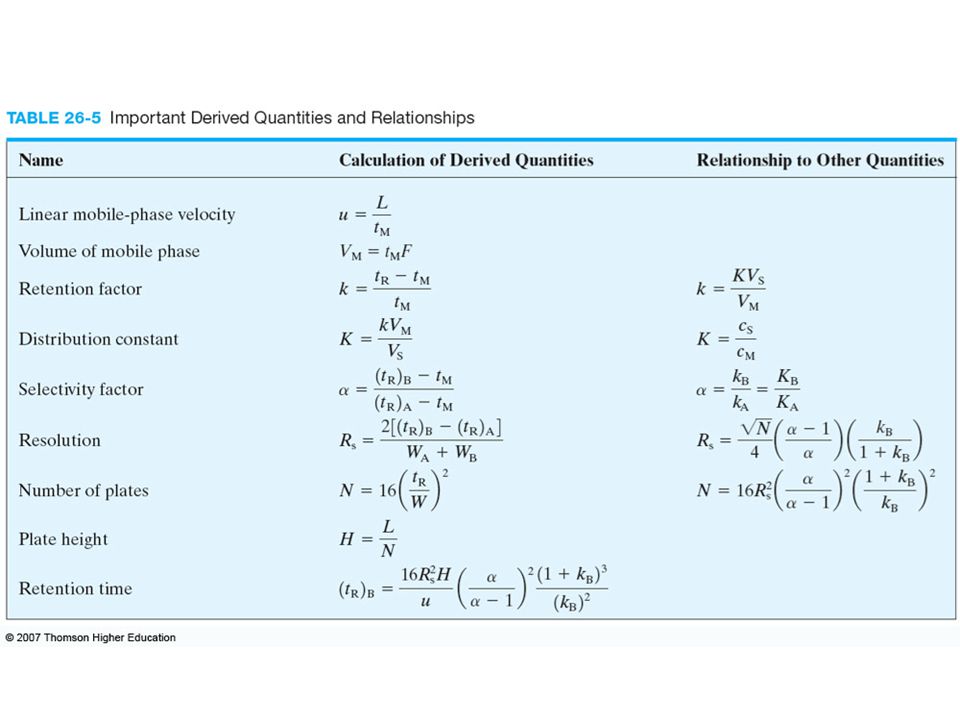
Retention Time The time it takes after sample injection for the analyte peak to reach the detector is called the retention time and is given the symbol tR. The time tM for the unretained species to reach the detector is called the dead time. The rate of migration of the unretained species is the same as the average rate of motion of the mobile phase molecules. The average linear rate of solute migration is = L/tR where, L is the length of the column packing. The average linear rate of movement u of the molecules of the mobile phase is u = L/tM Where tM, the dead time.

14
The Rate of Solute Migration: The Retention Factor
The retention factor, or capacity factor, is an important parameter that is widely used to describe the migration rates of solutes on columns. For a solute A, the retention factor k`A is defined as k`A = KAVS/VM where KA is the distribution constant for the species A. k`A = (tR - tM )/tM tR and tM are readily obtained from a chromatogram. When the retention factor for a solute is much less than unity, elution occurs so rapidly that accurate determination of the retention times is difficult. When the retention factor is larger than perhaps 20 to 30, elution times become inordinately long. Ideally, separations are performed under conditions in which the retention factors for the solutes in a mixture lie in the range between 2 and 10.
/tM. tR and tM are readily obtained from a chromatogram. When the retention factor for a solute is much less than unity, elution occurs so rapidly that accurate determination of the retention times is difficult. When the retention factor is larger than perhaps 20 to 30, elution times become inordinately long. Ideally, separations are performed under conditions in which the retention factors for the solutes in a mixture lie in the range between 2 and 10.")
15
Relative Migration Rates: The selectivity Factor
The selectivity factor of a column for the two species A and B is defined as = KB/KA where KB is the distribution constant for species B and KA is the distribution constant for species A. is always greater than unity. A relationship between the selectivity factor and retention factors: = k`B/k`A Where k`B and k`A are the retention factors. An expression for the determination of from an experimental chromatogram:

20
Methods for Describing Column Efficiency
Two related terms are widely used as quantitative measures of chromatographic column efficiency: (1) plate height H and (2) plate count plates N. The two are related by the equation N = L/H where L is the length (usually in centimeters) of the column packing. The efficiency of chromatographic columns increases as the plate count becomes greater and as the plate height becomes smaller.
 plate height H and (2) plate count plates N. The two are related by the equation. N = L/H. where L is the length (usually in centimeters) of the column packing. The efficiency of chromatographic columns increases as the plate count becomes greater and as the plate height becomes smaller.")
21
Methods for Describing Column Efficiency
A chromatographic column is made up of numerous discrete but contiguous narrow layers called theoretical plates. At each plate, equilibration of the solute between the mobile and stationary phase was assumed to take place. Movement of the solute down the column was then treated as a stepwise transfer of equilibrated mobile phase from one plate to the next.

22
Plate Height The plate height H is given by H = 2/L L carries units of centimeters and 2 units of centimeters squared; thus H represents linear distance in centimeters. The plate height can be thought of as the length of column that contains a fraction of analyte that lies between L- and L. Because the area under a normal error curve bounded by is about 68% of the total area, the plate height, as defined, contains approximately 34 % of the analyte.

23
The Experimental Evaluation H and N
N can be calculated from two time measurements tR and W; to obtain H, the length of the column packing L must also be known. Another method for approximating N, is to determine W1/2, the width of peak at half its maximum height. The plate count is then given by N = 5.54(tR/ W1/2)2 The plate count N and the plate height H are widely used in the literature and by instrument manufactures as measures of column performance.
2. The plate count N and the plate height H are widely used in the literature and by instrument manufactures as measures of column performance.")
24
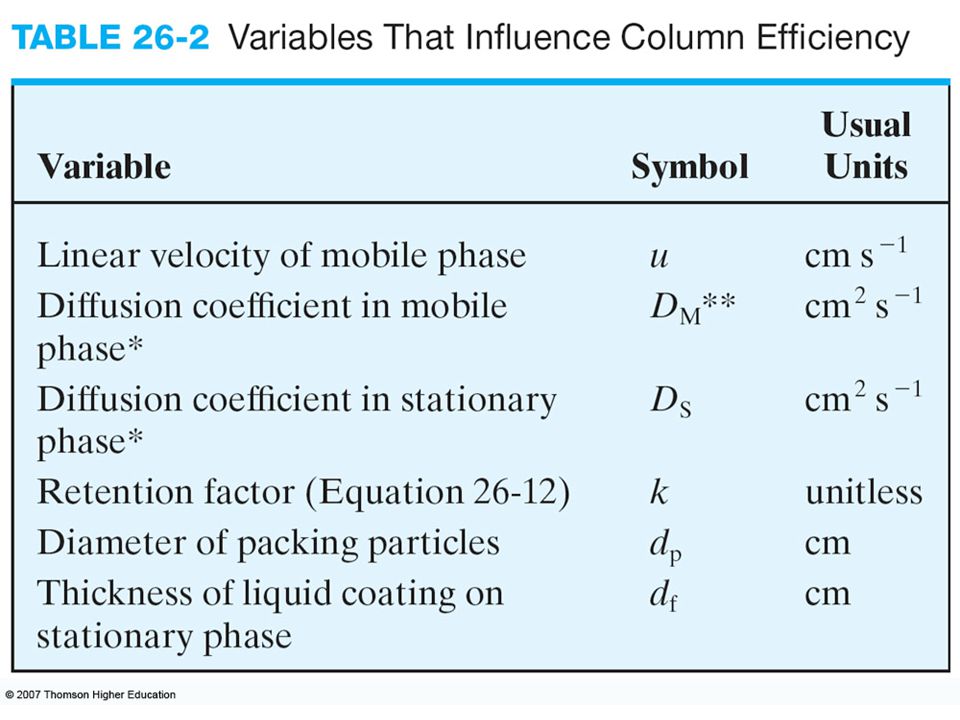
The Effect of Mobile-Phase Flow Rate
The magnitude of kinetic effects on column efficiency depends upon the length of time the mobile phase is in contact with the stationary phase, which in turn depends upon the flow rate of the mobile phase. Efficiency studies have generally been carried out by determining H as a function of mobile-phase velocity u.

25
Relationship between Plate Height
and Column Variables The van Deemter equation can be written in the form H = A + B/u + Cu = A + B/u + (Cs + CM)u where H is the plate height in centimeters, u is the linear velocity of the mobile phase in centimeters per second, and the quantities A, B, and C are coefficients related to the phenomena of multiple flow paths, longitudinal diffusion, and mass transfer between phases, respectively. The C coefficient can be broken into two coefficients, one related to the stationary phase (Cs) and one related to the mobile phase (CM). The van Deemter equation contains terms linearly and inversely proportional to, as well as independent of, the mobile phase velocity.
u. where H is the plate height in centimeters, u is the linear velocity of the mobile phase in centimeters per second, and the quantities A, B, and C are coefficients related to the phenomena of multiple flow paths, longitudinal diffusion, and mass transfer between phases, respectively. The C coefficient can be broken into two coefficients, one related to the stationary phase (Cs) and one related to the mobile phase (CM). The van Deemter equation contains terms linearly and inversely proportional to, as well as independent of, the mobile phase velocity.")
27
The Multipath Term(A) Zone broadening arises in part from the multitude of pathways by which a molecule (or ion) can find its way through a packed column. The length of these pathways may differ significantly; thus, the residence time in the column for molecules of the same species is also variable. Solute molecules then reach the end of the column over a time interval, which leads to a broadened band. This effect which is called eddy diffusion, is directly proportional to the diameter of the particles making up the column packing.
 can find its way through a packed column. The length of these pathways may differ significantly; thus, the residence time in the column for molecules of the same species is also variable. Solute molecules then reach the end of the column over a time interval, which leads to a broadened band. This effect which is called eddy diffusion, is directly proportional to the diameter of the particles making up the column packing.")
28
The Longitudinal Diffusion Term (B/u)
Longitudinal diffusion in column chromatography is a band broadening process in which solutes diffuse from the concentrated center of a zone to the more dilute regions ahead of and behind the zone center. The longitudinal diffusion term is directly proportional to the mobile-phase diffusion coefficient DM. The contribution of longitudinal diffusion is seen to be inversely proportional to the mobile phase velocity.

29
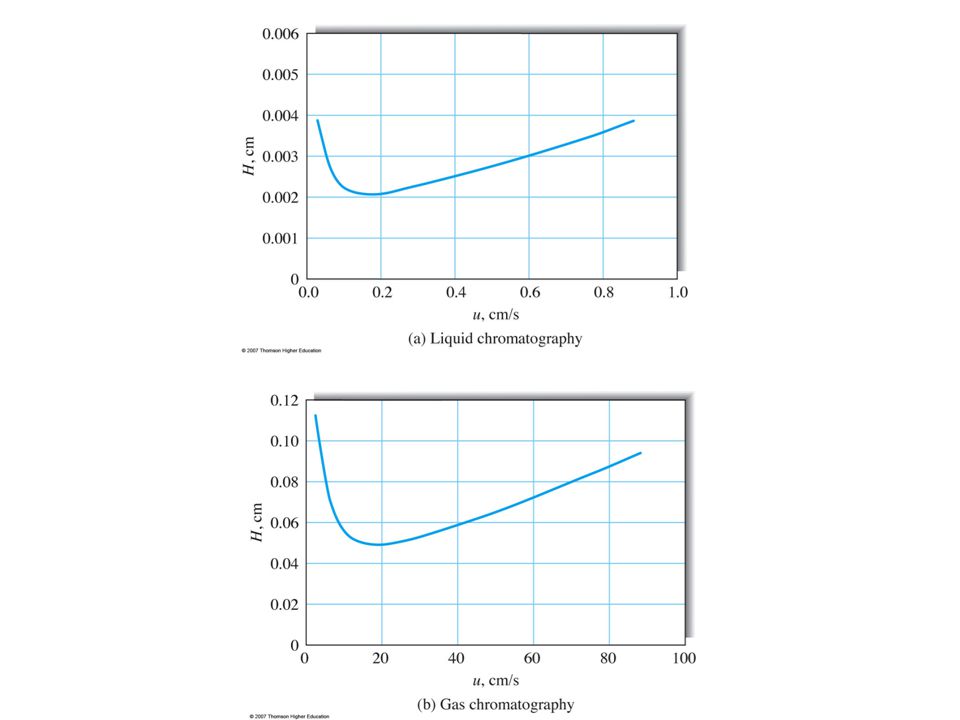
Effect of Mobile-Phase Velocity
Mass-transfer Coefficients (Cs and CM) The need for the two mass-transfer coefficients Cs and CM arises because the equilibrium between the mobile and the stationary phase is established so slowly that a chromatographic column always operates under nonequilibrium conditions. Effect of Mobile-Phase Velocity Fig provides the quality of the fit of the van Deemter equation. The upper curve was obtained from a numerical fit of the van Deemter equation to the data. The lower plots in the figure also show the contribution of the longitudinal diffusion, and the masstransfer effects.
 The need for the two mass-transfer coefficients Cs and CM arises because the equilibrium between the mobile and the stationary phase is established so slowly that a chromatographic column always operates under nonequilibrium conditions. Effect of Mobile-Phase Velocity. Fig provides the quality of the fit of the van Deemter equation. The upper curve was obtained from a numerical fit of the van Deemter equation to the data. The lower plots in the figure also show the contribution of the longitudinal diffusion, and the masstransfer effects.")
31
Methods for Reducing Zone Broadening
Two important controllable variables that affect column efficiency are the diameter of the particles making up the packing and the diameter of the column. To take advantage of the effect of column diameter, narrower and narrower columns have been used in recent years. With gaseous mobile phases, the rate of longitudinal diffusion can be reduced appreciable by lowering the temperature and thus the diffusion coefficient DM. The consequence is significantly smaller plate heights at low temperatures.

32
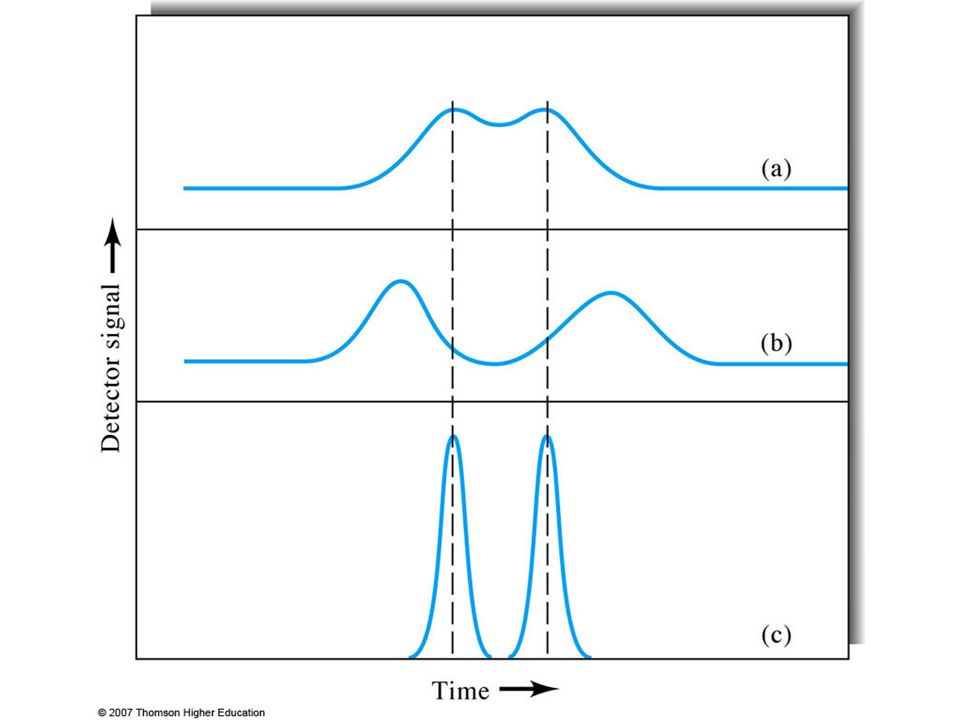
Column Resolution The resolution Rs of a column provides a quantitative measure of its ability to separate two analytes. Column resolution is defines as It is evident from Fig that a resolution of 1.5 gives an essentially complete separation of the two components, whereas a resolution of 0.75 does not. At a resolution of 1.0, zone A contains about 4% B and zone B contains a similar amount of A. At a resolution for 1.5, the overlap is about 0.3% . The resolution for a given stationary phase can be improved by lengthening the column, thus increasing the number of plates.

34
The Effect of Retention and Selectivity Factors on Resolution
Relationship between the resolution of a column and the retention factors k`A and k`B for two solutes, the selectivity factor , and the number of plates 2 2 2 Where k’ is the average of k’A and k’B

39
APPLICATIONS OF CHROMATOGRAPHY
Chromatography has grown to be the premiere method for separating closely related chemical species. In addition, it can be employed for qualitative identification and quantitative determination of separated species.

40
Qualitative Analysis A chromatogram provides only a single piece of qualitative information about each species in a sample, namely, its retention time or its position on the stationary phase after a certain elution period. It is a widely used tool for recognizing the presence or absence of components of mixtures containing a limited number of possible species whose identities are known. Positive spectroscopic identification would be impossible without a preliminary chromatographic separation on a complex sample.

41
Quantitative Analysis
Chromatography can provide useful quantitative information about the separated species. Quantitative column chromatography is based upon a comparison of either the height or the area of the analyte peak with that of one or more standards. For planar chromatography, the area covered by the separated species serves as the analytical parameter. If conditions are properly controlled, these parameters vary linearly with concentration.

42
Analyses Based on Peak Height
The height of a chromatographic peak is obtained by connecting the base lines on either side of the peak by a straight line and measuring he perpendicular distance from this line to the peak. This measurement can ordinarily be made with reasonably high precision. Accurate results are obtained with peak heights only if variations in column conditions do not alter the peak widths during he period required to obtain chromatograms for sample and standards. The variables that must be controlled closely are column temperature, eluent flow rate, and rate of sample infection.

43
Analyses Based on Peak Areas
Peak areas are a more satisfactory analytical variable than peak heights. On the other hand, peak heights are more easily measured and, for narrow peaks, more accurately determined. Most modern chromatographic instruments are equipped with digital electronic integrators that permit precise estimation of peak areas. If such equipment is not available, manual estimate must be made. A simple method, which works well for symmetric peaks of reasonable widths, is to multiply the height of the peak by its width at one half the peak height.

44
Calibration and Standards
The most straightforward method for quantitative chromatographic analyses involves the preparation of a series of standard solutions that approximate the composition of the unknown. Chromatograms for the standards are then obtained and peak heights or areas are plotted as a function of concentration. A plot of the data should yield a straight line passing through the origin.

45
The Internal Standard Method
The highest precision for quantitative chromatography is obtained by use of internal standards because the uncertainties introduced by sample injection are avoided. In this procedure, a carefully measured quantity of an internal standard substance is introduced into each standard and sample, and the ratio of analyte to internal standard peak areas (or heights) serves as the analytical parameter. For this method to be successful, it is necessary that the internal standard peak be well separated from the peaks of all other components of the sample.
 serves as the analytical parameter. For this method to be successful, it is necessary that the internal standard peak be well separated from the peaks of all other components of the sample.")
Similar presentations


 Format will be similar to other exams I will.>")


