Download presentation
Presentation is loading. Please wait.

1
Future of the Big Darby Watershed Steven Gordon December, 2001

2
Where are we going? Current status of stream health How development trends will impact it Preserving the quality – What do we need to do? – How can we get there?

3
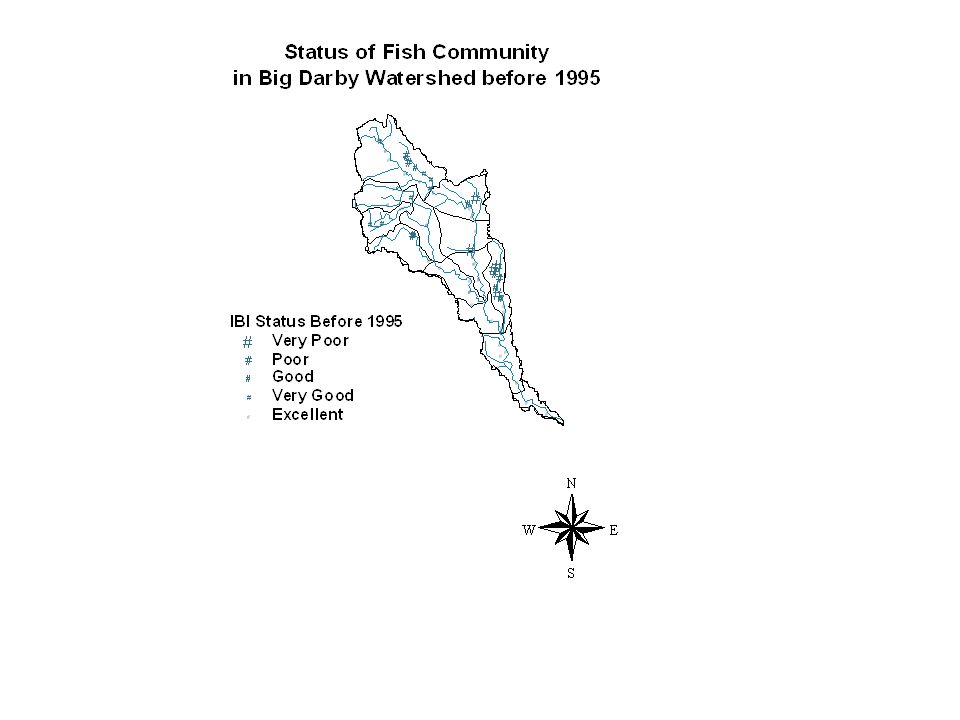
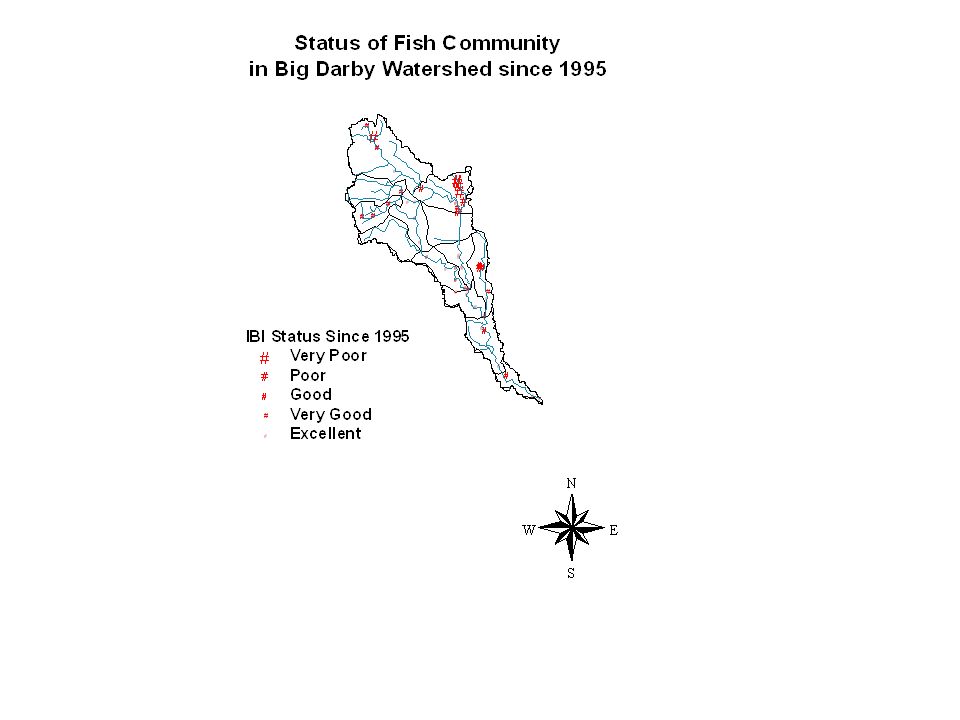
The Good News The Big Darby is still a very high quality stream Data show continued good health in most areas We have an opportunity to keep it that way

7
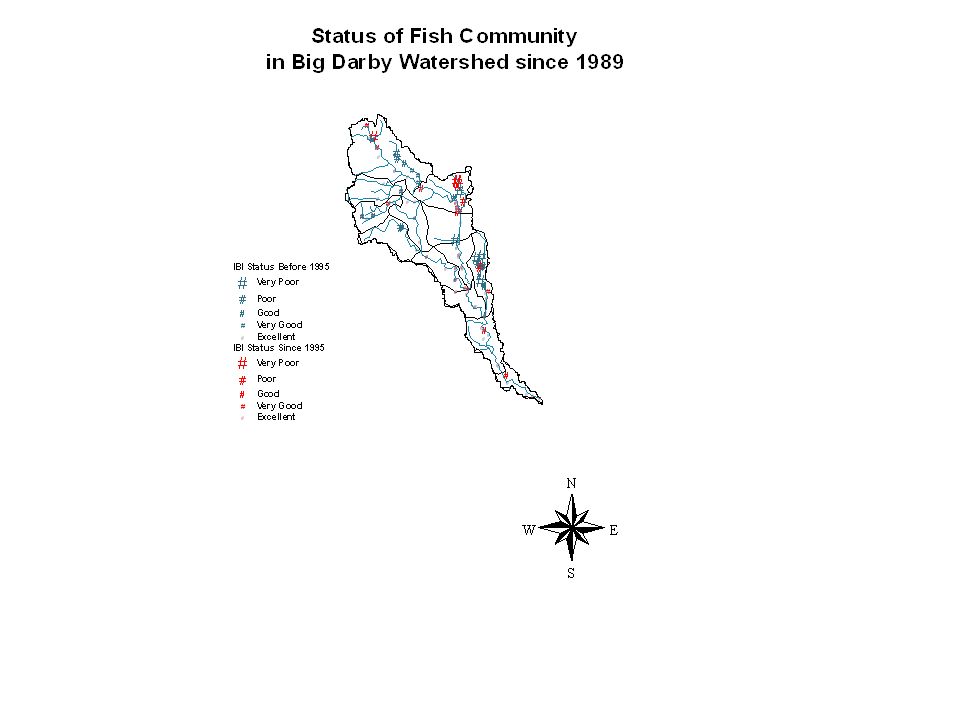
Impacts of Trends Noticed that there are several problem areas where deterioration of quality has occurred What is this related to? How might it change in the future?

8
Model of IBI in ECBP Eastern Cornbelt Plains Ecoregion

9
Major Differences Among Watersheds Differences in habitat quality – Measured by components of QHEI (Qualitative Habitat Evaluation Index) – Reflect changes in riparian zone quality Differences in point source pollution Differences in land use/non-point source pollution – Urban land use a key
 – Reflect changes in riparian zone quality Differences in point source pollution Differences in land use/non-point source pollution – Urban land use a key")
10
Web-Based Tools Http://tycho.cfm.ohio-state.edu How does this fit with current trends? – Analysis done by my students last Spring – Study sponsored by the Darby Creek Association Urban growth in the basin is substantial A reasonable forecast shows major additional growth

12
Growth Rate Assumptions Growth rate (not absolute number of persons) was held constant with the following assumptions: – Extremely high growth rate areas would ‘fill up’ with people and growth will decline – Areas adjacent to high growth regions will have an increased rate of growth – No growth controls are in place in order to restrict development anywhere in the watershed
 was held constant with the following assumptions: – Extremely high growth rate areas would ‘fill up’ with people and growth will decline – Areas adjacent to high growth regions will have an increased rate of growth – No growth controls are in place in order to restrict development anywhere in the watershed")
13
Rates of Population Change Population Change – Forecasting model based on population rates of change from 1990 to 2000 – Rates of change varied from -31% to 211%, but most between -2% and 40%

14
Growth Rate Assumptions Rates of change that were significantly high (80% to 211%) were halved because of high growth and only moderate projected county growth by the ODOD Tracts within Counties with high anticipated growth were increased (12.5% to 25% based on ODOD data) depending on adjacency to historically high growth tracts
 were halved because of high growth and only moderate projected county growth by the ODOD Tracts within Counties with high anticipated growth were increased (12.5% to 25% based on ODOD data) depending on adjacency to historically high growth tracts")
15
Results

16
Results Continued

17
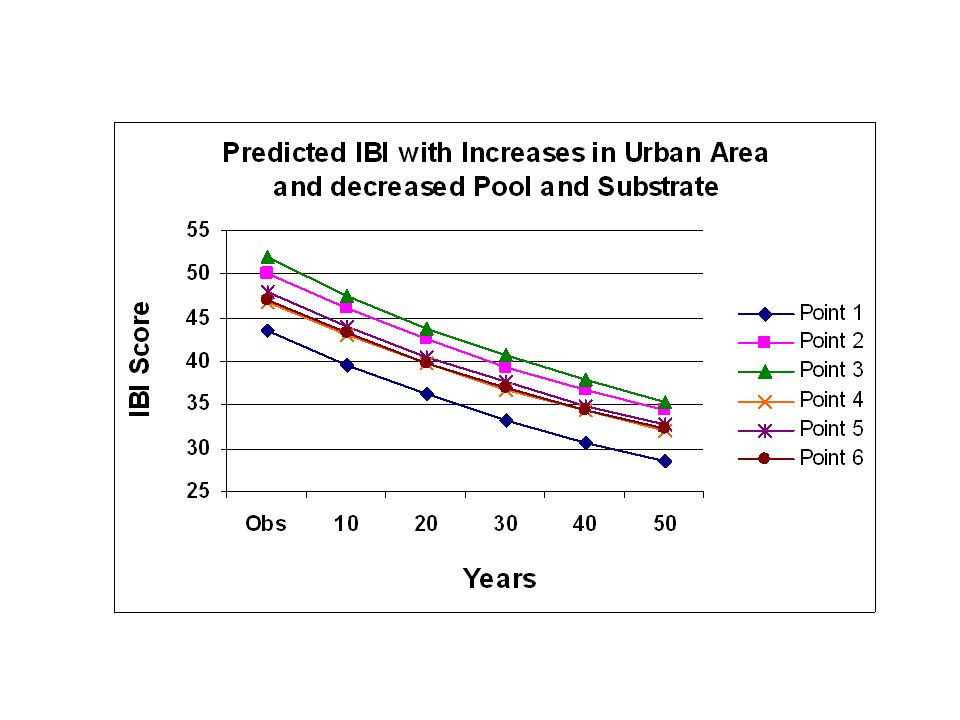
Comparison with Model Model forecast about a 25% growth with lower base Population forecast pushes rates to 50% for some tracts Will accelerate deterioration in growth areas Probably have a time-scale of 10-15 years unless something changes

18
What needs to be done? Action by all communities – From cities to townships to counties – From farmers to residents to developers A combination of approaches – Protect and improve the riparian zone – Best management practices for all uses for all areas – Reduction in total growth

19
Consequences of Inaction Continuing decline of stream quality – Loss of communities – Increased flooding Loss of prime farmland – Loss of agricultural communities/mix – Loss of open space Increases in congestion and other urban problems

20
Possible Actions Riparian zone protection BMP controls in zoning and subdivision Strict enforcement Conservation easements or other land banking techniques

21
How do we get there?

Similar presentations


>")


