Download presentation
Presentation is loading. Please wait.

1
Copyright © 2009 Pearson Prentice Hall. All rights reserved. 5-1 How do risk and term structure affect interest rates? Yesterday, we examined interest rates, but made a big assumption – there is only one economy-wide interest rate. Of course, that isn’t really the case. Today, we will examine the different rates that we observe for financial products.

2
How do risk and term structure affect interest rates? Understanding why interest rates differ from bond to bond can help businesses and private investors decide which bonds to purchase as investments and which ones to sell Copyright © 2009 Pearson Prentice Hall. All rights reserved. 5-2

3
Copyright © 2009 Pearson Prentice Hall. All rights reserved. 5-3 How do risk and term structure affect interest rates? We will first examine why bonds with the same term to maturity have different interest rates. The price differences are due to the risk structure of interest rates. We will examine in detail what this risk structure looks like and ways to examine it.

4
Copyright © 2009 Pearson Prentice Hall. All rights reserved. 5-4 How do risk and term structure affect interest rates? Next, we will look at the different rates required on bonds with different maturities. That is, we typically observe higher rates on longer-term bonds. This is known as the term structure of interest rates.

5
Copyright © 2009 Pearson Prentice Hall. All rights reserved. 5-5 Risk Structure of Interest Rates To start this discussion, we first examine the yields for several categories of long- term bonds over the last 85 years. You should note several aspects regarding these rates, related to different bond categories and how this has changed through time.

6
Copyright © 2009 Pearson Prentice Hall. All rights reserved. 5-6 Risk Structure of Long Bonds in the U.S.

7
Copyright © 2009 Pearson Prentice Hall. All rights reserved. 5-7 Risk Structure of Long Bonds in the U.S. The figure show two important features of the interest-rate behavior of bonds. Rates on different bond categories change from one year to the next. Spreads on different bond categories change from one year to the next (The spread between the interest rate on Baa corporate bonds and U.S. government bonds is very large during the Great Depression)
.")
8
Copyright © 2009 Pearson Prentice Hall. All rights reserved. 5-8 Factors Affecting Risk Structure of Interest Rates To further examine these features, we will look at three specific risk factors. Default Risk Liquidity Income Tax Considerations

9
Copyright © 2009 Pearson Prentice Hall. All rights reserved. 5-9 Default Risk Factor One attribute of a bond that influences its interest rate is its risk of default, which occurs when the issuer of the bond is unable or unwilling to make interest payments when promised. U.S. Treasury bonds have usually been considered to have no default risk because the federal government can always increase taxes to pay off its obligations (or just print money). Bonds like these with no default risk are called default-free bonds.
. Bonds like these with no default risk are called default-free bonds..")
10
Copyright © 2009 Pearson Prentice Hall. All rights reserved. 5-10 Default Risk Factor (cont.) The spread between the interest rates on bonds with default risk and default-free bonds, called the risk premium, indicates how much additional interest people must earn in order to be willing to hold that risky bond. A bond with default risk will always have a positive risk premium, and an increase in its default risk will raise the risk premium.
 The spread between the interest rates on bonds with default risk and default-free bonds, called the risk premium, indicates how much additional interest people must earn in order to be willing to hold that risky bond. A bond with default risk will always have a positive risk premium, and an increase in its default risk will raise the risk premium..")
11
Exercise Consider a $1,000 par-bond paying a 20% annual coupon (maturity date: year 2). The issuing company has 20% chance of defaulting this year; in which case, the bond would not pay anything. If the company survives the first year, paying the annual coupon payment, it then has a 10% chance of defaulting in the second year. If the company defaults in the second year, neither the final coupon payment nor par value of the bond will be paid. Copyright © 2009 Pearson Prentice Hall. All rights reserved. 5-11

12
Copyright © 2009 Pearson Prentice Hall. All rights reserved. 5-12 Increase in Default Risk on Corporate Bonds

13
Copyright © 2009 Pearson Prentice Hall. All rights reserved. 5-13 Analysis of Figure 5.2: Increase in Default on Corporate Bonds Corporate Bond Market 1.R e on corporate bonds , D c , D c shifts left 2.Risk of corporate bonds , D c , D c shifts left 3.P c , i c Treasury Bond Market 4.Relative R e on Treasury bonds , D T , D T shifts right 5.Relative risk of Treasury bonds , D T , D T shifts right 6.P T , i T Outcome – Risk premium, i c - i T, rises

14
Copyright © 2009 Pearson Prentice Hall. All rights reserved. 5-14 Default Risk Factor (cont.) Default risk is an important component of the size of the risk premium. Because of this, bond investors would like to know as much as possible about the default probability of a bond. One way to do this is to use the measures provided by credit-rating agencies: Moody’s and S&P are examples.
 Default risk is an important component of the size of the risk premium. Because of this, bond investors would like to know as much as possible about the default probability of a bond. One way to do this is to use the measures provided by credit-rating agencies: Moody’s and S&P are examples..")
15
Copyright © 2009 Pearson Prentice Hall. All rights reserved. 5-15 Bond Ratings

16
Copyright © 2009 Pearson Prentice Hall. All rights reserved. 5-16 Liquidity Factor Another attribute of a bond that influences its interest rate is its liquidity; a liquid asset is one that can be quickly and cheaply converted into cash if the need arises. The more liquid an asset is, the more desirable it is (higher demand), holding everything else constant. Let’s examine what happens if a corporate bond becomes less liquid (Figure 1 again).
, holding everything else constant. Let’s examine what happens if a corporate bond becomes less liquid (Figure 1 again)..")
17
Copyright © 2009 Pearson Prentice Hall. All rights reserved. 5-17 Decrease in Liquidity of Corporate Bonds Figure 5.2 Response to a Decrease in the Liquidity of Corporate Bonds

18
Copyright © 2009 Pearson Prentice Hall. All rights reserved. 5-18 Analysis of Figure 5.1: Corporate Bond Becomes Less Liquid Corporate Bond Market 1.Liquidity of corporate bonds , D c , D c shifts left 2.P c , i c Treasury Bond Market 1.Relatively more liquid Treasury bonds, D T , D T shifts right 2.P T , i T Outcome – Risk premium, i c - i T, rises Risk premium reflects not only corporate bonds' default risk but also lower liquidity

19
Copyright © 2009 Pearson Prentice Hall. All rights reserved. 5-19 Liquidity Factor (cont.) The differences between interest rates on corporate bonds and Treasury bonds (that is, the risk premiums) reflect not only the corporate bond’s default risk but its liquidity too. This is why a risk premium is sometimes called a risk and liquidity premium.
 The differences between interest rates on corporate bonds and Treasury bonds (that is, the risk premiums) reflect not only the corporate bond’s default risk but its liquidity too. This is why a risk premium is sometimes called a risk and liquidity premium..")
20
Copyright © 2009 Pearson Prentice Hall. All rights reserved. 5-20 Income Taxes Factor Another attribute of a bond that influences its interest rate is its tax charge. For the investor it is important to measure the after-tax expected return.

21
Copyright © 2009 Pearson Prentice Hall. All rights reserved. 5-21 Tax Advantages of Municipal Bonds

22
Copyright © 2009 Pearson Prentice Hall. All rights reserved. 5-22 Analysis of Figure 5.3: Tax Advantages of Municipal Bonds Municipal Bond Market 1.Tax exemption raises relative R e on municipal bonds, D m , D m shifts right 2.P m Treasury Bond Market 1.Relative R e on Treasury bonds , D T , D T shifts left 2.P T Outcome i m < i T

23
Exercise What is the yield on a $1,000,000 municipal bond with a coupon rate of 8%, paying interest annually, versus the yield of a $1,000,000 corporate bond with a coupon rate of 10% paying interest annually? Assume that you are in the 25% tax bracket Copyright © 2009 Pearson Prentice Hall. All rights reserved. 5-23

24
Sol Municipal bond coupon payments equal $80,000 per year. No taxes are deducted; therefore, the yield would equal 8%. The coupon payments on a corporate bond equal $100,000 per year. But you only keep $75,000 because you are in the 25% tax bracket. Therefore your after-tax yield is only 7.5% Copyright © 2009 Pearson Prentice Hall. All rights reserved. 5-24

25
Copyright © 2009 Pearson Prentice Hall. All rights reserved. 5-25 Case: Bush Tax Cut and Interest Rates The 2001 tax cut called for a reduction in the top tax bracket, from 39% to 35% over a 10-year period. This reduces the advantage of municipal debt (interest payments on municipal bonds are exempt from federal income taxes) over T-securities since the interest on T-securities is now taxed at a lower rate.
 over T-securities since the interest on T-securities is now taxed at a lower rate..")
26
Copyright © 2009 Pearson Prentice Hall. All rights reserved. 5-26 Term Structure of Interest Rates Now that we understand risk, liquidity, and taxes, we turn to another important influence on interest rates – maturity. Bonds with different maturities tend to have different required rates, all else equal.

27
Term Structure of Interest Rates A plot of the yields on bonds with differing terms to maturity but the same risk, liquidity, and tax considerations is called a yield curve It describes the term structure of interest rates for particular types of bonds, such as government bonds Copyright © 2009 Pearson Prentice Hall. All rights reserved. 5-27

28
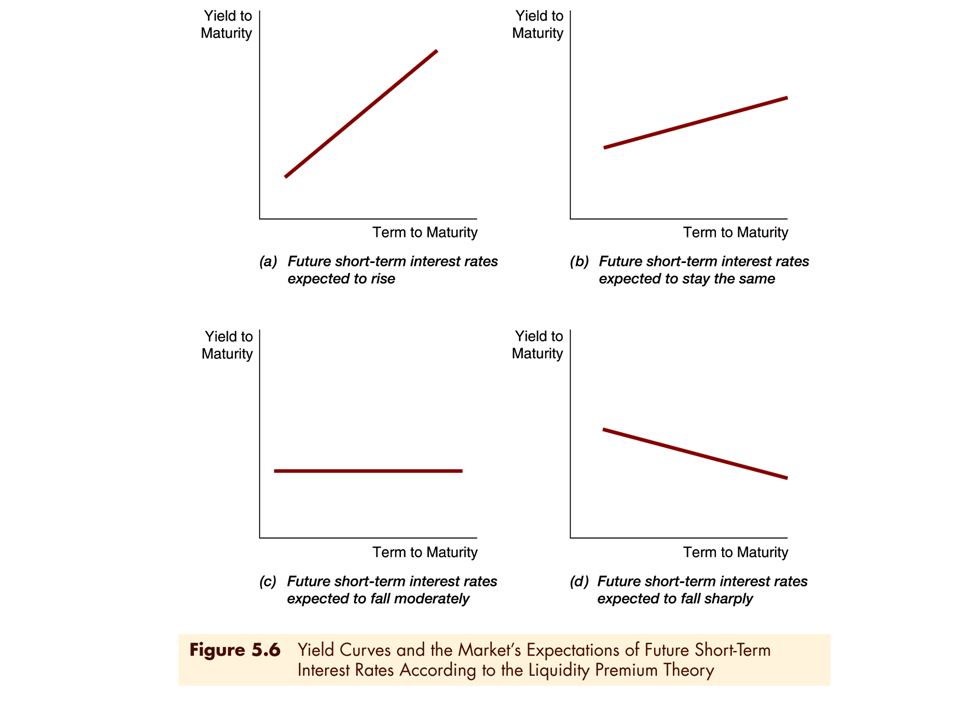
Copyright © 2009 Pearson Prentice Hall. All rights reserved. 5-28 The WSJ: Following the News For example, the WSJ publishes a plot of the yield curve (rates at different maturities) for Treasury securities. Yield curves can be classified as upward- sloping, flat, and downward-sloping (inverted yield curve) When yield curves slope upward, the most usual case, the long-term interest rates are above the short-term interest rates.
 for Treasury securities. Yield curves can be classified as upward- sloping, flat, and downward-sloping (inverted yield curve) When yield curves slope upward, the most usual case, the long-term interest rates are above the short-term interest rates..")
30
Copyright © 2009 Pearson Prentice Hall. All rights reserved. 5-30 Case: Interpreting Yield Curves The picture on the next slide illustrates several yield curves that we have observed for U.S. Treasury securities in recent years.

31
Copyright © 2009 Pearson Prentice Hall. All rights reserved. 5-31 Case: Interpreting Yield Curves, 1980– 2008

32
Copyright © 2009 Pearson Prentice Hall. All rights reserved. 5-32 Chapter Summary Risk Structure of Interest Rates: We examined the key components of risk in debt: default, liquidity, and taxes. Term Structure of Interest Rates: We examined the various shapes the yield curve can take, theories to explain this, and predictions of future interest rates based on the theories.

Similar presentations