Download presentation
Presentation is loading. Please wait.

1
ELEG 479 Lecture #12 Magnetic Resonance (MR) Imaging
Mark Mirotznik, Ph.D. Associate Professor The University of Delaware

2
Physics of Magnetic Resonance Summary
Protons and electrons have a property called spin that results in them looking like tiny magnets. S N In the absence of an external magnetic field all the magnetic dipole are oriented randomly so we get zero net magnetic field when we add them all up. Random Orientation = No Net Magnetization

3
Physics of Magnetic Resonance Summary
When we add a large external magnetic field we can get the protons to line up in 1 of 2 orientations (spin up or spin down) with a few more per million in one of the orientations than the other. This produces a net magnetization along the axis of the applied magnetic field. When we add a large external magnetic field we cause a torque on the already spinning proton that causes it to precess like a top around the applied magnetic field. The frequency is precesses , called its Larmor frequency., is determined from Larmor’s equation.
 with a few more per million in one of the orientations than the other. This produces a net magnetization along the axis of the applied magnetic field. When we add a large external magnetic field we cause a torque on the already spinning proton that causes it to precess like a top around the applied magnetic field. The frequency is precesses , called its Larmor frequency., is determined from Larmor’s equation.")
4
Physics of Magnetic Resonance Summary from Last Lecture
The net magnetization vector is the sum of all of these little magnetic moments added together. This is what we measure. x y z x y z x y z z z x y x y Net Magnetization Vector

5
Physics of Magnetic Resonance Summary from Last Lecture
However since all the spinning protons are precessing out of phase with each other this results in zero net magnetization in the transverse plane. = 0 This is bad news since is where are signal comes from! Somehow we need to get these guys spinning together!

6
Physics of Magnetic Resonance Summary from Last Lecture
To get them to all spin together we add a RF field whose frequency is the same as the Larmor resonant frequency of the proton and is oriented in the xy or transverse plane. B1 RF Excitation time B1

7
Physics of Magnetic Resonance Summary from Last Lecture
x y z B1 a a B1Dt Time of Application of RF Pulse Tip Angle Amplitude of RF Pulse

8
Physics of Magnetic Resonance Summary from Last Lecture
x y z a = envelope of the RF signal In general

9
Physics of Magnetic Resonance Summary from Last Lecture
To get the signal out we place a coil near the sample. A time-varying transverse magnetic field will produce a voltage on the coil that can be digitized and stored for processing. recall and

10
Relaxation Processes

11
Physics of Magnetic Resonance Relaxation
After the RF field is removed over time the spin system will return back to it’s equilibrium state due to several relaxation processes.

12
Physics of Magnetic Resonance Relaxation
After the RF field is removed over time the spin system will return back to it’s equilibrium state due to several relaxation processes. These are: Spin-Spin relaxation (also called the T2 relaxation): Due to random processes in which neighboring proton spins effect each other spin system will lose coherence and Mxy will decay. This is an irreversible process. Spin-Lattice relaxation (also called T1 relaxation): Due to another random process the Mz will begin to recover back to it’s original equilibrium state. Also irreversible. T2* relaxation: Due to inhomogenities in the external Bo field Mxy will decay much faster than T2. This is a reversible process.
: Due to random processes in which neighboring proton spins effect each other spin system will lose coherence and Mxy will decay. This is an irreversible process. Spin-Lattice relaxation (also called T1 relaxation): Due to another random process the Mz will begin to recover back to it’s original equilibrium state. Also irreversible. T2* relaxation: Due to inhomogenities in the external Bo field Mxy will decay much faster than T2. This is a reversible process.")
13
T1 Relaxation

14
T2 Relaxation (FID)
")
15
T2 Decay RF RF

16
T2* Relaxation

17
T2* Decay: Dephasing due to field inhomogeneity
z' y' Mxy = 0 x' T2* relaxation is dephasing of transverse magnetization too but it turns out to be reversible

18
Animation of T2* Dephasing

19
Spin- Echo

21
Spin Echo

22
Summary of Relaxation Processes

23
MRI Image An MRI image is determined by two things
three intrinsic properties of the tissue. These are: T1, T2 and Pd. (two relaxation time constants and the density of protons) the details of the external magnetic fields (Bo, B1 and the gradient magnetics (have not talked about these yet)). How they are configured and how we turn them on and off (pulse sequence) effects what the image looks like. By varying the pulse sequence we can control which of the intrinsic properties to emphasize in the image.
 the details of the external magnetic fields (Bo, B1 and the gradient magnetics (have not talked about these yet)). How they are configured and how we turn them on and off (pulse sequence) effects what the image looks like. By varying the pulse sequence we can control which of the intrinsic properties to emphasize in the image.")
25
Tissue Contrast

29
TR TE TE 0.5TE 0.5TE 0.5TE 0.5TE 180 degree RF pulses 90 degree
White matter T1=813 ms T2=101 ms

30
TR TE TE CASE I: TR>>T1 , TE<T2 What do we measure?
180 degree RF pulses CASE I: TR>>T1 , TE<T2 What do we measure? 90 degree RF pulses TE TE White matter T1=813 ms T2=101 ms

31
CASE I: TR>>T1 , TE<T2
Short TE means that the signal has not decayed much due to T2relaxation. Long TR means that by the next pulse the system is back at equilibrium (Mz due to T1 relaxation has fully recovered) So what are we measuring? TR 180 degree RF pulses 90 degree RF pulses TE TE White matter T1=813 ms T2=101 ms
 So what are we measuring TR. 180 degree. RF pulses. 90 degree. RF pulses. TE. TE. White matter. T1=813 ms. T2=101 ms.")
32
CASE I: TR>>T1 , TE<T2
Short TE means that the signal has not decayed much due to T2relaxation. Long TR means that by the next pulse the system is back at equilibrium (Mz due to T1 relaxation has fully recovered) So what are we measuring? PD Weighted imaging! TR 180 degree RF pulses 90 degree RF pulses TE TE White matter T1=813 ms T2=101 ms
 So what are we measuring PD Weighted imaging! TR. 180 degree. RF pulses. 90 degree. RF pulses. TE. TE. White matter. T1=813 ms. T2=101 ms.")
33
CASE II: TR>>T1 , TE~T2
180 degree RF pulses CASE II: TR>>T1 , TE~T2 90 degree RF pulses TE TE White matter T1=813 ms T2=101 ms

34
CASE II: TR>>T1 , TE~T2
TE on the order of T2means that the signal is proportional to the T2relaxation constant. Long TR means that by the next pulse the system is back at equilibrium (Mz due to T1 relaxation has fully recovered) So what are we measuring? 180 degree RF pulses 90 degree RF pulses TE TE White matter T1=813 ms T2=101 ms
 So what are we measuring 180 degree. RF pulses. 90 degree. RF pulses. TE. TE. White matter. T1=813 ms. T2=101 ms.")
35
CASE II: TR>>T1 , TE~T2
TE on the order of T2means that the signal is proportional to the T2relaxation constant. Long TR means that by the next pulse the system is back at equilibrium (Mz due to T1 relaxation has fully recovered) So what are we measuring? T2 Weighted imaging! TR 180 degree RF pulses 90 degree RF pulses TE TE White matter T1=813 ms T2=101 ms
 So what are we measuring T2 Weighted imaging! TR. 180 degree. RF pulses. 90 degree. RF pulses. TE. TE. White matter. T1=813 ms. T2=101 ms.")
36
TR TE CASE III: TR~T1 , TE<T2 What do we measure? 180 degree
RF pulses 90 degree RF pulses TE

37
TR TE CASE III: TR~T1 , TE<T2
TE is shorter than T2means that the signal is not heavily weighted on the T2relaxation constant. TR on the order of T1 means that by the next pulse the system is not back at equilibrium (Mz due to T1 relaxation has not fully recovered) So what are we measuring? TR 180 degree RF pulses 90 degree RF pulses TE
 So what are we measuring TR. 180 degree. RF pulses. 90 degree. RF pulses. TE.")
38
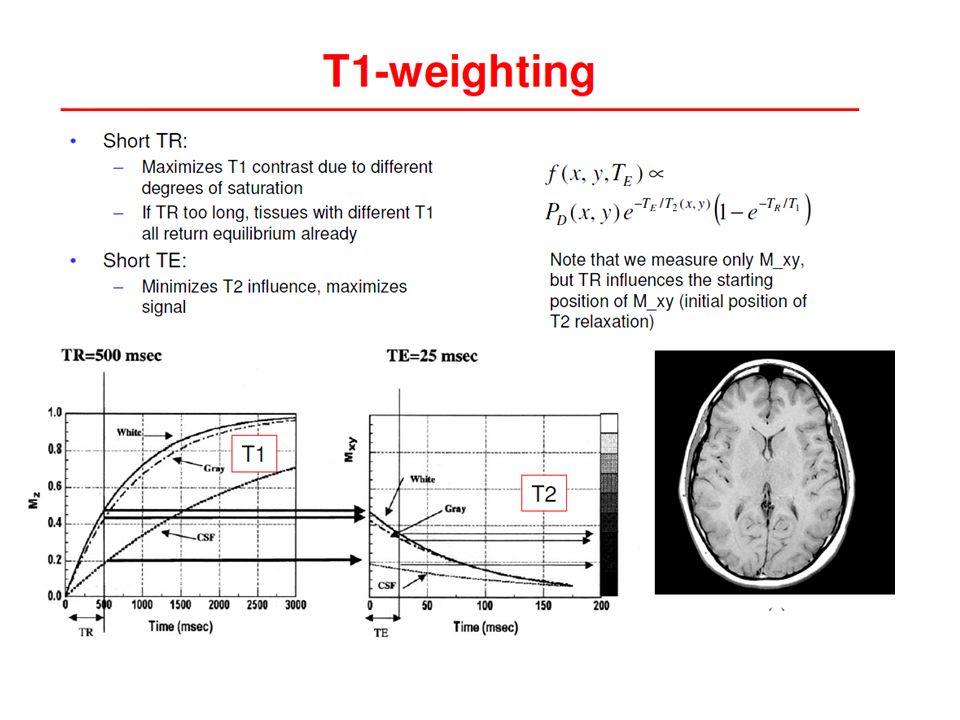
TR TE T1 Weighted imaging! CASE III: TR~T1 , TE<T2
TE is shorter than T2means that the signal is not heavily weighted on the T2relaxation constant. TR on the order of T1 means that by the next pulse the system is not back at equilibrium (Mz due to T1 relaxation has not fully recovered) So what are we measuring? T1 Weighted imaging! TR 180 degree RF pulses 90 degree RF pulses TE
 So what are we measuring T1 Weighted imaging! TR. 180 degree. RF pulses. 90 degree. RF pulses. TE.")
39
Tissue Contrast Summary TE TR PD weighted T1weighted T2 weighted
TE<T2 (short TE) TR>>T1 (long TR) T1weighted TR~T1 (short TR) T2 weighted TE~T2 (long TE)
 TR>>T1 (long TR) T1weighted. TR~T1 (short TR) T2 weighted. TE~T2 (long TE)")
40
Bloch Equations

41
Full Bloch equation including relaxation
precession, RF excitation transverse magnetization longitudinal magnetization includes Bo and B1

42
Example: Solve for the transverse components of M after a 90 degree pulse.

43
Example: Solve for the transverse components of M after a 90 degree pulse.
After 90 degree pulse the RF field is shut down and only Bo is non-zero

44
Example: Solve for the transverse components of M after a 90 degree pulse.
After 90 degree pulse the RF field is shut down and only Bo is non-zero Initial conditions for 90 degree pulse:

45
Example: Solve for the transverse components of M after a 90 degree pulse.
After 90 degree pulse the RF field is shut down and only Bo is non-zero Solutions

46
Example: Solve for the transverse components of M after a 90 degree pulse.
After 90 degree pulse the RF field is shut down and only Bo is non-zero Solutions

47
Example: Solve for the transverse components of M after an arbitrary flip angle (a)
After an arbitrary RF pulse the RF field is shut down and only Bo is non-zero

48
Example: Solve for the transverse components of M after an arbitrary flip angle (a)
After an arbitrary RF pulse the RF field is shut down and only Bo is non-zero Initial conditions for 90 degree pulse:

49
Example: Solve for the transverse components of M after an arbitrary flip angle (a)
Solutions

50
Solve full Bloch equation with only B=Bo
Solution for transverse components Mx and My Where a is the flip angle after RF excitation

51
Signal Detection

52
Signal Detection via RF coil

53
Signal Detection via RF coil
Transverse magnetization at t=0. Coils oriented as shown above will only respond to changes in the transverse magnetic field (this is what we want) Assuming the magnetic fields are homogenous the signal will be a weighted integration of all the protons within the coil. The waiting will be based on the total magnetization at location x,y,z at the start of the pulse (Mxy(x,y,z,0)) and the tissue decay time T2(x,y,z) This is not an image!!
 Assuming the magnetic fields are homogenous the signal will be a weighted integration of all the protons within the coil. The waiting will be based on the total magnetization at location x,y,z at the start of the pulse (Mxy(x,y,z,0)) and the tissue decay time T2(x,y,z) This is not an image!!")
54
Signal Detection via RF coil
After demodulation:

55
Creating an Image

56
Creating an Image To create an image using NMR we need to figure out a way to encode the proton spins spatially in three dimensions. But how?

57
Frequency and Phase Are Our Friends in MR Imaging
w q = wt The spatial information of the proton pools contributing MR signal is determined by the spatial frequency and phase of their magnetization.

58
Gradient Coils X gradient Y gradient Z gradient x y z Gradient coils generate spatially varying magnetic field so that spins at different location precess at frequencies unique to their location, allowing us to reconstruct 2D or 3D images.

59
Gradient Coils Purpose: Spatially alter magnitude of B0 (not direction) Sounds generated during imaging due to mechanical stress within gradient coils.

61
Vector Notation

62
Larmor frequency within a gradient field

64
Slice Selection

65
Slice Selection Gradient
BG Coil 1 Coil 2

66
Helmholtz Coils

68
Z-Gradient Fields By adding a z-gradient field we cause a variation in the resonant frequency from head to toe.

69
Example A sample is put inside a 1.5T magnet. A z-gradient of 3 gauss/cm is applied. If we wish to image a 2 ft in length section of a person what is the range of resonant frequencies we will encounter?

70
Example A sample is put inside a 1.5T magnet. A z-gradient of
3 gauss/cm is applied. If we wish to image a 2 ft in length section of a person what is the range of resonant frequencies we will encounter?

71
Example A sample is put inside a 1.5T magnet. A z-gradient of
3 gauss/cm is applied. If we wish to image a 2 ft in length section of a person what is the range of resonant frequencies we will encounter?

72
A Field Gradient Makes the Larmor Frequency Depend upon Position
B0 63,480,000 Hz 64,260,000 Hz Z Gradient in Z B(Z) = B + G * Z o Z = n(z) g B(z)
 = B. + G. * Z. o. Z. = n(z) g. B(z)")
73
Slice Selection (-) 62 MHz 63 MHz 64 MHz G 65 MHz 66 MHz (+)
 62 MHz 63 MHz 64 MHz G 65 MHz 66 MHz (+)")
74
How do we determine the slice width and center?
Slice Selection How do we determine the slice width and center? z After z selection gradient and excitation z-gradient Bo (slice center) (slice width) x
 (slice width) x.")
75
Determining slice thickness
Resonance frequency range as the result of slice-selective gradient:

76
Changing slice thickness
There are two ways to do this: Change the slope of the slice selection gradient Change the bandwidth of the RF excitation pulse Both are used in practice, with (a) being more popular
 being more popular.")
77
Example Suppose we wish to have a slice thickness of 2 mm and we are using a z-gradient of 1.0 G/cm ? What range of RF frequencies should we use?

78
Example Suppose we wish to have a slice thickness of 2 mm and we are using a z-gradient of 1 G/cm ? What range of RF frequencies should we use?

79
Selecting different slices

80
Selecting different slices
In theory, there are two ways to select different slices: Change the position of the zero point of the slice selection gradient with respect to isocenter (b) Change the center frequency of the RF to correspond to a resonance frequency at the desired slice Option (b) is usually used as it is not easy to change the isocenter of a given gradient coil.
 Change the center frequency of the RF to correspond. to a resonance frequency at the desired slice. Option (b) is usually used as it is not easy to change the. isocenter of a given gradient coil.")
82
RF Excitation (RF Pulse)
Fo FT t Fo Fo+1/ t Time Frequency Fo Fo FT DF= 1/ t t

83
RF Excitation (RF Pulse)
Fo FT A Dn t n1 n2

84
RF Excitation: Flip angle
Fo FT A Dn t n1 n2 Envelope of the pulse

85
RF Excitation: Flip angle
Fo FT A Dn t n1 n2

86
RF Excitation: Flip angle
Fo FT A Dn t n1 n2

88
RF Excitation: Flip angle (truncated sinc)
")
90
A potential problem Wait a minute! Dr. M I remember you telling us that if the magnetic field varied from place to place (inhomogeneous) then we would get rapid dephasing of spins. Since some spins are spinning faster than others they quickly get out of phase. That was the whole reason behind the spin echo stuff! Won’t that happen again?
 then we would get rapid dephasing of spins. Since some spins are spinning faster than others they quickly get out of phase. That was the whole reason behind the spin echo stuff! Won’t that happen again")
91
Why yes it will! It is called gradient dephasing Good question!
Wait a minute! Dr. M I remember you telling us that if the magnetic field varied from place to place (inhomogeneous) then we would get rapid dephasing of spins. Since some spins are spinning faster than others they quickly get out of phase. That was the whole reason behind the spin echo stuff! Won’t that happen again? Spinning slow Spinning fast Why yes it will! It is called gradient dephasing Good question!
 then we would get rapid dephasing of spins. Since some spins are spinning faster than others they quickly get out of phase. That was the whole reason behind the spin echo stuff! Won’t that happen again Spinning slow. Spinning fast. Why yes it will! It is called gradient dephasing. Good question!")
93
Any ideas on how to get around this?
Why yes it will! It is called gradient dephasing. It will quickly kill our signal much faster than T2 or even T2* Spinning slow Spinning fast Any ideas on how to get around this?

96
Localization in xy plane

98
Lets Start with a Simple Flat Person
(only xz plane) z Bo x
 z. Bo. x.")
99
Lets Start with a Simple Flat Person
(only xz plane) z After z selection gradient and excitation z-gradient Bo x
 z. After z selection. gradient and excitation. z-gradient. Bo. x.")
100
Lets Start with a Simple Flat Person
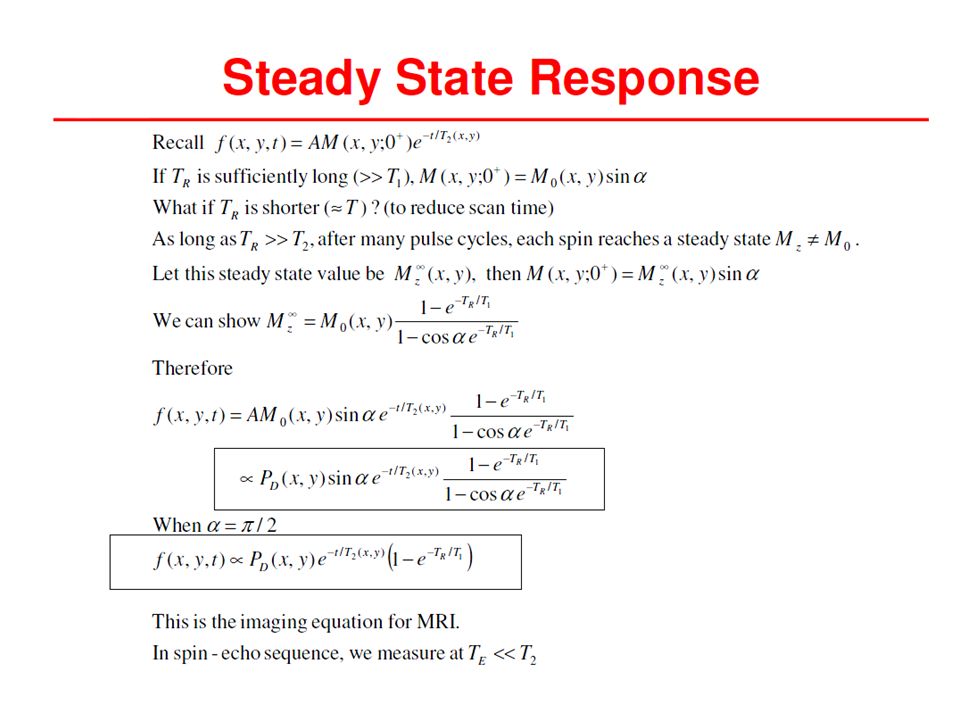
Frequency Encoding Mathematical Analysis Recall that the signal we measure is given by: Now we have selected only a single slice in z (z=zo) and we have no y dependence (flat person) After demodulation (envelope detection)
 and we have no y dependence (flat person) After demodulation (envelope detection)")
101
Lets Start with a Simple Flat Person
Frequency Encoding Mathematical Analysis After demodulation (envelope detection) Let This is what we want to image (called the effective proton density)
 Let. This is what we want to image (called the effective proton density)")
102
Lets Start with a Simple Flat Person
(frequency encoding using x-gradient) z After z selection gradient and excitation Bo x
 z. After z selection. gradient and excitation. Bo. x.")
103
Lets Start with a Simple Flat Person
Frequency Encoding Mathematical Analysis Now lets apply a gradient in the x direction (Gx) After demodulation (envelope detection) What does this look like?
 After demodulation (envelope detection) What does this look like")
104
Lets Start with a Simple Flat Person
Frequency Encoding Mathematical Analysis After demodulation (envelope detection) Let The received signal is related to the Fourier transform (THIS IS THE KEY!)
 Let. The received signal is related to the Fourier transform (THIS IS THE KEY!)")
105
Lets Start with a Simple Flat Person
Frequency Encoding Mathematical Analysis After demodulation (envelope detection) Let We can now find our image as a function of x by taking an inverse Fourier Transform
 Let. We can now find our image as a function of x by taking an inverse Fourier Transform.")
106
A Simple Example of Spatial Encoding with Frequency Encoding
Constant Magnetic Field Varying Magnetic Field w/o encoding w/ encoding

107
A Simple Example of Spatial Encoding with Frequency Encoding
Decomposition

108
Decays faster than T2*

109
Extend this to a full 3D person

110
Extend this to a full 3D person
After slice selection we need to image in xy plane y x

111
Spatial Encoding in xy plane Frequency Encoding Mathematical Analysis
Now lets apply a gradient in the x direction (Gx) After demodulation (envelope detection) Effective proton density
 After demodulation (envelope detection) Effective proton density.")
112
Spatial Encoding in xy plane Frequency Encoding Mathematical Analysis
After demodulation (envelope detection) Let
 Let.")
113
Spatial Encoding in xy plane Frequency Encoding Mathematical Analysis
Let Corresponds to a single line or trajectory in the uv plane

114
Spatial Encoding in xy plane Frequency Encoding Mathematical Analysis
Now lets apply gradients in both the x direction (Gx) and y direction (Gy) After demodulation (envelope detection) Let Effective proton density
 and y direction (Gy) After demodulation (envelope detection) Let. Effective proton density.")
115
Spatial Encoding in xy plane Frequency Encoding Mathematical Analysis
Now lets apply gradients in both the x direction (Gx) and y direction (Gy) Let
 and y direction (Gy) Let.")
116
Spatial Encoding in xy plane Frequency Encoding Mathematical Analysis
Let Polar Scanning

119
Gradient Echo (A brief detour)
")
120
Ts/2

121
Spatial Encoding in xy plane Gradient Echo Mathematical Analysis
Spins will dephase very quickly (quicker than T2*) due to the gradient fields. After negative x-gradient
 due to the gradient fields. After negative x-gradient.")
122
Spatial Encoding in xy plane Gradient Echo Mathematical Analysis
After negative x-gradient Now impose positive x-gradient for Ts

123
Spatial Encoding in xy plane Gradient Echo Mathematical Analysis
Now impose positive x-gradient for Ts

124
Phase Encoding

128
Pulse Repetition

140
Image Contrast

147
Image Quality

148
Field of View and Resolution in MRI
Fourier Plane Spatial Domain Du Dx Dv Vcoverage FOVy Dy Ucoverage FOVx

149
Nyquist Sampling Theorem: Review
Assume we have a continuous signal with maximum frequency of fmax To avoid aliasing we must sample the signal at a sampling frequency of fs>=2 fmax The sampling interval T=1/ fs fmax<=1/(2T)
")
150
Sampling in MRI Slice selection direction: sampling in z-direction
Slice thickness (Dz) controlled by RF excitation bandwidth (Dn) To avoid aliasing Where fmax,z is the highest spatial frequency in along the z-axis
 controlled by RF excitation bandwidth (Dn) To avoid aliasing. Where fmax,z is the highest spatial frequency in along the z-axis.")
151
Sampling in MRI Within each slice: sampling in xy plan
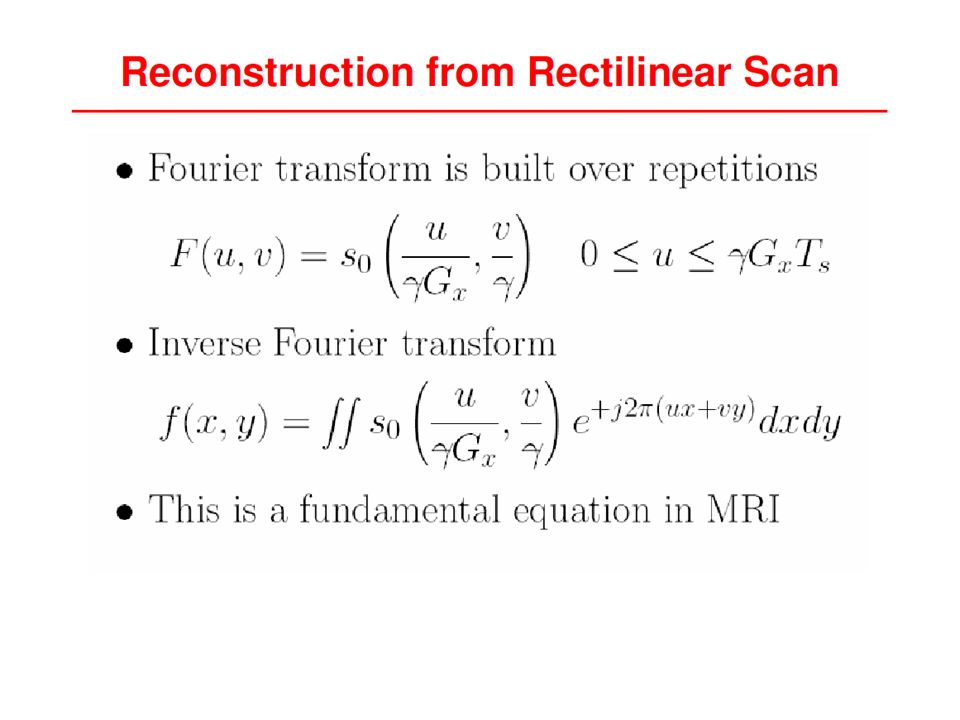
We sample in the Fourier domain (u,v) (called k-space in MRI literature, kx=u, ky=v) Rectilinear Scan Du depends on sampling interval T during readout (ADC) Du depends on sampling interval during this time
 (called k-space in MRI literature, kx=u, ky=v) Rectilinear Scan. Du depends on sampling interval T during readout (ADC) Du depends on sampling interval during this time.")
152
Sampling in MRI Within each slice: sampling in xy plan
We sample in the Fourier domain (u,v) (called k-space in MRI literature, kx=u, ky=v) Rectilinear Scan Dv depends on spacing between phase encoding Dv depends on the integrated phase shift here
 (called k-space in MRI literature, kx=u, ky=v) Rectilinear Scan. Dv depends on spacing between phase encoding. Dv depends on the integrated phase shift here.")
153
Sampling in MRI Within each slice: sampling in xy plan
We sample in the Fourier domain (u,v) (called k-space in MRI literature, kx=u, ky=v) Polar Scan Angle scan depends on steps in Gy/Gx Angle scan depends on steps in Gy/Gx
 (called k-space in MRI literature, kx=u, ky=v) Polar Scan. Angle scan depends on steps in Gy/Gx. Angle scan depends on steps in Gy/Gx.")
154
Sampling in MRI Within each slice: sampling in xy plan
We sample in the Fourier domain (u,v) (called k-space in MRI literature, kx=u, ky=v) Polar Scan Rho spacing depends on sampling interval T during readout r spacing depends on sampling interval during this time
 (called k-space in MRI literature, kx=u, ky=v) Polar Scan. Rho spacing depends on sampling interval T during readout. r spacing depends on sampling interval during this time.")
155
Dv

157
X-gradient relates dimension x with Larmor freq n by
To avoid aliasing only frequency given below are measured

158
X-gradient relates dimension x with Larmor freq n by
To avoid aliasing only frequency given below are measured Field of view in the x-direction (FOVx) is thus given by
 is thus given by.")
159
Dependant on the phase encoding gradient Gy
Dependant on the phase encoding gradient Gy. The amount of phase change is given by Field of view in y

160
While FOV is limited by the sampling interval in the UV plane (Fourier plane) the resolution is limited by the total extent of the UV plane being sampled. If we ignore high spatial frequency content we will have lower resolution (blur our image). Since MRI scans cover only a finite area of the Fourier space we can expect a finite resolution. Fourier space coverage in MRI

161
Fourier space coverage in MRI
Outside of this range we assume the contributions to be zero. This is equivalent to passing the actual image through a low-pass filter in the uv plane whose transfer function is given by In the spatial domain this is then given by the point spread function (PSF)
")
162
In the spatial domain this is then given by the PSF
The full width half max (FWHM) resolution is given by the width of the sinc function’s main lobe Increasing the U,V (coverage area in Fourier space) reduces blurring.
 resolution is given by the width of the sinc function’s main lobe. Increasing the U,V (coverage area in Fourier space) reduces blurring.")
164
Field of View and Resolution in MRI
Spatial Domain Fourier Plane Du Dx Dv Vcoverage FOVy Dy Ucoverage FOVx

Similar presentations


 Imaging>")

 Magnetic Resonance Imaging (MRI)>")
