Download presentation
Presentation is loading. Please wait.

1
Part One

4
Elastic Rebound Theory The elastic rebound theory is an explanation for how energy is spread during earthquakes. As plates shift on opposite sides of a fault are subjected to force, they accumulate energy and slowly deform until their internal strength is exceeded. At that time, a sudden movement occurs along the fault, releasing the accumulated energy, and the rocks try to snap back to their original undeformed shape.

10
Measuring Earthquakes A seismogram is a record of the seismic waves from an earthquake. A seismograph or seismometer is the measuring instrument that creates the seismogram. Almost all seismometers are based on the principle of inertia: a suspended mass tends to remain still when the ground moves. The relative motion between the suspended mass and the ground will then be a measure of the ground’s motion.

12
Two

13
P-waves:Primary waves Compressional (Longitudinal) waves Pass through solids and liquids S-waves:Secondary waves Shear (Transverse) waves ~ 2/3 as fast as P-waves Pass through solids but not liquids Body Waves
 waves Pass through solids and liquids S-waves:Secondary waves Shear (Transverse) waves ~ 2/3 as fast as P-waves Pass through solids but not liquids Body Waves")
15
Raleigh waves: Retrograde elliptical motion Love waves: Polarised in plain of Earth's surface... these waves cause trouble for Engineers! Surface Waves

16
Raleigh Love

17
World Wide Standard Seismograph Network (WWSSN) set up to monitor Nuclear Test Ban treaty.
 set up to monitor Nuclear Test Ban treaty.")
18
WWSSN drum seismogram 1964 Alaska earthquake Magnitude 9.2 Largest measured earthquake in Alaska

19
Damaged school 1964 Alaska earthquake

20
Analogue WWSSN instruments are being replaced by modern digital instruments in an expanded Global Seismic Network (GSN)
")
21
Modern digital seismometers

22
Locating an Epicentre By looking at the seismograms from different recording stations we can find out the epicentre of the earthquake. The signals arrive first at the closest station and last at the one furthest away. The time difference between the P- and S-waves tells us the distance the earthquake is from the seismograph. By measuring this at three stations we can work out where the epicentre is.

23
Locating an Epicentre

25
Locating an earthquake

34
Liquefaction – San Francisco 1989

36
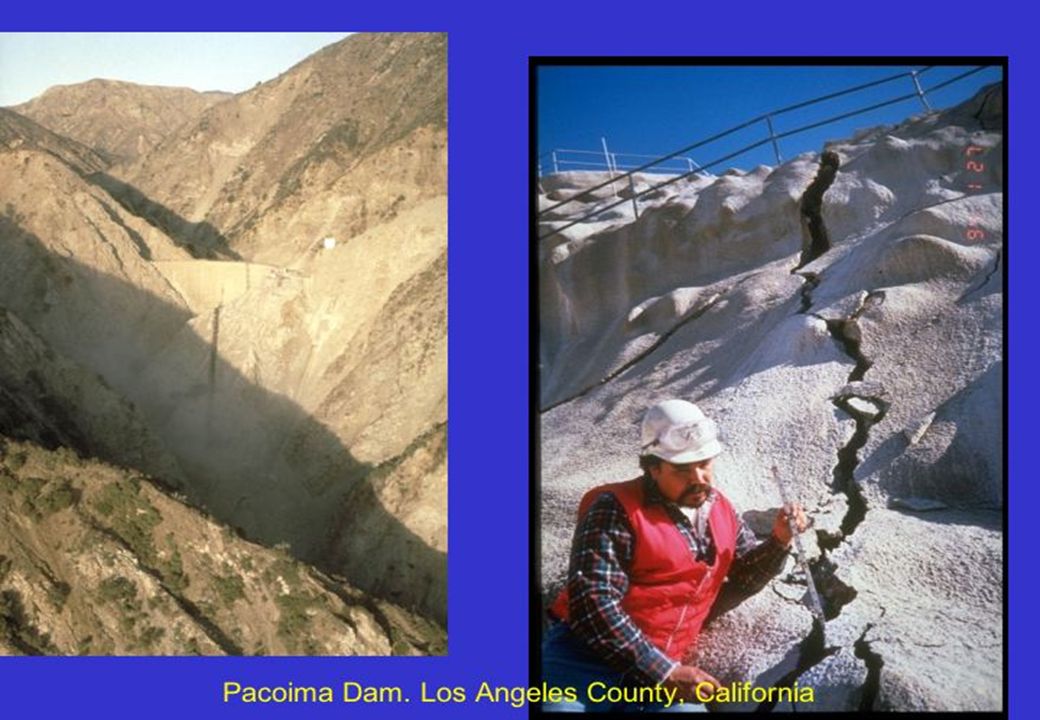
Flooding (dam break)
")
Similar presentations


 waves Pages 332-333, 338-341, 358-361.>")


 what an earthquake is; b) what the elastic rebound theory.>")


