Download presentation
Presentation is loading. Please wait.

1
Arizona Nutrition Status Report, 2008

2
Report Focus Areas Fruit and Vegetable Consumption Food Security Healthy Weight Calcium Consumption Physical Activity Folic Acid Breastfeeding Anemia

3
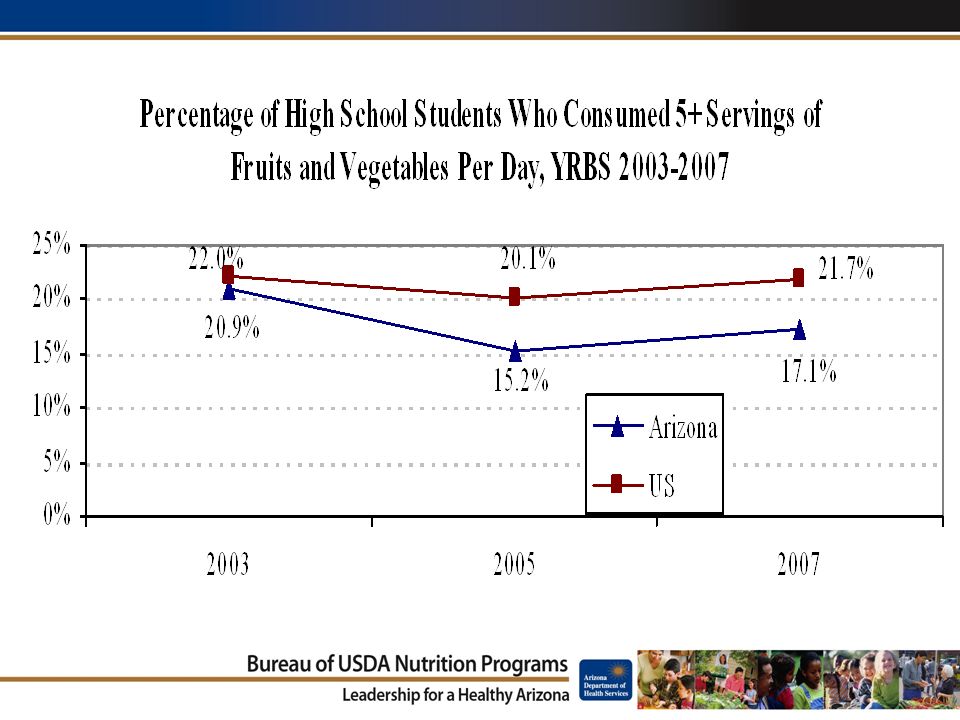
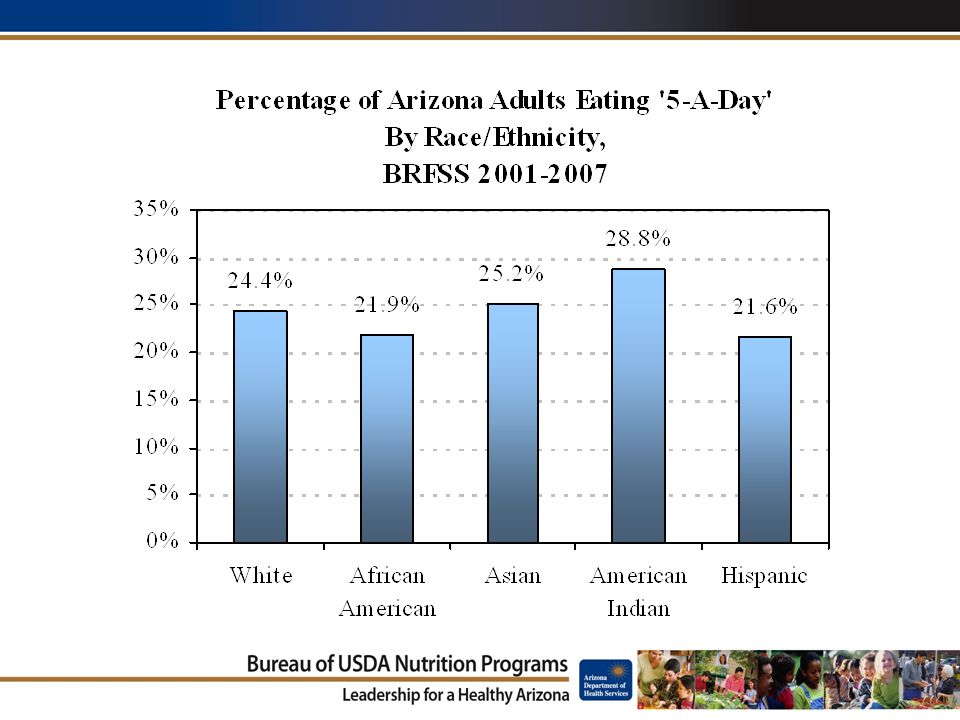
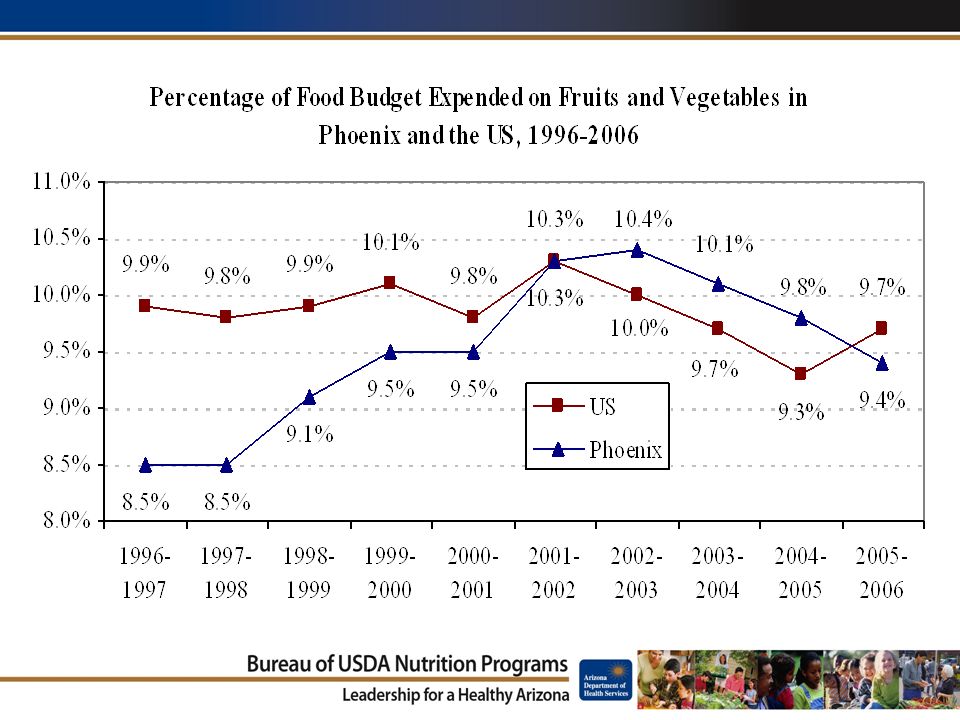
Fruit and Vegetable Consumption: Increase the proportion of persons age two years and older who consume at least two daily servings of fruit and at least three servings of vegetables, with at least one-third being dark green or deep yellow vegetables.

5
2001: 130%=2,371 2007: 130% FPL n=3,413

8
Food Security: Increase food security among Arizona households, and in doing so, reduce hunger.

9
Food Security The USDA reports that for 2004 to 2006: –11.3% of Arizona households were food insecure without experiencing hunger –3.9% were food insecure and experienced hunger Arizona’s emergency food network served approximately: –77,500 people served in any given week –Total of 479,000 unduplicated people in 2005.

10
Food Security Indicators by County, Arizona Number of People Receiving Food Stamps (2008) * Number of People <130% FPL (2000) ** Number of Emergency Food Assistance Agencies (2006-2007)*** Number of Pounds of Food Distributed by Food Banks (2006- 2007)*** Apache 20,281 33,657 151,183,870 Cochise 18,035 27,279 274,558,400 Coconino 18,045 28,375 365,319,156 Gila 9,367 12,684 12642,302 Graham 4,784 9,665 4491,311 Greenlee 488 1,226 2294,876 La Paz 3,233 5,459 5140,219 Maricopa 371,907 504,194 58348,261,144 Mohave 28,757 31,874 261,232,271 Navajo 29,458 36,266 452,668,401 Pima 118,060 169,838 23112,659,493 Pinal 38,982 37,935 554,076,216 Santa Cruz 8,978 13,257 1112,717,452 Yavapai 18,274 30,079 502,143,207 Yuma 32,669 43,749 475,138,992 Arizona 721,318 985,537 1,252134,191,295
 * Number of People <130% FPL (2000) ** Number of Emergency Food Assistance Agencies ( )*** Number of Pounds of Food Distributed by Food Banks ( )*** Apache 20,281 33, ,183,870 Cochise 18,035 27, ,558,400 Coconino 18,045 28, ,319,156 Gila 9,367 12, ,302 Graham 4,784 9, ,311 Greenlee 488 1, ,876 La Paz 3,233 5, ,219 Maricopa 371, , ,261,144 Mohave 28,757 31, ,232,271 Navajo 29,458 36, ,668,401 Pima 118, , ,659,493 Pinal 38,982 37, ,076,216 Santa Cruz 8,978 13, ,717,452 Yavapai 18,274 30, ,143,207 Yuma 32,669 43, ,138,992 Arizona 721, ,537 1,252134,191,295")
11
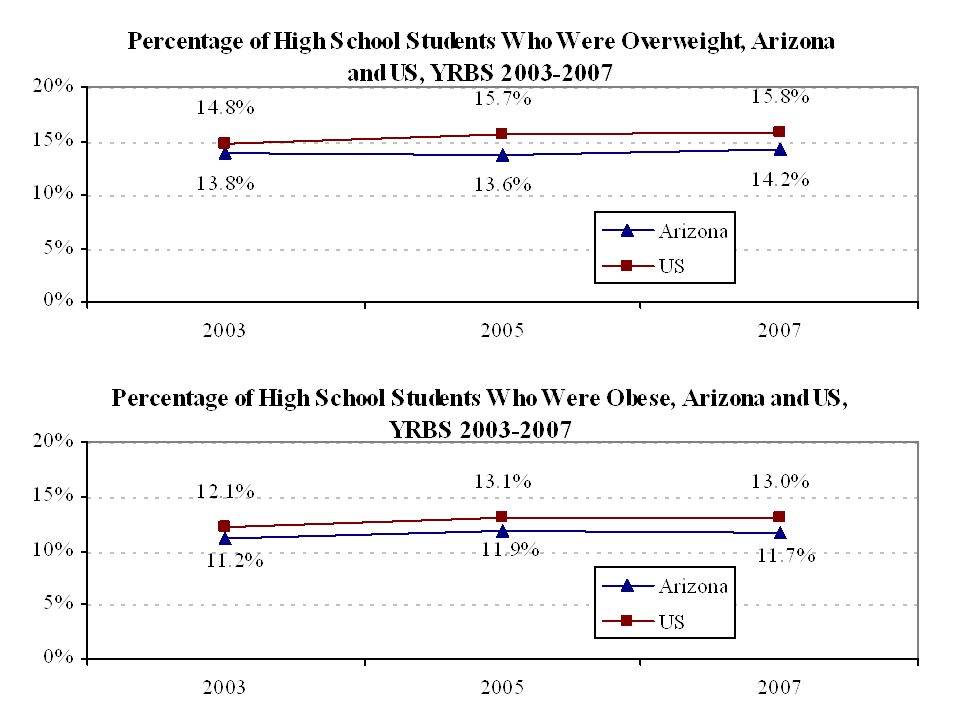
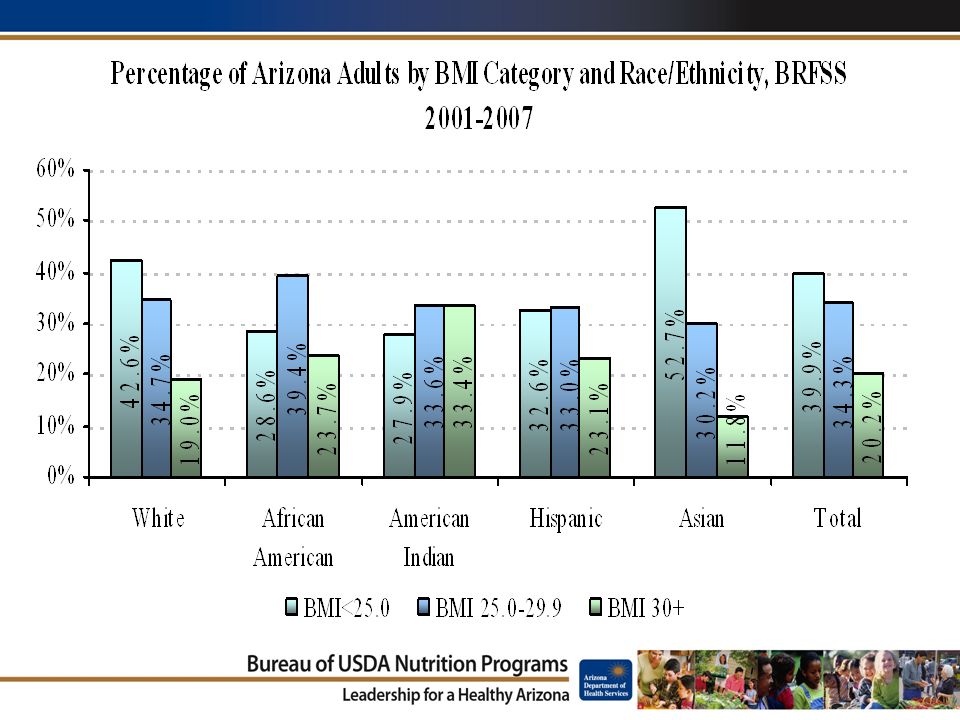
Healthy Weight: Increase the proportion of children, adolescents and adults who are at a healthy weight.

12
*Does not include Navajo or ITCA WIC

18
Calcium Consumption: Increase the proportion of persons aged two years and older who meet dietary recommendations for calcium.

19
School Environment, 2006 Students can purchase 1% low fat or fat free milk on school property: –42% of middle schools –36% of high schools Students can purchase 2% reduced fat or whole milk on school property: –38% of middle schools –42% of high schools

20
*3 month average

21
Milk Taste Tests Participants reported that they liked the 1% low fat milk more than any of the other samples. As age increased, participants were more likely to report liking the 1% low fat sample.

23
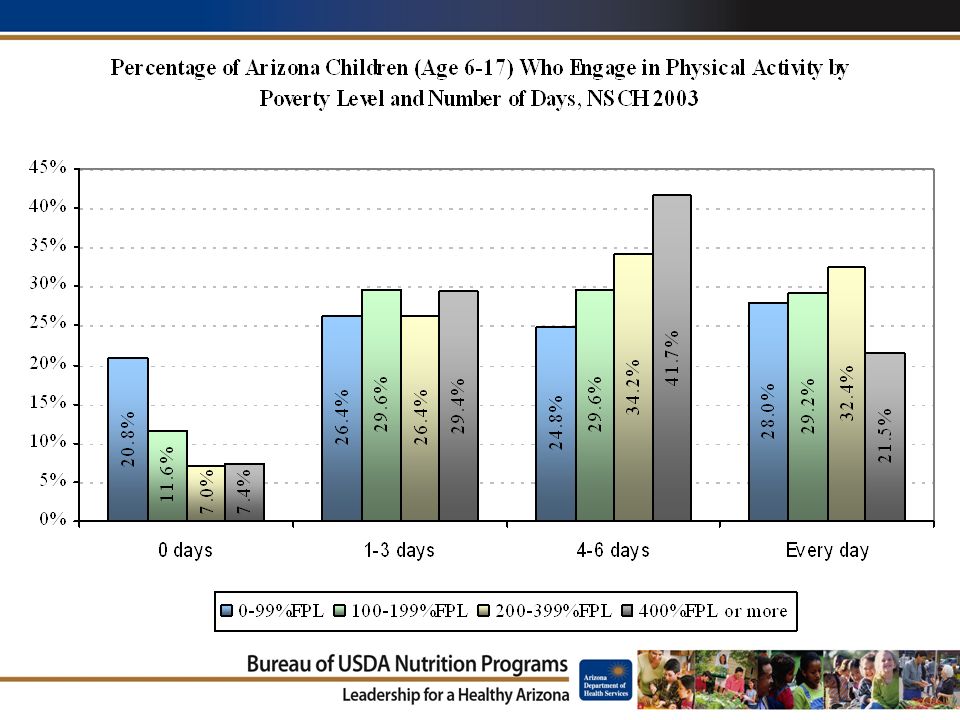
Physical Activity: Increase the proportion of children who participate in cumulative intermittent physical activity for 60 minutes per day.

25
Screen Time 36.3% of children age six to 17 watched television, videos or played video games for two to three hours on an average school day. (37.7% US) Almost ten percent (8.3%) of children watched television, videos or played video games four or more hours on an average school day.
 Almost ten percent (8.3%) of children watched television, videos or played video games four or more hours on an average school day..")
26
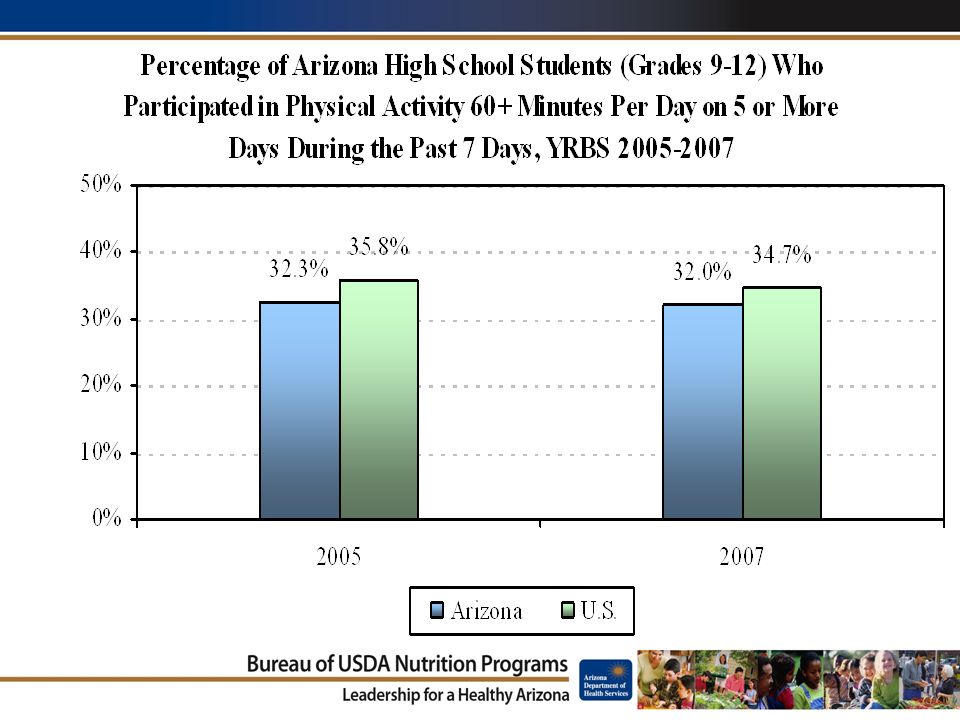
Physical Activity: Increase the proportion of adolescents who engage in either moderate or vigorous physical activity.

28
Physical Activity: –32% of high school students reported being active for at least 60 minutes on five or more days of the week. –Almost ten percent (9.2%) of high school students report participating in no physical activity in the past week. Screen Time: –28.2% of high school students reported spending at least three hours watching television per day –21.4% of high school students reported spending at least three hours playing computer or video games.
 of high school students report participating in no physical activity in the past week. Screen Time: –28.2% of high school students reported spending at least three hours watching television per day –21.4% of high school students reported spending at least three hours playing computer or video games..")
29
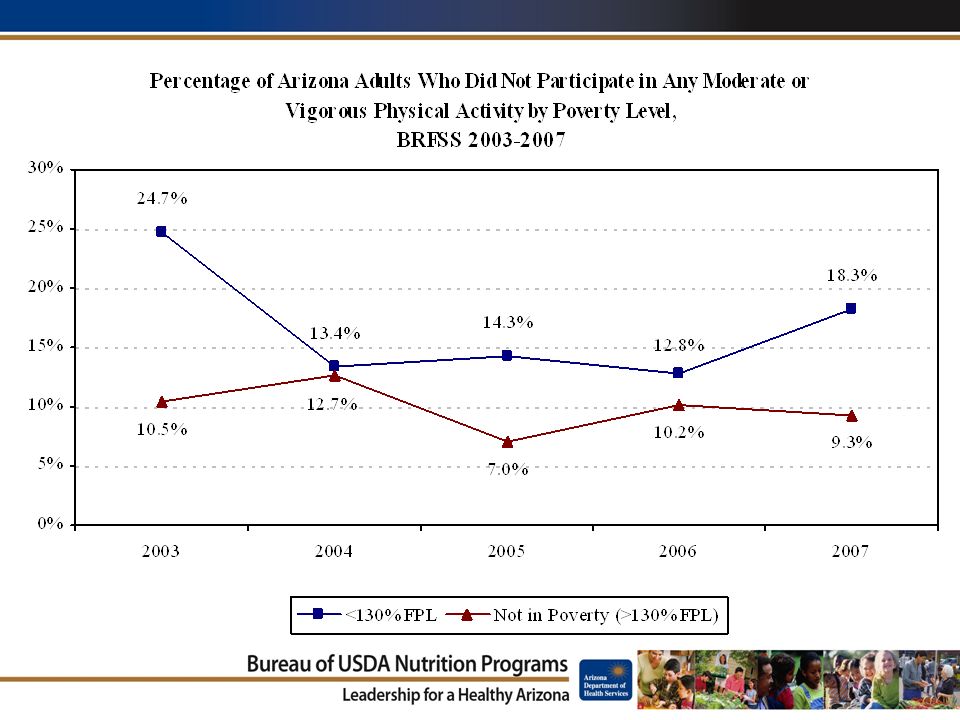
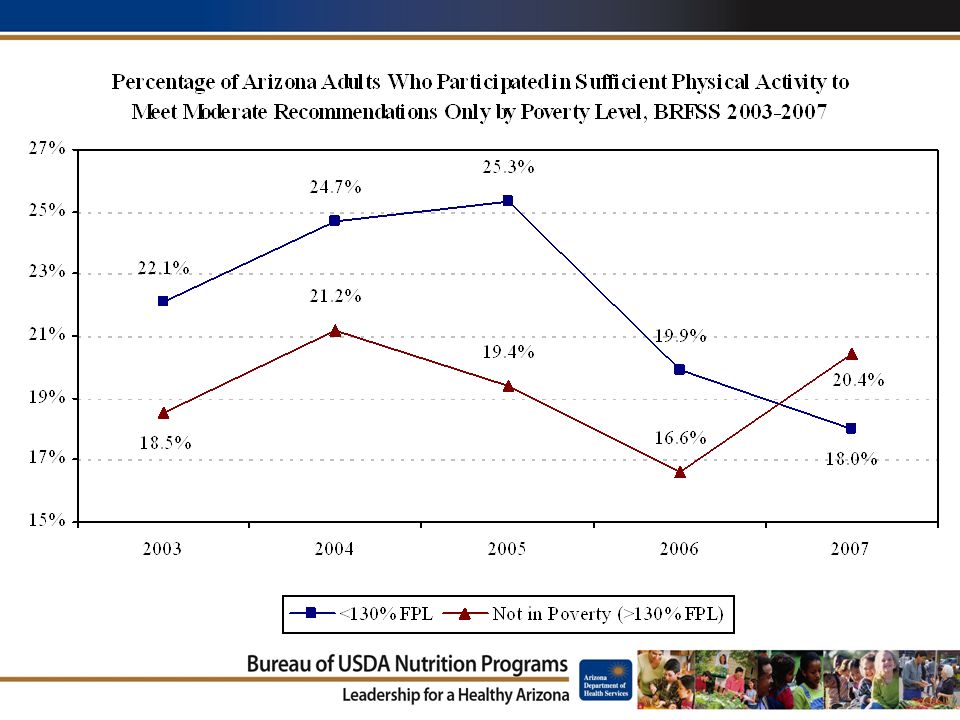
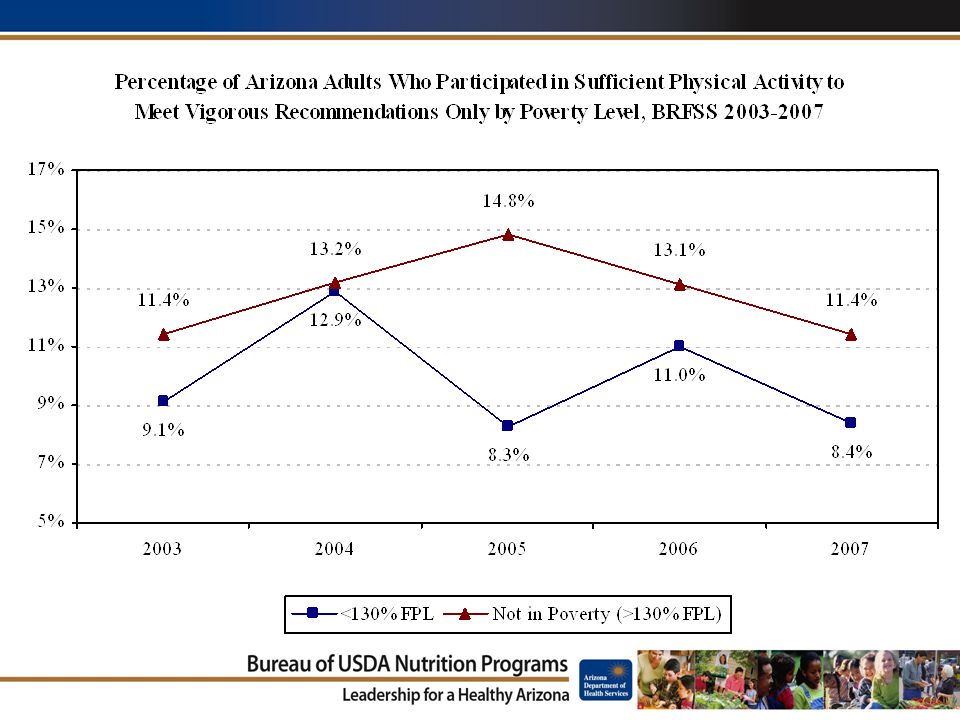
Physical Activity: Increase the proportion of adults who engage regularly, preferably daily, in moderate or vigorous physical activity.

34
Folic Acid: Increase the proportion of pregnancies begun with an optimum folic acid level.

38
*Question was not asked in 2002. Data not available by income level for 2003.

39
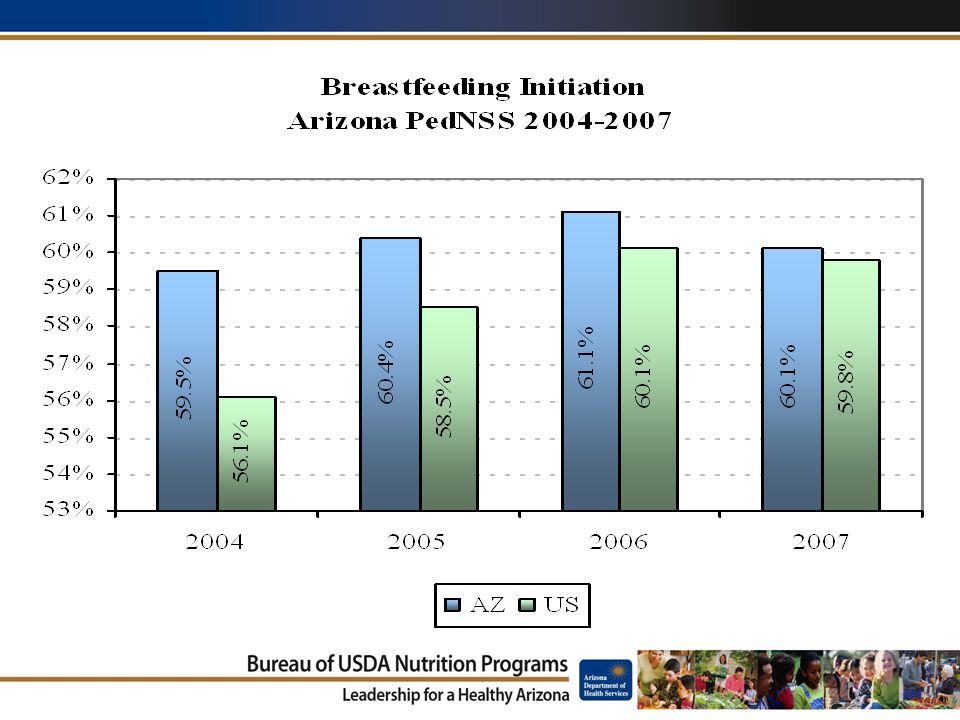
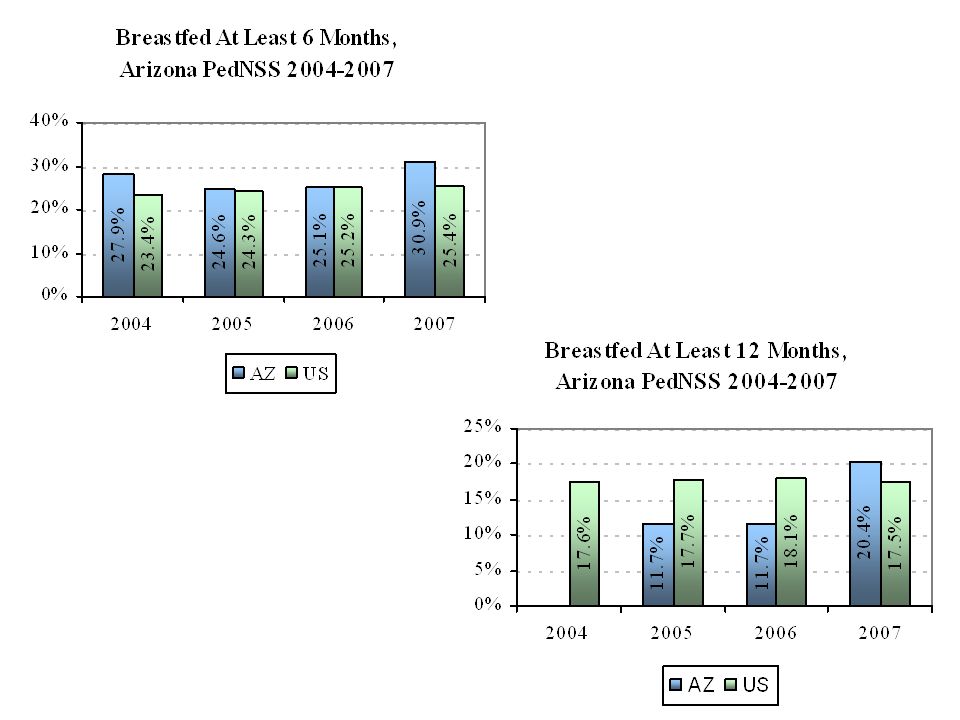
Breastfeeding: Increase the proportion of mothers who breastfeed.

40
Breastfeeding in Arizona Arizona ranked 10th for the highest breastfeeding initiation rates in the country.

43
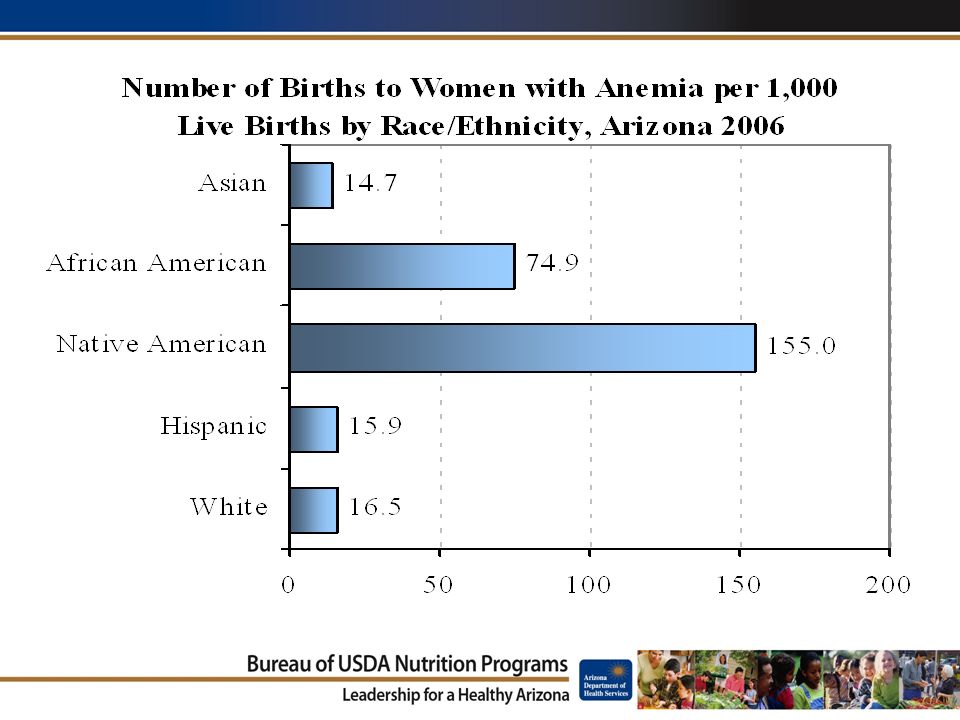
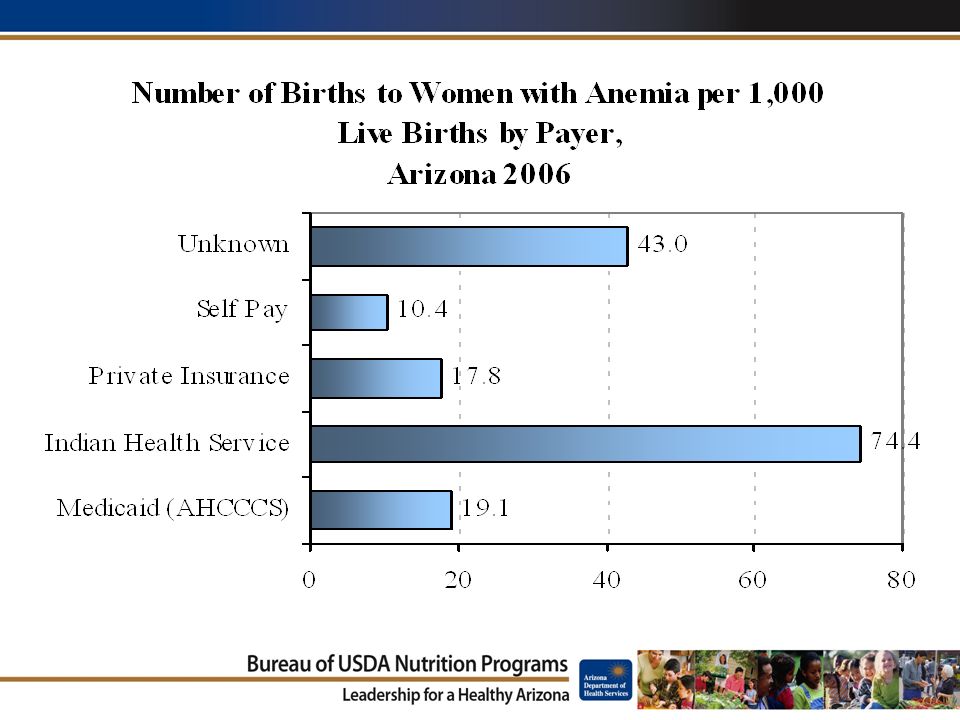
Anemia: Reduce iron deficiency anemia among infants, young children and females of childbearing age.

47
Anemia in the Arizona WIC Population 27.8% of pregnant women were at risk for anemia during their third trimester 21.7% of postpartum women were at risk for anemia –Younger mothers tend to have higher rates both during and after pregnancy. –Pregnant and postpartum Black, non-Hispanic mothers have the highest risk for anemia both in Arizona and nationally

48
To access the full report go to: http://www.eatwellbewell.org/partn ers/partner-resources/data-and- statistics

Similar presentations


 strives to create innovative partnerships that empower low-income Californians to increase.>")
 Nutrition Program California Department.>")


