Download presentation
Presentation is loading. Please wait.

1
Advanced Algebra II Notes 8.1 Graphing Parametric Equations Parametric Equations: A pair of equations used to separately describe the x- and y- coordinates of a point as functions of a third variable, called the parameter. An approach to shape representation in which a curve or a surface is defined by a set of equations expressed in terms of a set of independent variables (i.e. the parameters).
..")
2
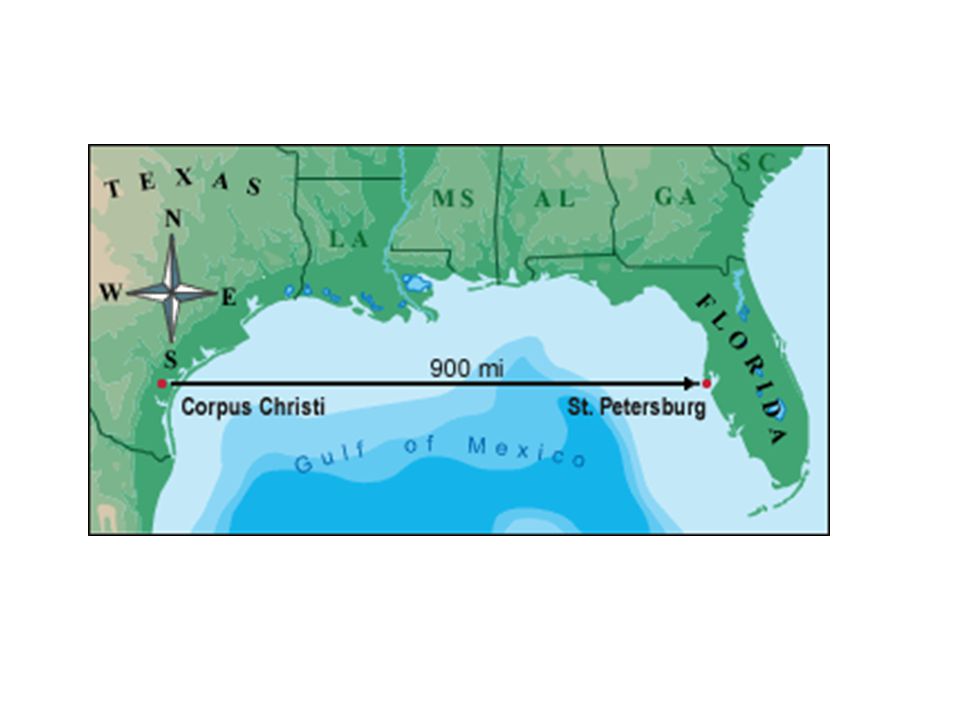
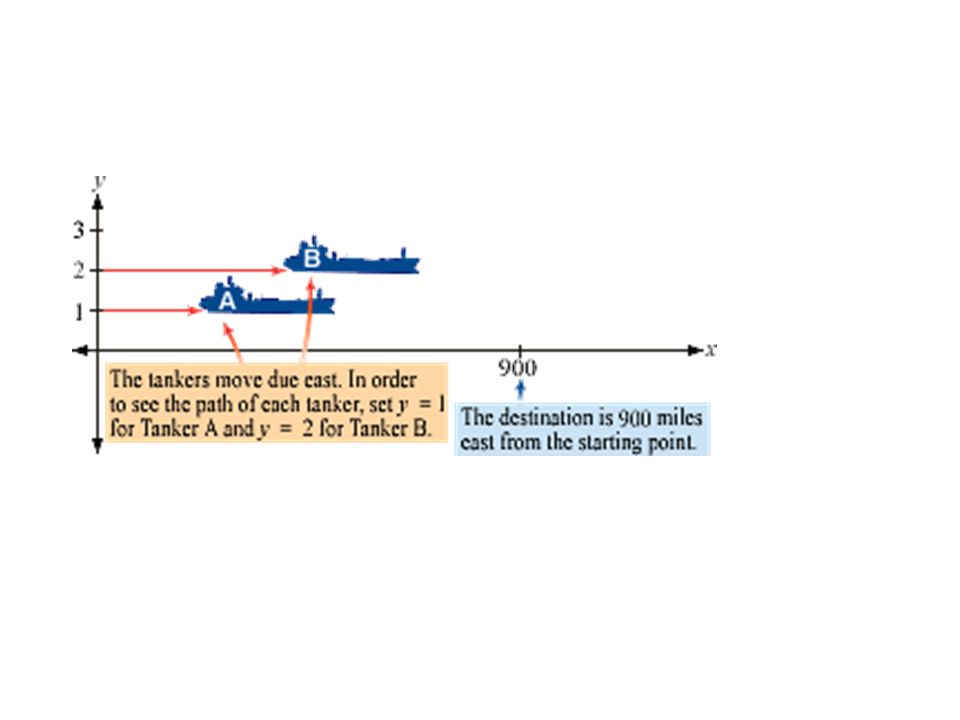
Two tankers leave Corpus Christi, Texas, at the same time, traveling toward St. Petersburg, Florida, 900 miles due east. Tanker A travels at a constant speed of 18 miles per hour and Tanker B travels at a constant speed of 22 mph. Write parametric equations and use your calculator to simulate the motion involved in this situation. Tanker A equations:__________________ Tanker B equations:__________________ Window: ____________________

5
a)How long does it take the faster tanker to reach St. Petersburg? b) Where is the slower tanker when the faster tanker reaches its destination? c) When, during the trip, is the faster tanker exactly 82 miles in front of the slower tanker? d) During what part of the trip are the tankers less than 60 miles apart?
 Where is the slower tanker when the faster tanker reaches its destination. c) When, during the trip, is the faster tanker exactly 82 miles in front of the slower tanker. d) During what part of the trip are the tankers less than 60 miles apart .")
6
Note 8A: Changing Mode For your work in this chapter, check and change, if necessary, three settings on the MODE screen. a) Press MODE and set the third line to Degree. You will work with angles in the second half of the chapter and those angles are measured in degrees. If you get a “funny” answer when using a trigonometric function, check to see that you are still in Degree mode. b) Set the fourth line to Par. In this chapter your graph and use parametric equations. When you switch to Paramtetric mode, the Y = screen and the Window screen change. c) Set the sixth line to Simul. In this chapter you graph more than one set of parametric equations. In Simultaneous mode, all equations graph at the same time, In Sequential mode, equations graph one after the other.
 Press MODE and set the third line to Degree. You will work with angles in the second half of the chapter and those angles are measured in degrees. If you get a funny answer when using a trigonometric function, check to see that you are still in Degree mode. b) Set the fourth line to Par. In this chapter your graph and use parametric equations. When you switch to Paramtetric mode, the Y = screen and the Window screen change. c) Set the sixth line to Simul. In this chapter you graph more than one set of parametric equations. In Simultaneous mode, all equations graph at the same time, In Sequential mode, equations graph one after the other..")
7
Note 8B Graphing in Parametric Mode In Parametric mode, you define equations in terms of the parameter t. To enter the variable, t, press. It takes a pair of equations to create a single parametric graph. Until you define both and ( or any other X –Y pair) on the Y = screen, nothing will graph.
 on the Y = screen, nothing will graph..")
8
Setting the Window In Parametric mode the Window screen is different from the familiar Function mode Window screen. The Graph screen that you see is still set by the values of Xmin, Xmax, Xscl, Ymin, Ymax, Yscl. But in addition, you must set the starting and stopping values of t. The t-values you choose do not affect the dimensions of the Graph screen, but they do affect what will be drawn. Tmin = minimum t-value that the calculator uses to evaluate the x- and y-function values. Tmax =maximum t-value that the calculator uses to evaluate the x- and y-function values. Tstep = the increment by which t increases between each evaluation. Tstep controls the speed at which the graph is drawn. Start with Tstep equal to about one hundredth of the range of t,. If the graphing speed is not to your liking or your graph needs more detail, adjust Tstep.

9
Note 8C Tracing Parametric Equations In Parametric mode, when you press TRACE, the spider starts at the point (x, y) defined by Tmin. The t-, x-, and y- values are displayed. Each time you press the right arrow key, t increases by Tstep and the spider moves to the new point defined by the new t-value. Note that the right arrow key may not necessarily move the spider to the right on the graph, but it will always increase the value of t. Pressing the left arrow key similarly decreases the value of t. If more than one pair of equations is defined on the Y = screen, pressing the up and down arrow keys makes the spider jump to the previous or next pair of equations.

10
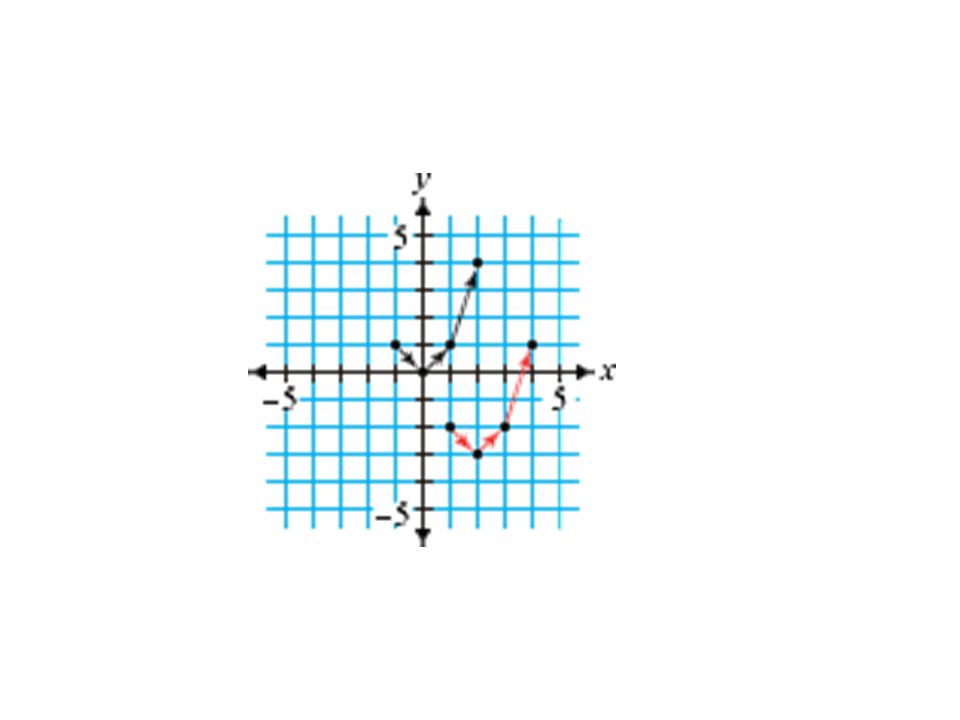
Consider the parametric equations x = t and y = t 2 for a) Graph the equations on graph paper and on your calculator. b) Write equations to translate this parabola right 2 units and down 3 units.
 Write equations to translate this parabola right 2 units and down 3 units..")
12
Assignment: page 427: 1 – 6, 9, 10

Similar presentations


 of real numbers. The graph of.>")


 that is not a function. We can do this by writing equations for.>")


 of Americans can be modeled by the function.>")

