Download presentation
Presentation is loading. Please wait.

1
MSC COURSE IN EDUCATION & DEVELOPMENT 2013 NicholasSpaull@gmail.comNicholasSpaull@gmail.com | www.nicspaull.com/teaching www.nicspaull.com/teaching Day 1: Primary School Performance in Botswana, Mozambique, Namibia & South Africa

2
Introduction Researcher at RESEP (Stellenbosch University)RESEP Research focus: the quality of primary education in South Africa and sub-Saharan Africa All research and presentations I’ve done can be found at www.nicspaull.com/research www.nicspaull.com/research Twitter: @NicSpaull Email: NicholasSpaull@gmail.comNicholasSpaull@gmail.com
RESEP Research focus: the quality of primary education in South Africa and sub-Saharan Africa All research and presentations I’ve done can be found at")
3
Full paper available at: http://www. sacmeq.org/do wnloads/Working%20Papers/08_C omparison_Final_18Oct2011.pdf

4
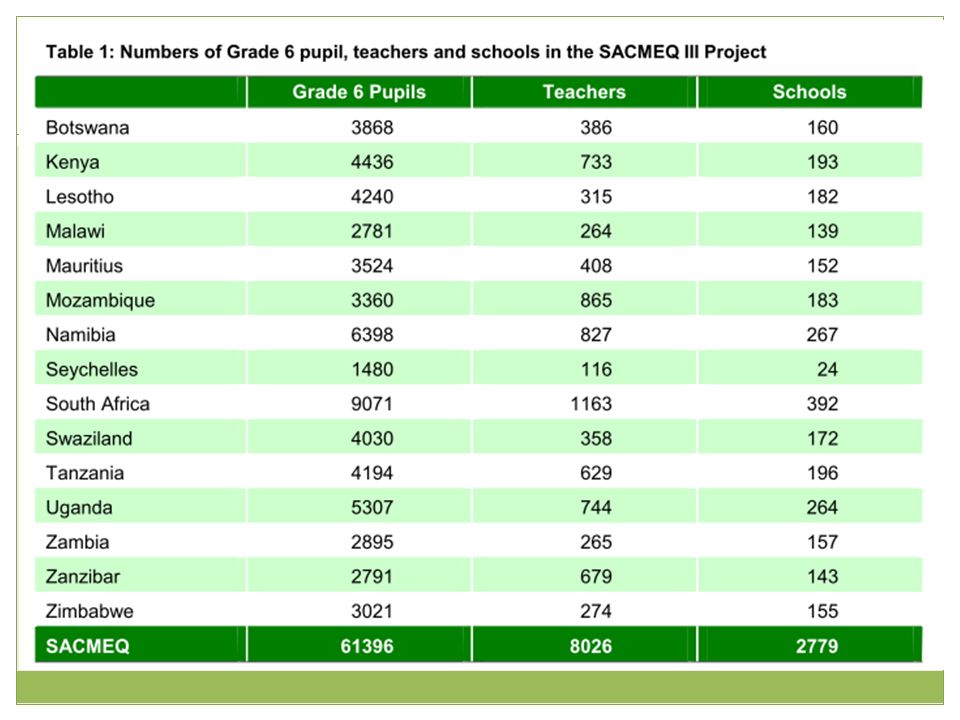
SACMEQ Southern and Eastern African Consortium for Monitoring Educational Quality 14 participating countries 61,396 Grade 6 students 8,026 Grade 6 teachers 2,779 primary schools SACMEQ II (2000), SACMEQ III (2007) Background survey Testing : o Gr 6 Numeracy o Gr 6 Literacy o HIV/AIDS Health knowledge NB: See Murimba Background: Data
, SACMEQ III (2007) Background survey Testing : o Gr 6 Numeracy o Gr 6 Literacy o HIV/AIDS Health knowledge NB: See Murimba Background: Data")
6
Important background papers Background to SACMEQ: Hungi, N., Makuwa, D., Ross, K., Saito, M., Dolata, S., van Capelle, F., et al. (2011). SACMEQ III Project Results: Levels and Trends in School Resources among SACMEQ School Systems. Paris: Southern and Eastern Africa Consortium for Monitoring Educational Quality.SACMEQ III Project Results: Levels and Trends in School Resources among SACMEQ School Systems Ross, K., Saito, M., Dolata, S., Ikeda, M., Zuze, L., Murimba, S., et al. (2005). The Conduct of the SACMEQ III Project. In E. Onsomu, J. Nzomo, & C. Obiero, The SACMEQ II Project in Kenya: A Study of the Conditions of Schooling and the Quality of Education. Harare: SACMEQ.The SACMEQ II Project in Kenya: A Study of the Conditions of Schooling and the Quality of Education Murimba, S. (2005) SACMEQ Mission, Approach and Projects. Prospects, vol. XXXV, no. 1, March 2005SACMEQ Mission, Approach and Projects
. SACMEQ III Project Results: Levels and Trends in School Resources among SACMEQ School Systems. Paris: Southern and Eastern Africa Consortium for Monitoring Educational Quality.SACMEQ III Project Results: Levels and Trends in School Resources among SACMEQ School Systems Ross, K., Saito, M., Dolata, S., Ikeda, M., Zuze, L., Murimba, S., et al. (2005). The Conduct of the SACMEQ III Project. In E. Onsomu, J. Nzomo, & C. Obiero, The SACMEQ II Project in Kenya: A Study of the Conditions of Schooling and the Quality of Education. Harare: SACMEQ.The SACMEQ II Project in Kenya: A Study of the Conditions of Schooling and the Quality of Education Murimba, S. (2005) SACMEQ Mission, Approach and Projects. Prospects, vol. XXXV, no. 1, March 2005SACMEQ Mission, Approach and Projects.")
7
Focus The focus of the paper was to provide helpful descriptive statistics on the quality of education in these 4 countries.

8
SACMEQ The most important parts of the SACMEQ survey are the numeracy and literacy tests aimed at Grade 6 students. These range from very simple questions…

9
SACMEQ Very simple example questions from the SACMEQ 2007 Gr 6 literacy test

10
More complex questions

11
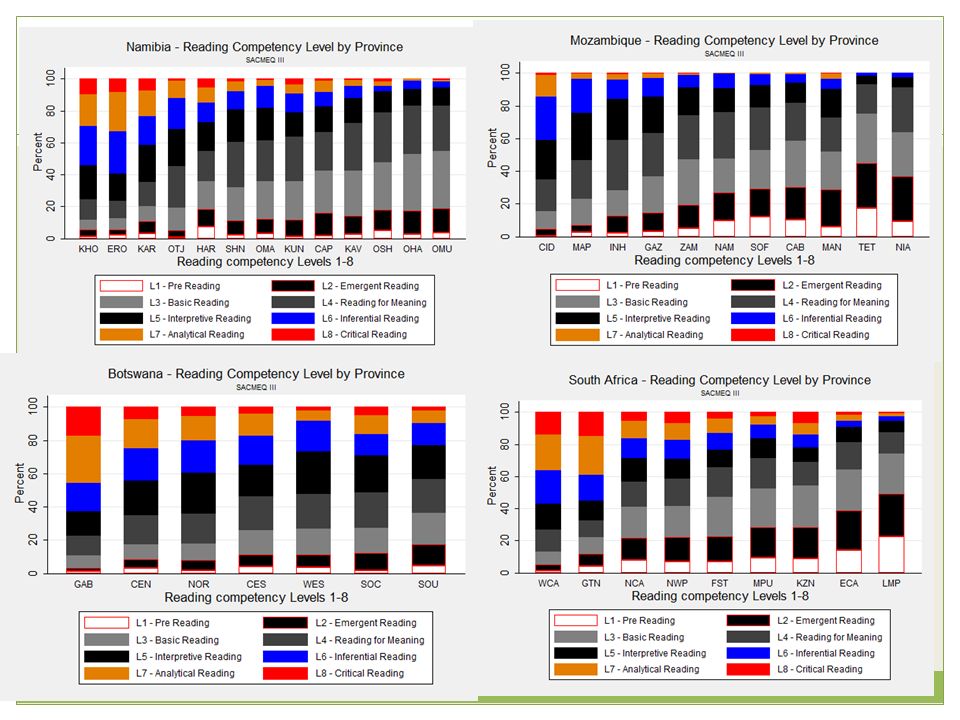
SACMEQ competency levels

12
SACMEQ Numeracy items (Eg)
")
13
SACMEQ competency levels

14
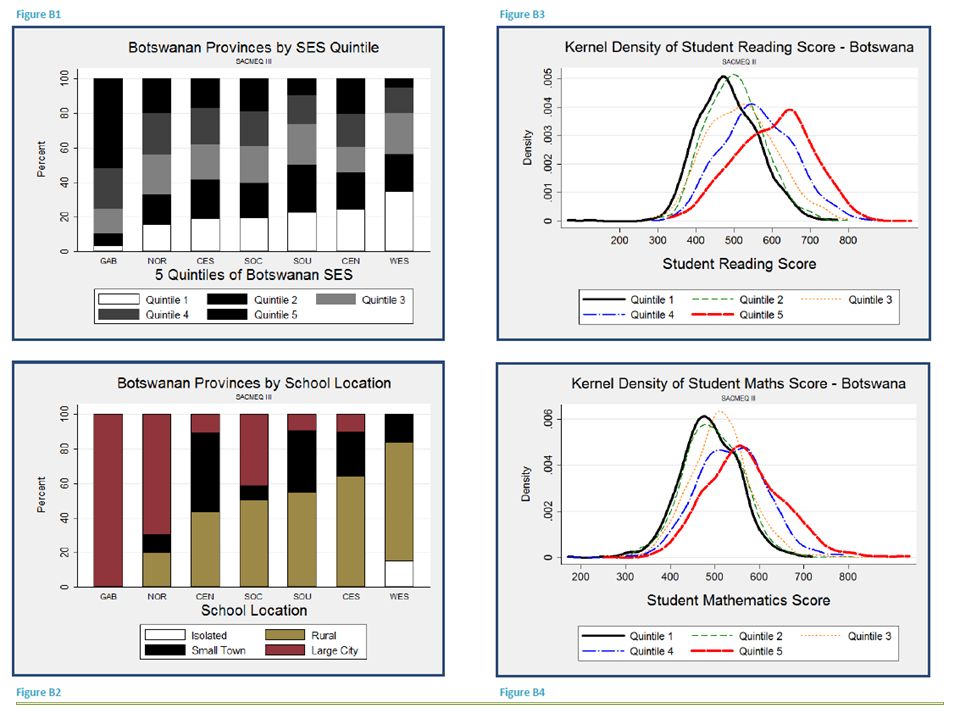
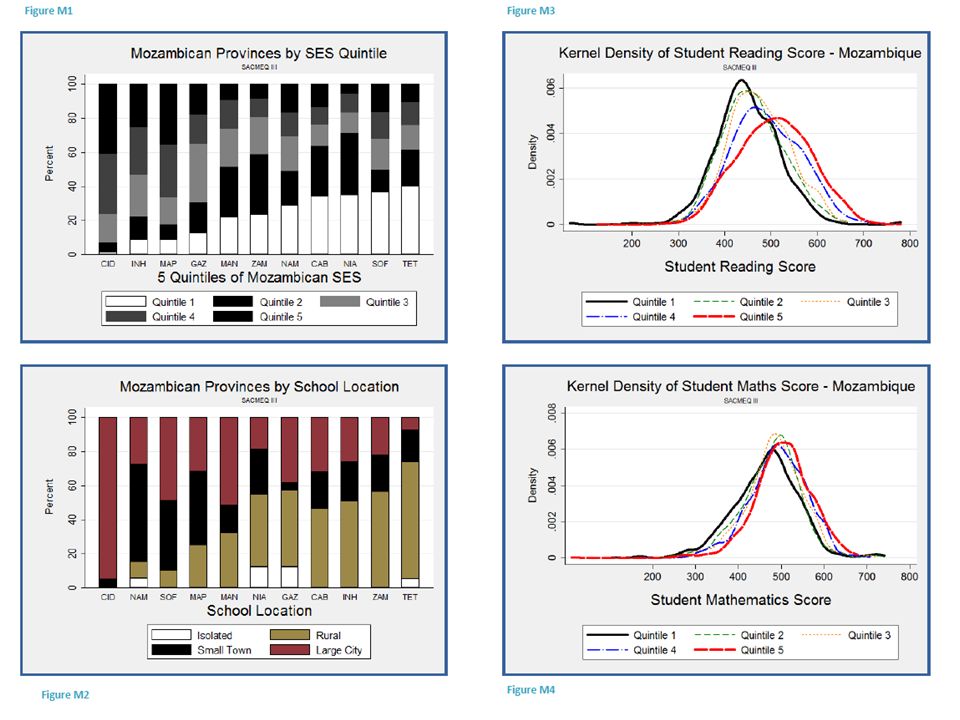
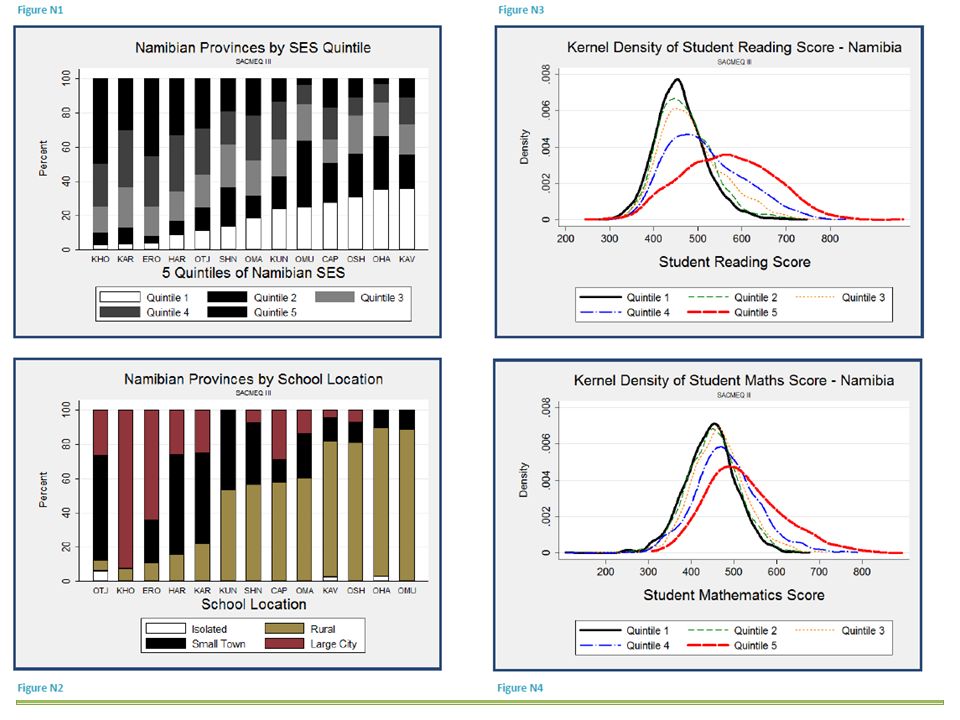
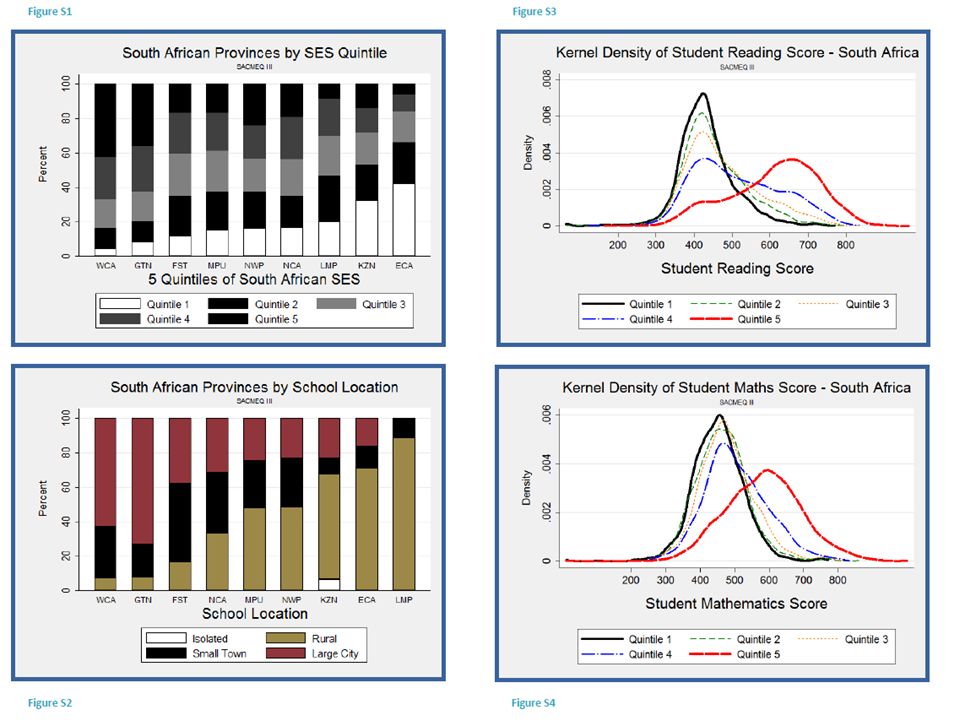
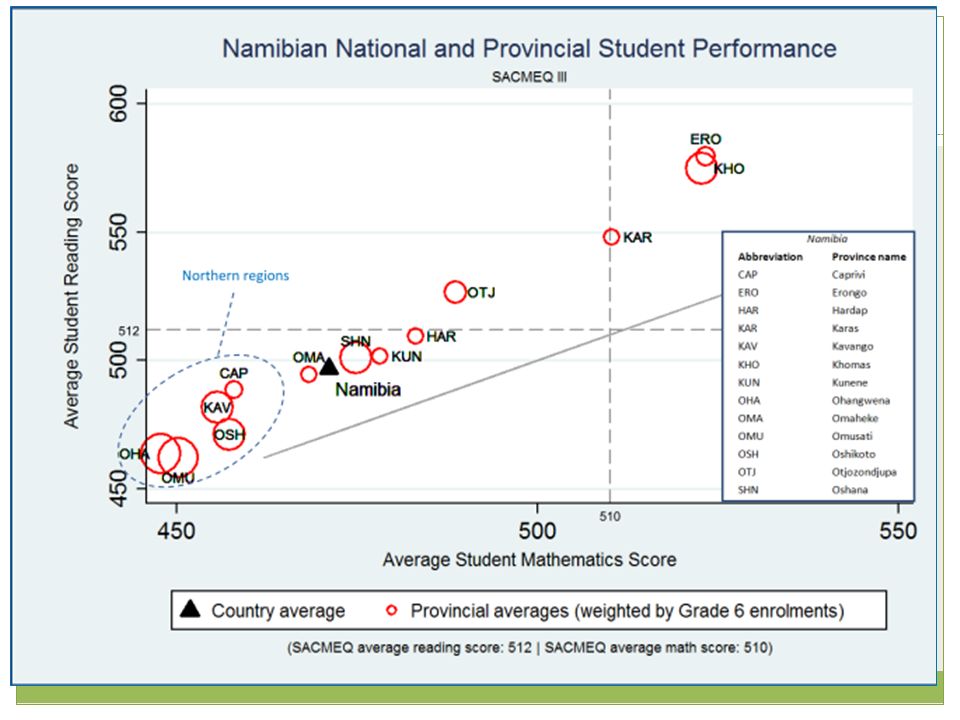
Core grouping categories In this paper the core groupings are as follows: Province (or SACMEQ geographic distinction) Location (Urban/Rural) (Large City, Small Town, Rural, isolated) Quintile of socioeconomic status (SES) (quintile=20%) Quintile 1 = Poorest 20% of students Quintile 2 = 2 nd poorest 20% of students Quintile 3 = Middle 20% of students Quintile 4 = 2 nd ichest 20% of students Quintile 5 = Richest 20% of students One important grouping which this report doesn’t focus on is gender. Some background descriptive statistics on each country…

23
WCA LIM

28
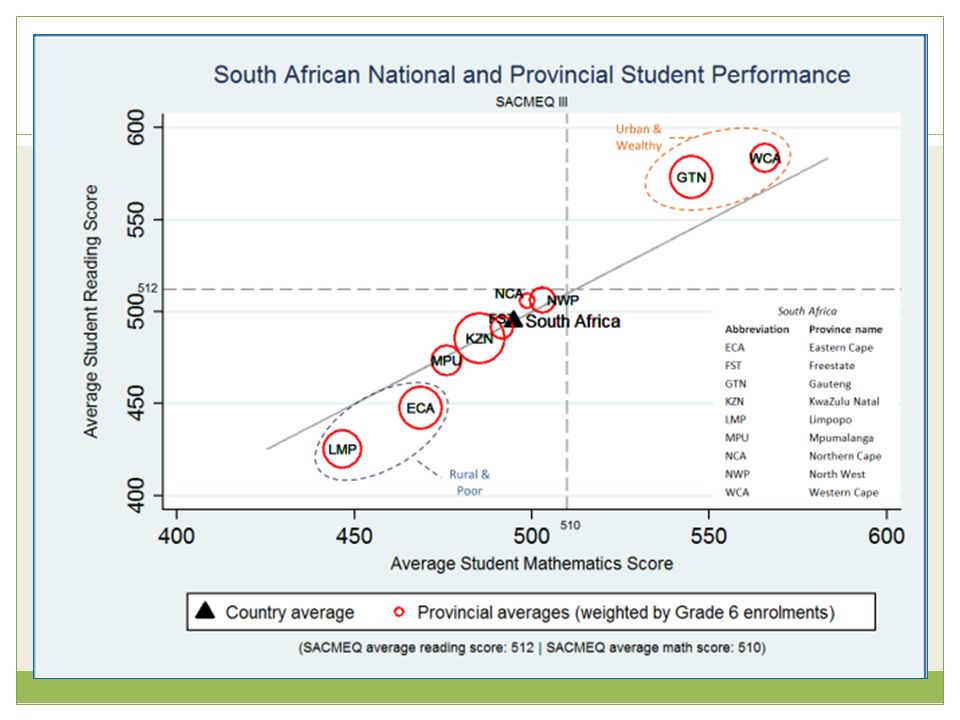
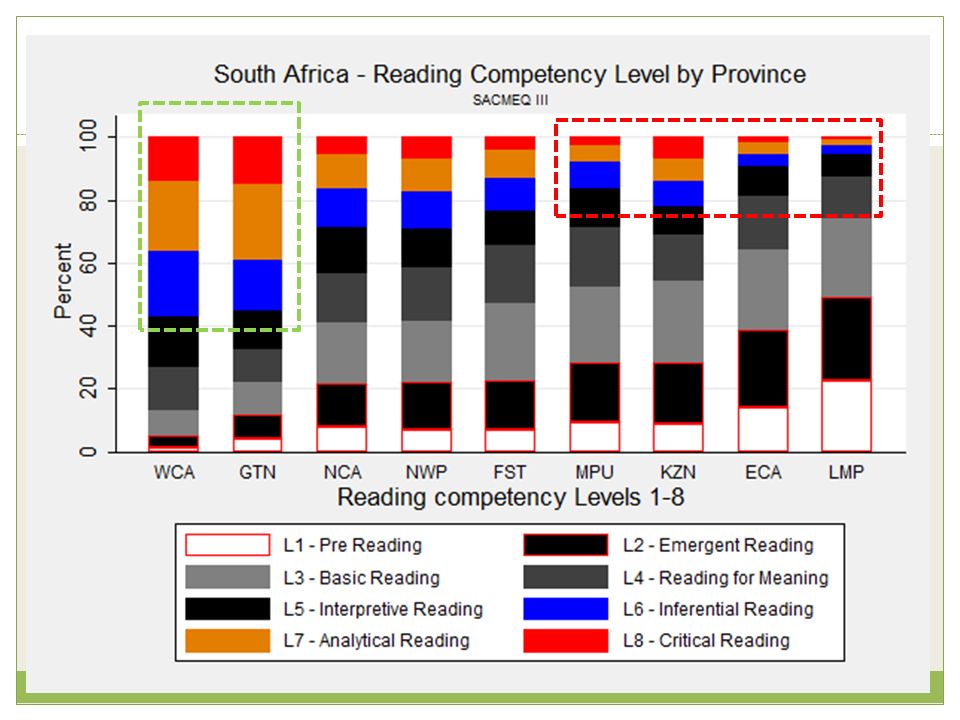
Looking specifically at South Africa

29
South Africa: Socioeconomic breakdown

30
SA primary school: Gr6 Literacy – SACMEQ III (2007) Never enrolled 2% Functionally illiterate 25% Basic skills 46% Higher order skills : 27%
 Never enrolled 2% Functionally illiterate 25% Basic skills 46% Higher order skills : 27%")
31
Grade 6 Literacy – SA & Kenya SA Gr 6 LiteracyKenya Gr 6 Literacy 25% 7% 5%2% 46% 49% 39% 27% Public current expenditure per pupil: $1225 Public current expenditure per pupil: $258 31

32
Grade 6 Literacy – SA & Namibia Public current expenditure per pupil: $1225 Public current expenditure per pupil: $668

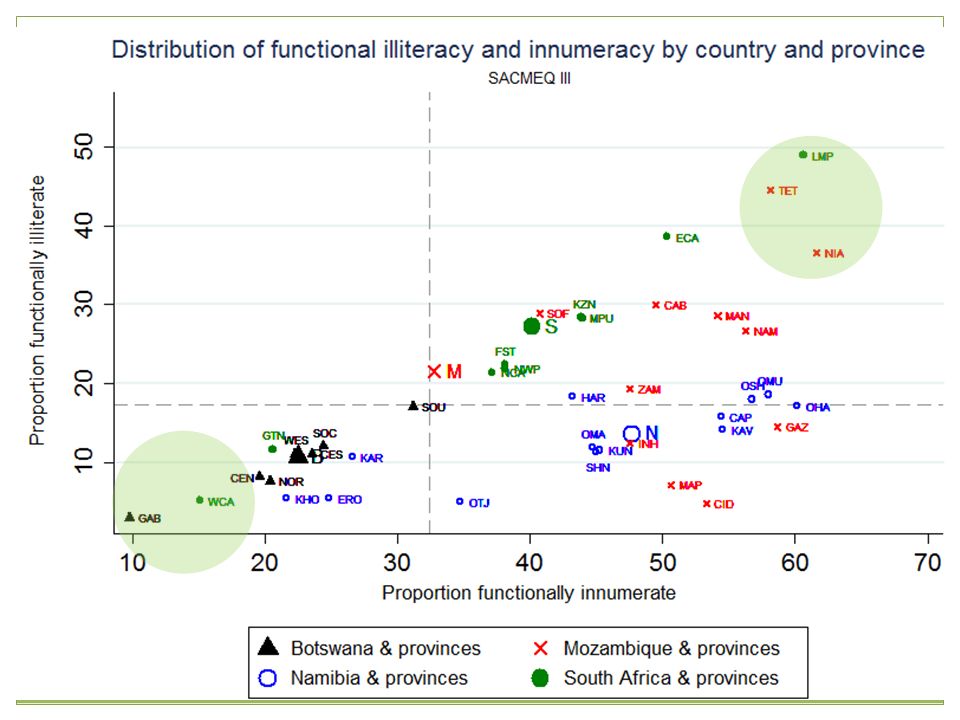
33
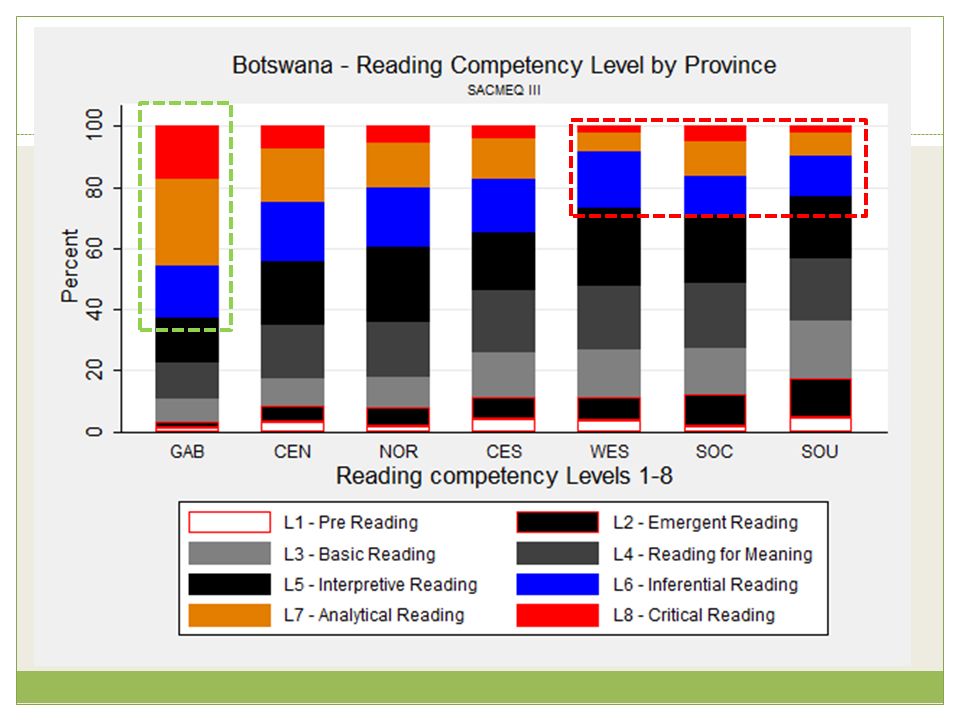
Regional comparisons

34
Country Total population (mil) Adult literacy rate Net Enrolment Rate (2008) GNP/cap PPP US$ (2008) Public Current expenditure on primary education per pupil (unit cost) 2007 – [PPP constant 2006 US$] Survival rate to Grade 5: school year ending 2007 Botswana 1.9283%87%13100122889% 3 Mozambique 22.3854%80%77079 2 60% Namibia 2.1388%89%627066887% 3 South Africa 49.6789%87%9780122598% Source (UNESCO, 2011) (UIS, 2009)(UNESCO, 2011) SACMEQ III (2007) Self-reported teacher absenteeism Proportion of Grade 6 students functionally illiterate Proportion of Grade 6 students functionally innumerate Proportion of students with own reading textbook Proportion of students with own mathematics textbook Botswana10.6 days10.62%22.48%63%62% Mozambique6.4 days21.51%32.73%53%52% Namibia9.4 days13.63%47.69%32% South Africa19.4 days27.26%40.17%45%36% SA in regional context
![Country Total population (mil) Adult literacy rate Net Enrolment Rate (2008) GNP/cap PPP US$ (2008) Public Current expenditure on primary education per pupil (unit cost) 2007 – [PPP constant 2006 US$] Survival rate to Grade 5: school year ending 2007 Botswana %87% % 3 Mozambique %80% % Namibia %89% % 3 South Africa %87% % Source (UNESCO, 2011) (UIS, 2009)(UNESCO, 2011) SACMEQ III (2007) Self-reported teacher absenteeism Proportion of Grade 6 students functionally illiterate Proportion of Grade 6 students functionally innumerate Proportion of students with own reading textbook Proportion of students with own mathematics textbook Botswana10.6 days10.62%22.48%63%62% Mozambique6.4 days21.51%32.73%53%52% Namibia9.4 days13.63%47.69%32% South Africa19.4 days27.26%40.17%45%36% SA in regional context](http://images.slideplayer.com/18/6174138/slides/slide_34.jpg "Country Total population (mil) Adult literacy rate Net Enrolment Rate (2008) GNP/cap PPP US$ (2008) Public Current expenditure on primary education per pupil (unit cost) 2007 – [PPP constant 2006 US$] Survival rate to Grade 5: school year ending 2007 Botswana %87% % 3 Mozambique %80% % Namibia %89% % 3 South Africa %87% % Source (UNESCO, 2011) (UIS, 2009)(UNESCO, 2011) SACMEQ III (2007) Self-reported teacher absenteeism Proportion of Grade 6 students functionally illiterate Proportion of Grade 6 students functionally innumerate Proportion of students with own reading textbook Proportion of students with own mathematics textbook Botswana10.6 days10.62%22.48%63%62% Mozambique6.4 days21.51%32.73%53%52% Namibia9.4 days13.63%47.69%32% South Africa19.4 days27.26%40.17%45%36% SA in regional context")
35
Teacher knowledge

36
Maths teacher content knowledge SACMEQ III

37
Preschool incidence

38
Grade repetition

39
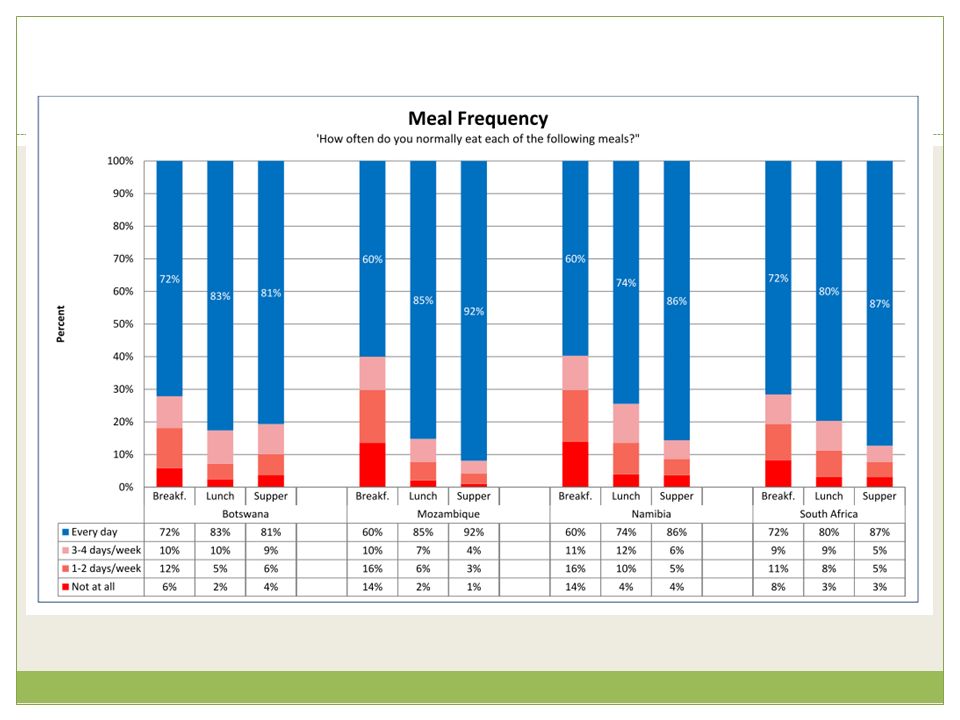
Free school meals

41
Resources the issue? More maths textbooks More reading textbooks

43
Conclusions, questions & recommendations

44
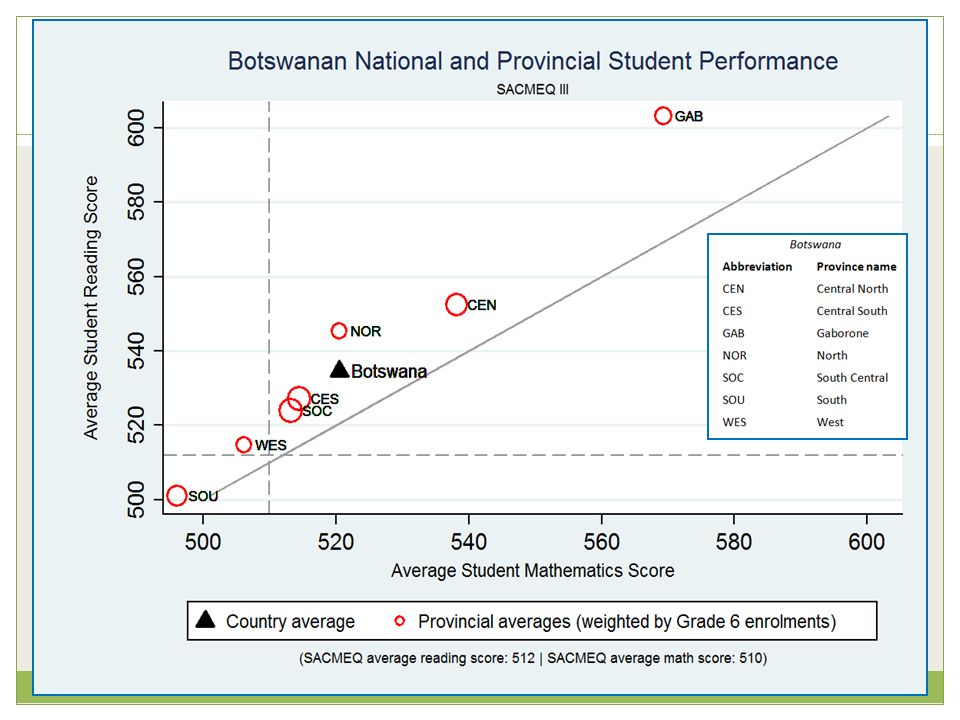
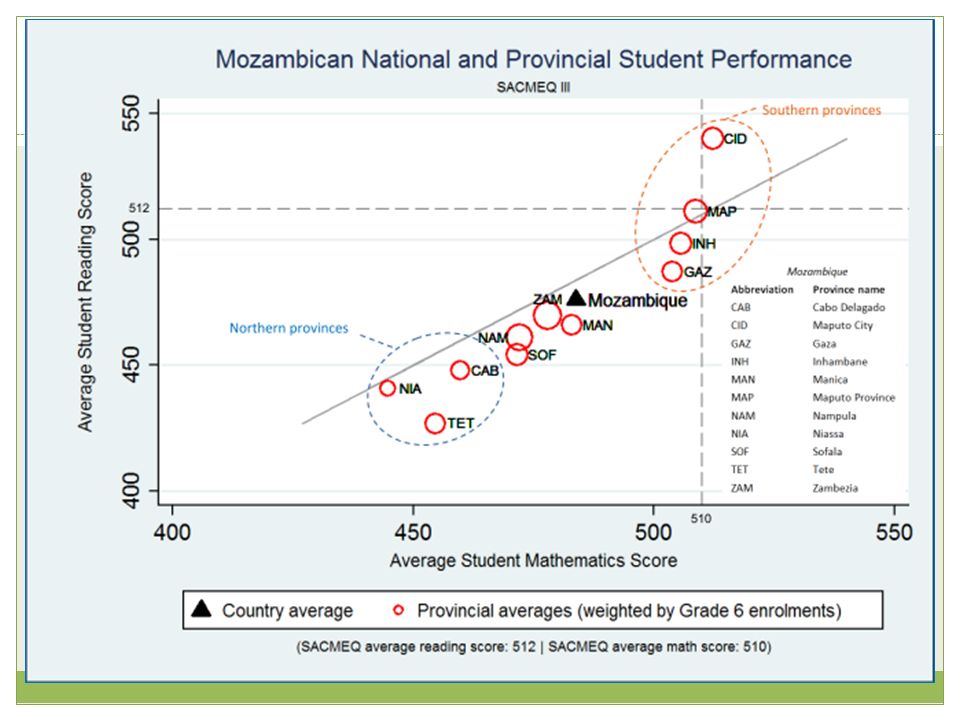
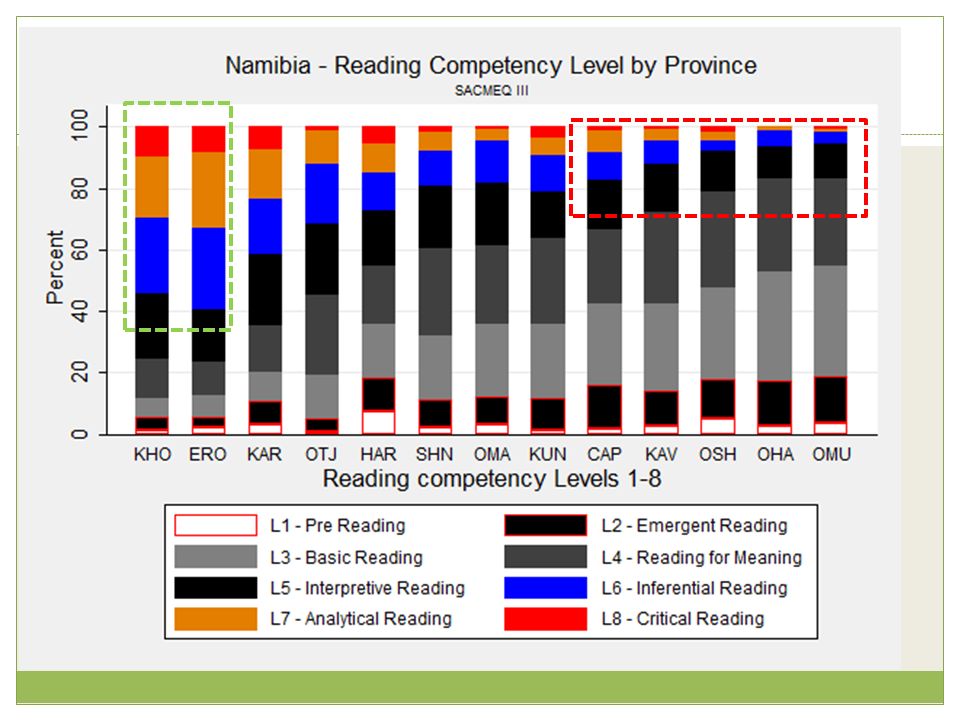
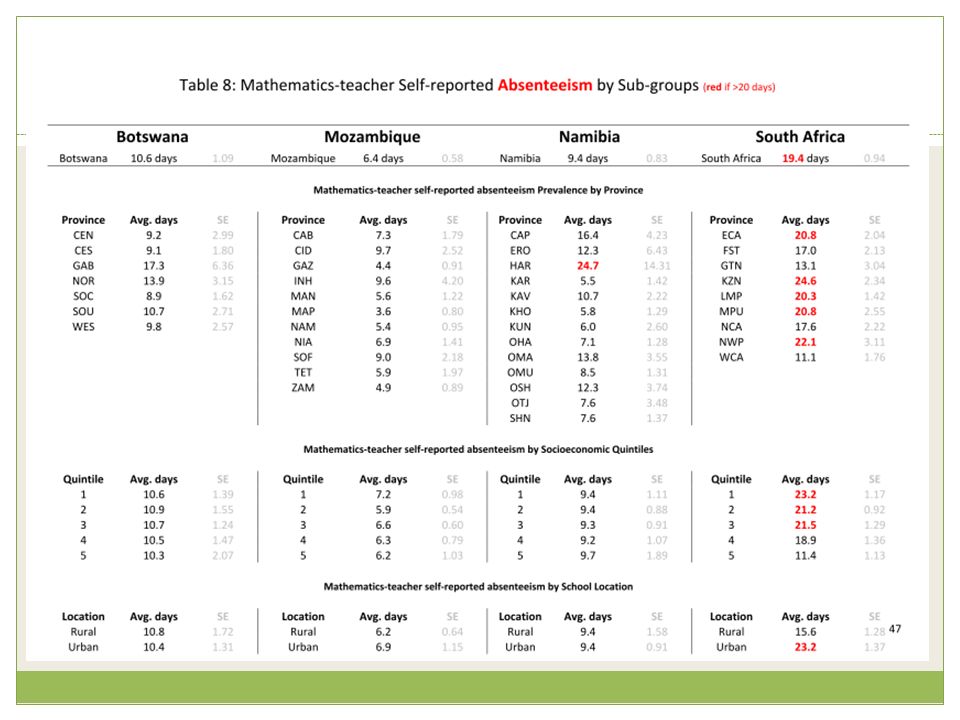
1. High provincial inequality in SA, NAM and MOZ 2. Unacceptably high levels of functional illiteracy/innumeracy in SA, NAM, and MOZ 3. Unacceptably high levels of teacher absenteeism in SA 4. Unacceptably high levels of grade repetiton in MOZ 5. Unacceptably low levels of textbook access in SA + NAM 6. Very low levels of preschool access in Botswana (given its education spend per pupil) 7. Low access to free school meals in Namibia & Mozambique Conclusions
 7. Low access to free school meals in Namibia & Mozambique Conclusions.")
45
1. How is it possible that more Mozambican students have access to their own textbooks than SA /NAM students, and this when SA spends 15 times as much per child than Mozambique? 2. Why do Namibian students do much worse on numeracy tests than on literacy tests? 3. Why is it acceptable in South Africa for teachers to be absent (unjustifiably) for an entire month? 4. Why is preschool education so uncommon in Botswana? (especially given the international research showing cognitive benefits of ECE) 5. For each country, what is the low-hanging fruit? Questions
 for an entire month. 4. Why is preschool education so uncommon in Botswana. (especially given the international research showing cognitive benefits of ECE) 5. For each country, what is the low-hanging fruit. Questions.")
46
GET THE BASICS RIGHT Get all schools in the country to minimum quality standards in both basic infrastructure (water, electricity, desks, and so on) and in educational performance (numeracy and literacy milestones by certain grades); – Set clear and succinct goals that everyone must follow. For example, “Every child will read and write by the age of eight”; also provide parents with feedback on how their children are performing All children should have access to a quality textbook – Textbook campaign + survey schools to check access & use All teachers should be in class teaching for the full school day – Teacher inspectorate Pupils who are mal-nourished should receive free school meals – Roll-out free school meals starting with most under-resourced communities All pupils should attend at least one year of quality preschool education – Define curriculum and resource requirements and train Reception teachers All teachers must have a minimum level of content knowledge in the subjects that they teach – Teacher board exam? Recommendations

47
Quiz on graph interpretation from the paper See handout Complete in groups of 2 or 3

48
Thank you www.nicspaull.com/research nicholasspaull@gmail.com @NicSpaull

Similar presentations


 Nicholas Spaull nicspaull.com/research>")


 Nicholas Spaull nicspaull.com/research 30 th AEAA Conference.>")

