Download presentation
Presentation is loading. Please wait.

1
Economic Contributions of Florida Agriculture, Natural Resources, Food & Kindred Product Manufacturing, Distribution and Service Industries: 2008 Update Alan W. Hodges and Mohammad Rahmani University of Florida Food & Resource Economics Department Gainesville, FL

2
Linkages in a Regional Economy Parts and transportation Utilities Labor Exports Household consumption Value added remanufacturing Backward Linkages Forward Linkages Intermediate Industry Purchases Regional input-output models are used to estimate strength of linkages in a local or regional economy (e.g. IMPLAN Professional).
..")
3
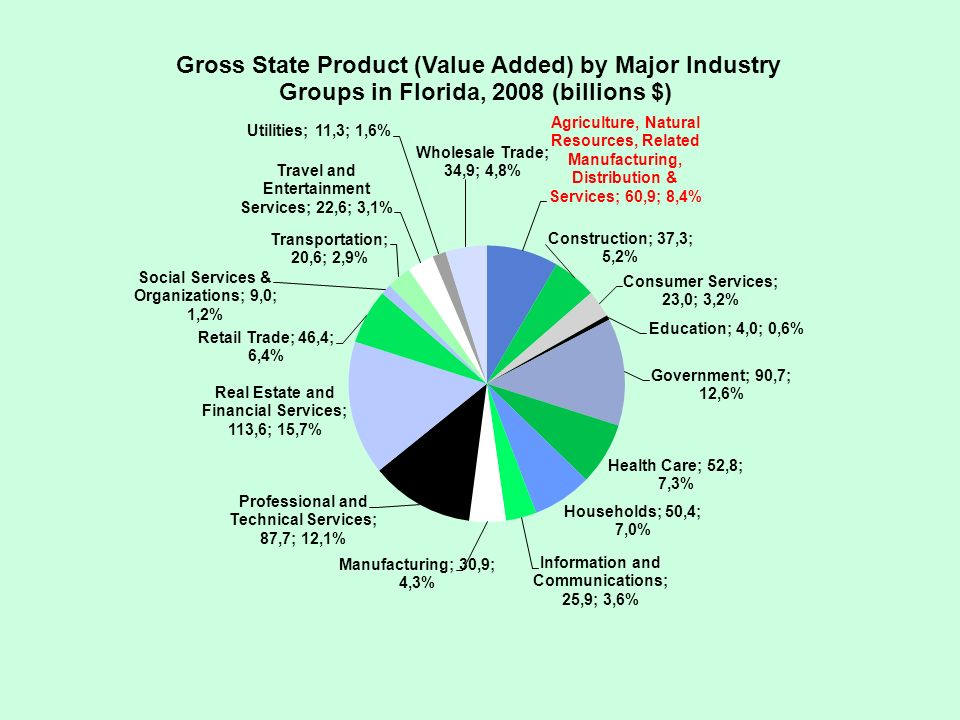
Structure of Florida Agriculture, Natural Resources and Related Industries in 2008 Direct Employment (fulltime & part-time): 1,381,921 Jobs Industry Output (Sales Revenues): $133.6 billion Foreign & Domestic Exports: $32.5 billion Total Employment Impacts: 1,609,139 Jobs Direct Value Added (Personal & Business Net Income): $60.9 billion Total Value Added Impacts: $76.5 billion Values in millions dollars (2008) Source: Implan (MIG, Inc.) Industry Input Purchases Regional multiplier effects Crop, Livestock, Forestry & Fishery Production Mining Food & Kindred Product Manufac- turing Food & Kindred Product Distribution Nature- based Recreation Agricultural Inputs & Services
: 1,381,921 Jobs Industry Output (Sales Revenues): $133.6 billion Foreign & Domestic Exports: $32.5 billion Total Employment Impacts: 1,609,139 Jobs Direct Value Added (Personal & Business Net Income): $60.9 billion Total Value Added Impacts: $76.5 billion Values in millions dollars (2008) Source: Implan (MIG, Inc.) Industry Input Purchases Regional multiplier effects Crop, Livestock, Forestry & Fishery Production Mining Food & Kindred Product Manufac- turing Food & Kindred Product Distribution Nature- based Recreation Agricultural Inputs & Services")
4
Summary of Economic Contributions Florida Agriculture, Natural Resources, Food and Kindred Product Manufacturing, Distribution and Service Industries in 2008 generated… $134 billion in direct output or sales revenues. $29 billion in revenues for other economic sectors due to supply chain and employee spending (multiplier effects). $163 billion in total output (revenue) impacts. $33 billion in foreign and domestic exports and sales to Florida visitors. $61 billion in direct value added or personal and business net income, which represented 8.4 percent of the Gross Domestic Product (GDP) of Florida ($722 billion). $77 billion in total value added impacts (including multiplier effects). 1.38 million fulltime and part-time jobs, ranking second among major industry groups, and representing 13.7 percent of all jobs in the state. 1.61 million jobs in total statewide employment impacts. $9.3 billion in indirect business taxes paid to local, state and federal governments.
. $163 billion in total output (revenue) impacts. $33 billion in foreign and domestic exports and sales to Florida visitors. $61 billion in direct value added or personal and business net income, which represented 8.4 percent of the Gross Domestic Product (GDP) of Florida ($722 billion). $77 billion in total value added impacts (including multiplier effects). 1.38 million fulltime and part-time jobs, ranking second among major industry groups, and representing 13.7 percent of all jobs in the state. 1.61 million jobs in total statewide employment impacts. $9.3 billion in indirect business taxes paid to local, state and federal governments..")
6
Estimates do not include multiplier effects. Source: Implan (MIG, Inc.)
")
7
Economic Contributions of Florida Ag-NR & Related Industry Groups in 2008 Indirect and induced multiplier effects represent supply chain activity and employee household spending. Source: Implan (MIG, Inc.)
.")
8
Source: Implan (MIG, Inc) Economic Contributions of Florida Ag-NR & Related Commodity Groups, 2008
 Economic Contributions of Florida Ag-NR & Related Commodity Groups, 2008")
9
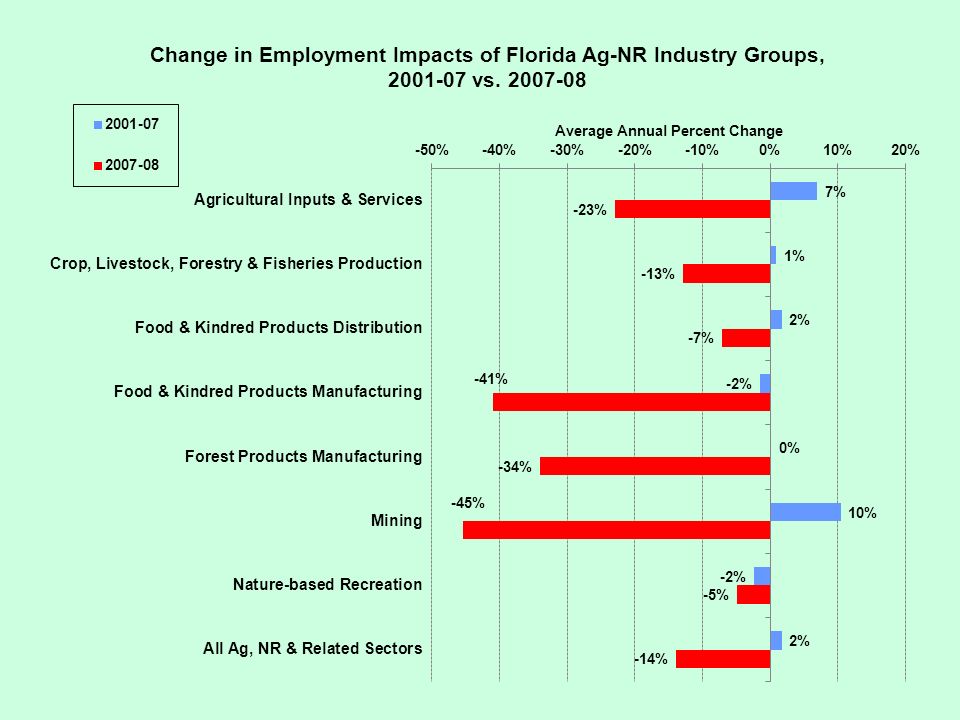
Trends in Employment Impacts of Ag-NR & Related Industry Groups, 2001-08 Estimates include multiplier effects Note: no data available for 2005. Source: Implan (MIG, Inc)
.")
11
Trends in Value Added Impacts of Ag-NR & Related Industry Groups, 2001-06 Values expressed in 2008 dollars using GDP Implicit Price Deflator (US Commerce Dept). Note: no data available for 2005. Estimates include multiplier effects Source: Implan (MIG, Inc)
.")
13
Note: no data available for 2005. Estimates include multiplier effects. Source: Implan (MIG, Inc)
")
14
Note: no data available for 2005. Estimates do not include multiplier effects. Source: Implan (MIG, Inc).
..")
16
Value Added and Employment Impacts of Ag-NR & Related Industries in Florida Regions in 2008 Pensacola Panama City Tallahassee Gainesville Jacksonville Orlando Tampa, St.Petersburg Sarasota, Bradenton Miami, Fort Lauderdale Regions defined according to BEA functional economic areas (U.S. Commerce Dept.). Estimates include multiplier effects. Data Source: Implan (MIG, Inc).
. Estimates include multiplier effects. Data Source: Implan (MIG, Inc)..")
18
Estimates include multiplier effects Source: Implan (MIG, Inc)
")
19
Technical report available at http://edis.ifas.ufl.edu/fe829http://edis.ifas.ufl.edu/fe829 Economic Contributions of Florida Agriculture, Natural Resources, Food & Kindred Product Manufacturing, Distribution and Service Industries in 2008 (Feb. 2010). Other reports and Florida industry economic data available at http://economicimpact.ifas.ufl.eduhttp://economicimpact.ifas.ufl.edu Author contact information: l Alan W. Hodges, 352-392-1881 x312; awhodges@ufl.eduawhodges@ufl.edu l Mohammad Rahmani, 352-392-1881 x315; rahmani@ufl.edurahmani@ufl.edu
. Other reports and Florida industry economic data available at Author contact information: l Alan W. Hodges, x312; l Mohammad Rahmani, x315;")
Similar presentations


 measures the dollar value of all goods and services produced in the U.S. economy in.>")


