Download presentation
Presentation is loading. Please wait.

1
Overview of Databases (TRAINS, IDB, CTS,COMTRADE) operated by UNCTAD-World Bank World Integrated Trade Solution (WITS) Lucian Cernat International Trade Division
 operated by UNCTAD-World Bank World Integrated Trade Solution (WITS) Lucian Cernat International Trade Division")
2
WITS vs Databases WITS is a software which is designed to integrate several trade-related databases and provide easy access Four major databases are currently accessible through WITS

3
Databases of WITS TRAINS (UNCTAD) COMTRADE (UN Statistics Division) Integrated Database (IDB-WTO) Consolidated Tariff Schedule (CTS- WTO)
 COMTRADE (UN Statistics Division) Integrated Database (IDB-WTO) Consolidated Tariff Schedule (CTS- WTO)")
4
Data Accessibility COMTRADE: Free access to International Organizations, others against a fee TRAINS: Access to governments and international and regional organizations, as well as to donors to TRAINS Trust Fund WTO: Access to WTO member governments and selected international organizations

5
Data contents of TRAINS (as of 1 April 2007) Tariff measures at national tariff line level for 161 countries (956 country/years since 1988), including preferential rates such as RTA and GSP in many cases Primary data are drawn from UN TARMAC UN Tariff and Market Access Database A joint effort with the International Trade Centre (ITC)
 Tariff measures at national tariff line level for 161 countries (956 country/years since 1988), including preferential rates such as RTA and GSP in many cases Primary data are drawn from UN TARMAC UN Tariff and Market Access Database A joint effort with the International Trade Centre (ITC)")
6
Data contents of TRAINS (continued) Import statistics by origin at Harmonized System (HS) 6-digit level for every country- year by constructing mirror imports where necessary Non-Tariff Measures classified according to UNCTAD Coding System of Trade Control Measures (97 countries, 150 country/years)
 Import statistics by origin at Harmonized System (HS) 6-digit level for every country- year by constructing mirror imports where necessary Non-Tariff Measures classified according to UNCTAD Coding System of Trade Control Measures (97 countries, 150 country/years)")
7
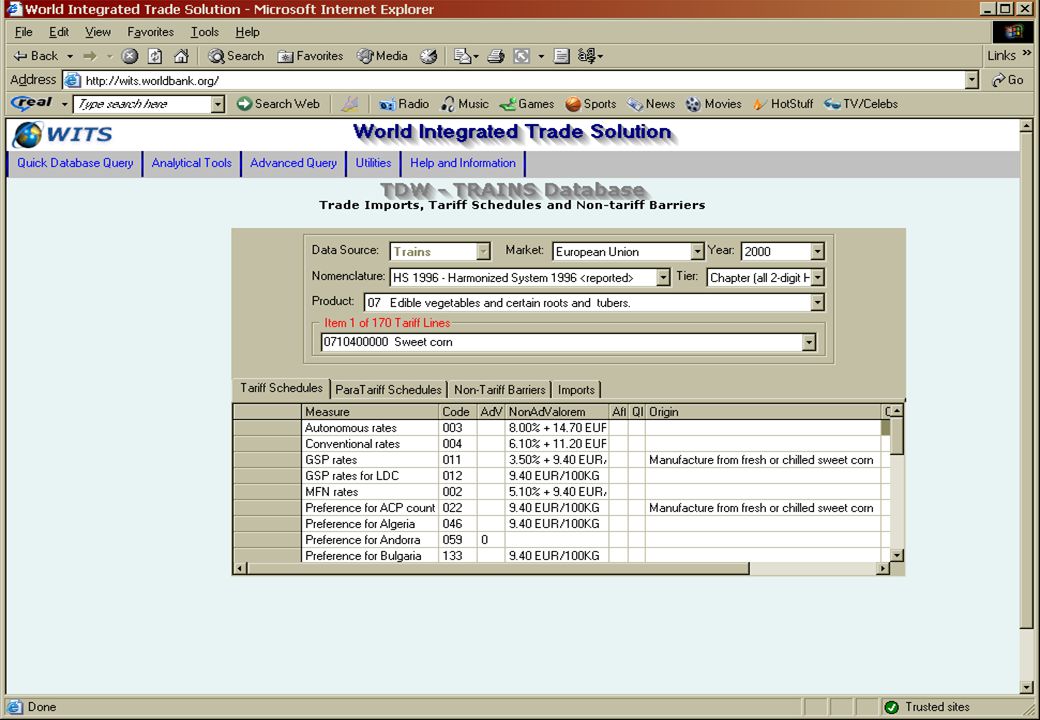
WITS Functionality Data retrieval and analysis Quick query Advanced query Tariff Change Simulations Other options

8
Quick Query Direct access to the Database –By country and/or by product –Export raw data –Extraction by criteria

10
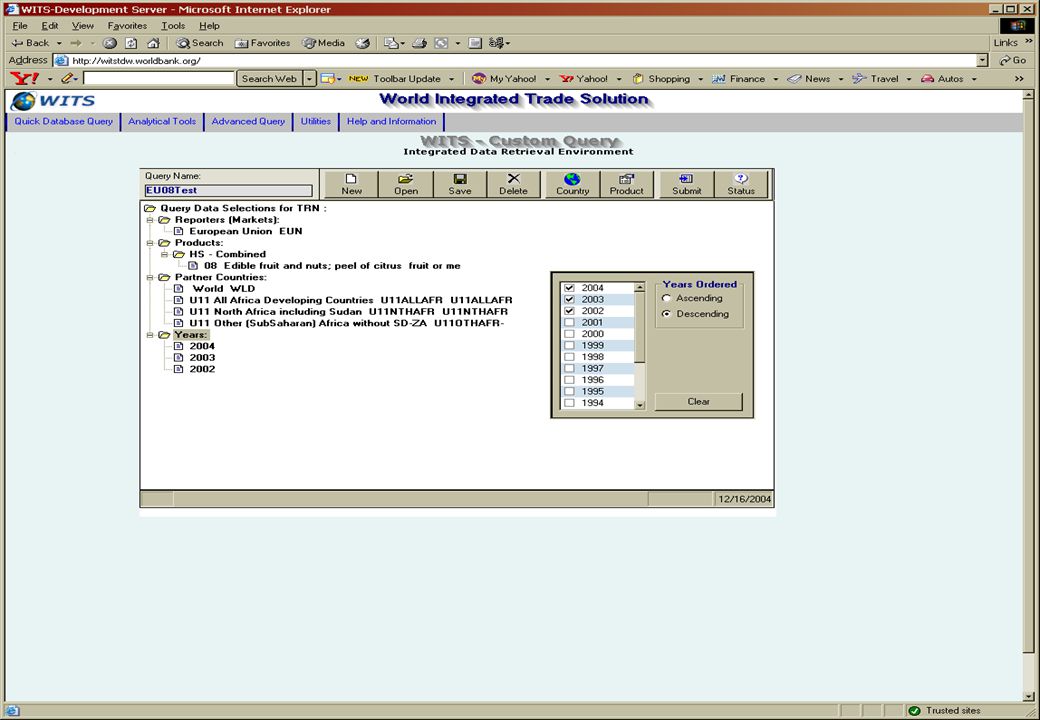
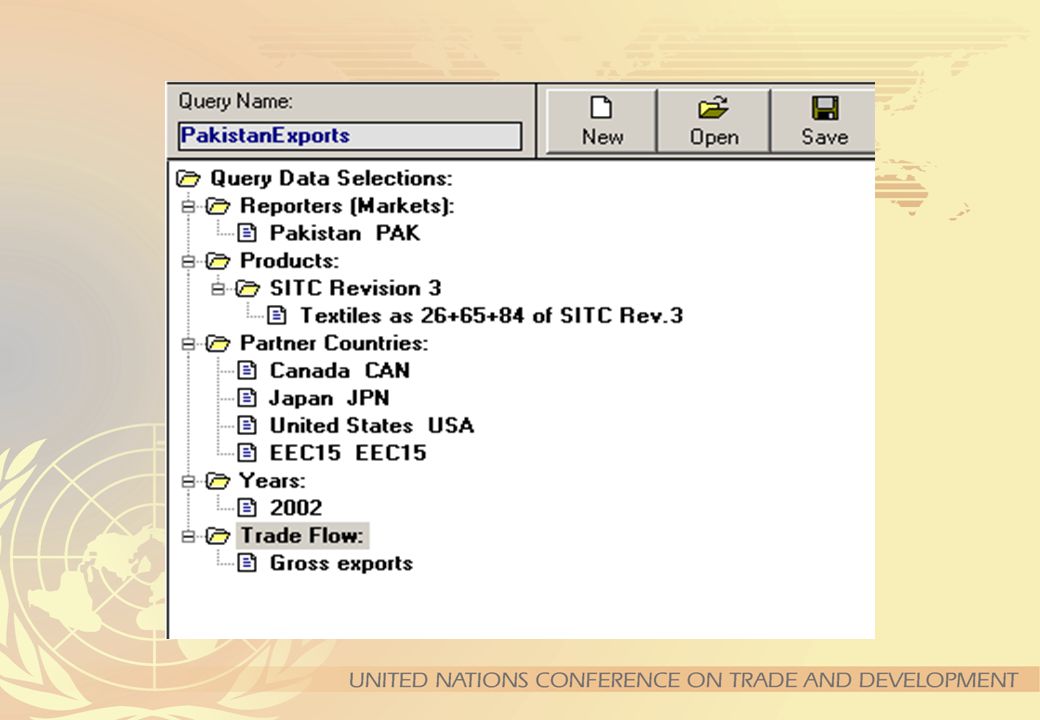
Advanced Query Users construct queries comprising of: –Reporter countries –Products –Partner countries –Years

12
Custom Query – Parameters Reporter Countries –Individual countries or user-defined groups of countries Products –Individual products or user-defined aggregates of products in various product classifications (HS, SITC,ISIC, etc)
")
13
Custom Query – Parameters Partner Countries –Same as Reporter Countries. “World” is treated as an individual country Years – From 1988

14
Custom Query – submission Further options before submitting MFN rates (default), Bound Rates and/or Effectively Applied (preferential) rates Latest available year for each reporter country Substitution of unavailable year with the nearest available year Breakdown of country groups
, Bound Rates and/or Effectively Applied (preferential) rates Latest available year for each reporter country Substitution of unavailable year with the nearest available year Breakdown of country groups")
15
Custom Query – results Main indicators Simple and trade weighted tariff averages Value of imports –Duty free –Dutiable –Non-ad valorem rates Distribution of tariff rates

16
TRADE : ADVANCED QUERIES The Advanced Query is a more complex but more powerful and flexible tool for sophisticated queries : –Can retrieve trade for several years, partners and products with a single query; –Can retrieve aggregated trade for groups of countries or products; The process goes through two steps : –The user defines, saves and submits his query –The server runs the query and notifies when results are ready.

17
Once the Data Source has been selected, a set of folders appears on the top left side of the Query Definition window. Those folders may vary depending on the chosen data source.

18
Click on the Reporters folder. A selection box appears on the right. Selecting Reporters

19
Now, click on the Products folder. The product selection panel appears. Advanced Query offers many possibilities for selecting Products. To get results, you have to use nomenclatures available for the selected reporter(s).
..")
20
Selecting Partners Now, click on the Partner Countries folder. The selection panel appears. It is the same as the one we ’ ve seen for selecting Reporters.

22
Question: –Investigate the existence of tariff peaks and tariff escalation in country group A (USA, Canada, EU and Japan) on silk products originating in developing countries Steps: –Create country aggregates (group A, developing countries) –Create product aggregates (raw, semi finished, finished silk) Go to WITSTariff peaks Tariff escalation Hypothetical Example: Tariff peaks and escalation
 on silk products originating in developing countries Steps: –Create country aggregates (group A, developing countries) –Create product aggregates (raw, semi finished, finished silk) Go to WITSTariff peaks Tariff escalation Hypothetical Example: Tariff peaks and escalation")
23
Raw Yarn Woven Finished Incidence of Tariff Peaks

24
Raw silkSilk yarn Woven silk Finished silk Silk Escalation (Weighted Average Tariffs)
")
25
Part I : Trade statistics – Data extraction tools – Example: tariff peaks and escalation Part II: Trade liberalization simulations – The model: assumptions, parameters, results – Example Contents

26
Tariff Change Simulation ( Single market simulation model) -Trade Creation and Diversion effects -Tariff revenue effect -Welfare effect -Importer and Exporter Views
 -Trade Creation and Diversion effects -Tariff revenue effect -Welfare effect -Importer and Exporter Views")
27
Assumptions: –Each product is independent –A same product from different supplier is an imperfect substitute –Three sets of elasticties (Demand, Supply and Substitution between two suppliers) Tariff Change Simulation ( Single market simulation model)
 Tariff Change Simulation ( Single market simulation model)")
28
Tariff Change Simulation Results of Simulation -First round effect of tariff reduction -No time horizon -No cost of structural adjustment

29
Assumptions –Changes in the demand for imports, as a result of tariff changes –Changes in relative prices among exporters and a change in market shares –Changes in the export supply as a result of tariff/price changes Parameters – Import demand elasticities – literature review – Export supply elasticities – infinite, but this can be changed – Elasticities of substitution - Armington For a detailed description of the SMART model: Laird and Yeats (1986), Karsenty and Vossenaar (1989) Main Assumptions and Parameters
, Karsenty and Vossenaar (1989) Main Assumptions and Parameters")
30
Trade creation (TC) –Increased exports as a results of changes in demand and prices Trade diversion (TD) –Substitution of goods from different exporters(changes in market shares), due to changes in relative prices Total trade effect = TC + TD Other effects –Tariff revenue changes, welfare effects, consumer surplus, price effects (if any) Go to WITS Main Results
 –Increased exports as a results of changes in demand and prices Trade diversion (TD) –Substitution of goods from different exporters(changes in market shares), due to changes in relative prices Total trade effect = TC + TD Other effects –Tariff revenue changes, welfare effects, consumer surplus, price effects (if any) Go to WITS Main Results")
31
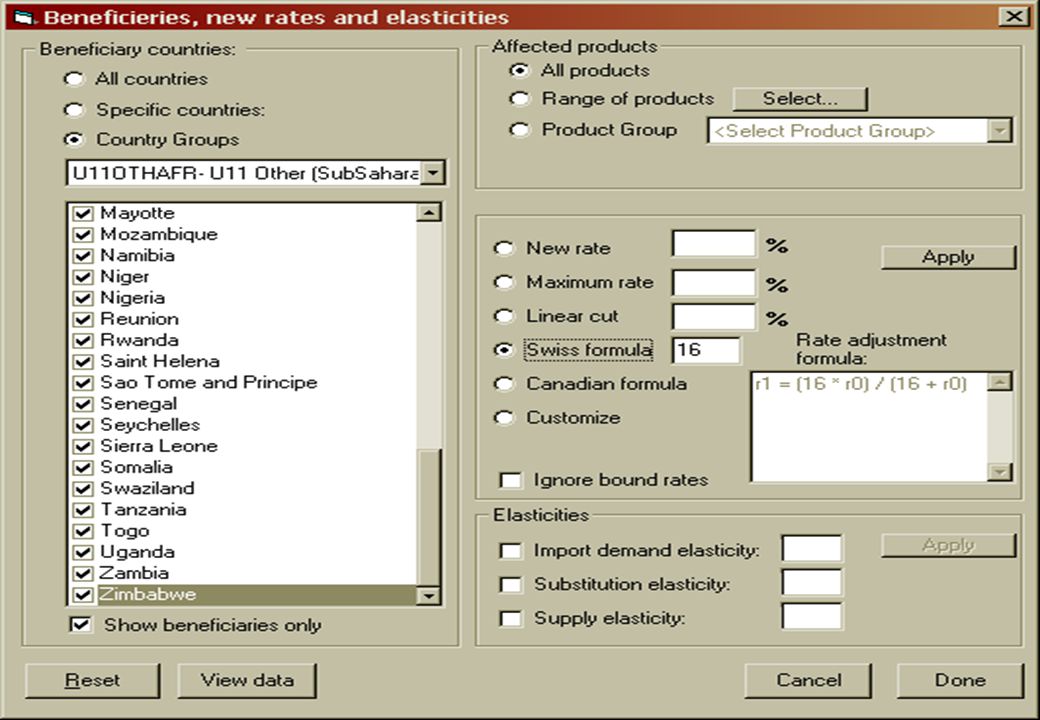
Changes in bound tariffs take effect only when the new bound rate is lower than the old applied rate Tariff cutting options Maximum rate Linear cut Swiss formula Canadian formula User-defined formula Simulations

32
Modified Swiss formula (Francois and Martin) A band approach to maximum rate or linear cut An SDT approach A sectoral approach Other options
 A band approach to maximum rate or linear cut An SDT approach A sectoral approach Other options")
34
New rate = (old rate x p)/(old rate + p) Swiss Formula
/(old rate + p) Swiss Formula")
35
if (r0<=5) Then r1=0 if (r0>100) then r1=100 if (r0>5 and r0<100) Then r1 = (r0*25)/(r0+25) User defined modalities
 Then r1=0 if (r0>100) then r1=100 if (r0>5 and r0<100) Then r1 = (r0*25)/(r0+25) User defined modalities")
36
Example: 20% MFN bound tariff reduction in the US Total trade effect: market share analysis Economist Toolkit Example

38
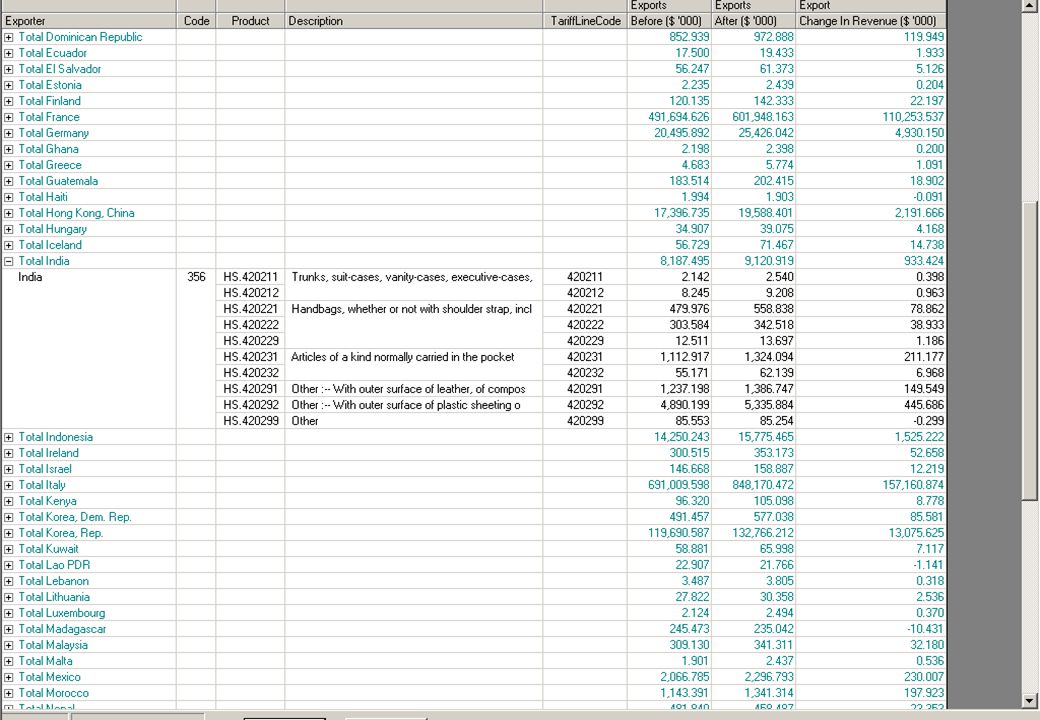
Exporter Analysis

39
Product Analysis

40
Doha Proposals in WITS WTO Doha Proposals” simulates the tariff reduction proposals submitted to the WTO’s Negotiating Group on Market Access. More flexible, user-defined tariff change formula option is under development

41
Improvement for immediate future Multi-market Simulation Model –Incorporation of GSIM model in WITS/TRAINS

42
Computer Requirement –PC of reasonable speed (minimum 200MHZ) –Windows 98, 2000 or XP –Internet Explorer version 5.0 or higher –Internet Access with 50mb of disk space
 –Windows 98, 2000 or XP –Internet Explorer version 5.0 or higher –Internet Access with 50mb of disk space")
43
How to Install WITS Register at http://wits.worldbank.org/witsweb Receive userid and password via e-mail Download installation file from http://wits.worldbank.org/install.htm Install

44
CONTACT Trade Information Section UNCTAD/DITC/TAB Palais des Nations 1211 Geneva 10, Switzerland E-mail: wits@unctad-trains.org Fax: +41 22 917 0044

Similar presentations


 TARIFFSAND TARIFF STRUCTURES.>")