Download presentation
Presentation is loading. Please wait.

1
AN EMPIRICAL INVESTIGATION ON THE RELATIONSHIP BETWEEN ONSHORE AND OFFSHORE RUPEE MARKET GAUTAM JAIN, PALANISAMY SARAVANAN, SHARAD NATH BHATTACHARYA 1

2
OBJECTIVES To analyse the movement of exchange rate in all the three markets that is spot, forward and Non-delivery forward market (Singapore) To study the causal relationship between the three currency markets i.e. spot market, forward market and NDF market To study the dynamics of the relationship by breaking the period into sub-periods and analysing the causal relationship among the three markets To understand the cause of break point by looking at various macroeconomic events and policy decisions taken by central bank 2

3
INTRODUCTION In two years Indian currency has depreciated its value by approximately around 15 rupees and hence became one of the most volatile currencies in the recent period The nominal value of rupee has depreciated nearly 27.68% in the period 2004-05 to 2013-14 3

4
FOREIGN EXCHANGE MARKETS AND THEIR DEPTHS Net-net basis, daily averages in April, in billions of US dollars Instrument199820012004200720102013 Foreign exchange instruments1,5271,2391,9343,3243,9715,345 Spot transactions5683866311,0051,4882,046 Outright forwards128130209362475680 Foreign exchange swaps7346569541,7141,7592,228 Currency swaps10721314354 Options and other products8760119212207337 Global foreign exchange market turnoverForeign exchange trading currency wise scenario in billions of US dollars Total Spot transactions Outright forwards Foreign exchange swaps Currency swaps FX options Total5,3452,0466802,22854337 USD4,6521,6915882,03050293 EUR1,7867541787661870 JPY1,23161212333211153 GBP63122769301529 INR5315241003 Currency distribution of global foreign exchange market turnover in billions of US dollars Currency 2004 2007 2010 2013 ShareRankShareRankShareRankShareRank USD 88.0 1 85.6 1 84.9 1 87.01 EUR 37.4 2 37.0 2 39.1 2 33.42 JPY 20.8 3 17.2 3 19.0 3 23.03 GBP 16.5 4 14.9 4 12.9 4 11.84 AUD 6.0 6 6.6 6 7.6 5 8.65 CHF 6.0 5 6.8 5 6.3 6 5.26 CAD 4.2 7 4.3 7 5.3 7 4.67 BRL 0.3 21 0.4 21 0.7 21 1.119 INR 0.3 20 0.7 19 1.0 15 1.020 Offshore trading of emerging market currencies, 2013 Offshore turnover (daily) Offshore share in global turnover Share of regional financial centers (Hongkong, Singapore) UKUS Euro zone USD bnIn percent Emerging market currencies678.767.4-29.916.44.6 Emerging Asian currencies277.259.225.318.88.42.6 Chinese renminbi86.17243.7185.81.5 Hong Kong dollar40.752.68.122.98.95.1 Singapore dollar48.865.411.427.815.53.7 Korean won27.442.721.111.37.11.5 Indian rupee285326.915.18.51.1 4 Source : BIS
 Offshore share in global turnover Share of regional financial centers (Hongkong, Singapore) UKUS Euro zone USD bnIn percent Emerging market currencies Emerging Asian currencies Chinese renminbi Hong Kong dollar Singapore dollar Korean won Indian rupee Source : BIS")
5
LITERATURE REVIEW The focus of various studies i.e. Ludwig et al (2004), Pedroni et al (2004), Case et al (2001) was mainly on spillovers within equity, fixed income securities and foreign exchange markets Park (2001) examined the impact of financial deregulation on relationship between onshore and offshore market of Korean won and concluded that the interrelationship is dynamic and varies with the extent of deregulation in the foreign exchange market and liberalisation of capital flows. He argued that in the Korean economy with a managed float exchange rate and restriction on capital flows, movements in the domestic spot market influences the NDF market. This was reversed as exchange rate policy was shifted to free float and capital flow restrictions were reduced. The domestic market was mainly driven by offshore NDF market where price innovations originated Wang et al (2007) shows that the NDF market seems to be the driver for the domestic spot market of Korean won, while for Taiwanese dollar, it is the spot market which contains more information and influences the NDF market Ma et al (2004) provide evidence that volatility in NDF currency rates has been higher than that in local spot markets for six Asian currencies namely Chinese renminbi, Indian rupee, Indonesian rupiah, Korean won, Philippine peso and New Taiwan dollar Colavecchio et al. (2008) finds that offshore markets are important in price discovery process, particularly in Asian countries. It is concluded that NDF markets do have significant impact on onshore markets. He emphasized that until full capital convertibility is achieved, NDF market rates and activity are important information signal and thus need to be monitored by investors and regulators 5
, Pedroni et al (2004), Case et al (2001) was mainly on spillovers within equity, fixed income securities and foreign exchange markets Park (2001) examined the impact of financial deregulation on relationship between onshore and offshore market of Korean won and concluded that the interrelationship is dynamic and varies with the extent of deregulation in the foreign exchange market and liberalisation of capital flows. He argued that in the Korean economy with a managed float exchange rate and restriction on capital flows, movements in the domestic spot market influences the NDF market. This was reversed as exchange rate policy was shifted to free float and capital flow restrictions were reduced. The domestic market was mainly driven by offshore NDF market where price innovations originated Wang et al (2007) shows that the NDF market seems to be the driver for the domestic spot market of Korean won, while for Taiwanese dollar, it is the spot market which contains more information and influences the NDF market Ma et al (2004) provide evidence that volatility in NDF currency rates has been higher than that in local spot markets for six Asian currencies namely Chinese renminbi, Indian rupee, Indonesian rupiah, Korean won, Philippine peso and New Taiwan dollar Colavecchio et al. (2008) finds that offshore markets are important in price discovery process, particularly in Asian countries. It is concluded that NDF markets do have significant impact on onshore markets. He emphasized that until full capital convertibility is achieved, NDF market rates and activity are important information signal and thus need to be monitored by investors and regulators 5.")
6
LITERATURE REVIEW In India context there are only few studies, Sangita Misra and Harendra Behera (2006), they found out that NDF market is generally influenced by spot and forward markets and the volatility spillover effect exists from spot and forward markets to NDF market. Research was also done for volatility spillover in the opposite direction, i.e., from NDF to spot market, though it was found that the extent of spill over is marginal Behera et al. (2008) empirically explores the relationship between Central Bank intervention and exchange rate behaviour in the Indian foreign exchange market and found that the intervention of the RBI is effective in reducing volatility in the Indian foreign exchange market. In this study also while studying the relationship among spot exchange rate, domestic forward exchange rate, off-shore exchange rate is conditional upon intervention done by RBI to curb the volatility and on various macroeconomic shocks such global financial crisis Guru (2009) also finds somewhat similar evidence on interdependencies between the NDF and onshore segments (spot and forward) of rupee market. It is argued that dynamics of relationship between onshore and offshore markets has undergone a change with the introduction of the currency future market in 2008 and returns in NDF market seem to be influencing the domestic spot as well as forward market 6
 empirically explores the relationship between Central Bank intervention and exchange rate behaviour in the Indian foreign exchange market and found that the intervention of the RBI is effective in reducing volatility in the Indian foreign exchange market. In this study also while studying the relationship among spot exchange rate, domestic forward exchange rate, off-shore exchange rate is conditional upon intervention done by RBI to curb the volatility and on various macroeconomic shocks such global financial crisis Guru (2009) also finds somewhat similar evidence on interdependencies between the NDF and onshore segments (spot and forward) of rupee market. It is argued that dynamics of relationship between onshore and offshore markets has undergone a change with the introduction of the currency future market in 2008 and returns in NDF market seem to be influencing the domestic spot as well as forward market 6.")
7
LITERATURE REVIEW Sharma (2011) focuses on the relationship between volatility in the exchange rate in the spot market and trading activity in the currency futures. The results show that there is a two-way causality between the volatility in the spot exchange rate and the trading activity in the currency futures market. The period for analysis was taken from 2007 to 2010 without any structural breaks whereas proxy for the futures trading activity, the values of futures daily trading volume and futures open interest were used Goyal, et al. (2013) concluded that there exists a bidirectional relationship between onshore and NDF markets and relationship is bidirectional but that bidirectional relationship turns unidirectional from NDF to onshore during the period when rupee comes under downward pressure 7
 concluded that there exists a bidirectional relationship between onshore and NDF markets and relationship is bidirectional but that bidirectional relationship turns unidirectional from NDF to onshore during the period when rupee comes under downward pressure 7.")
8
METHODOLOGY The time period for the study is from January 2002 to February 2014. All the data series is monthly in nature making total 146 observations. Data pertaining to Indian market is extracted from RBI publications. Data of Singapore market is collected from Reuter’s database The study uses Toda &Yamamoto (1995) test which is a modified Wald test for restriction on the parameters of the VAR (p) with p being the lag length of the VAR system. In their approach the correct order of the system (p) is augmented by the maximal order of integration (m). It is in terms of avoiding integration and complexity that this study adopts the Toda and Yamamoto (1995) procedure to improve the power of the Granger-Causality test . Toda and Yamamoto procedure is a methodology of statistical inference, which makes parameter estimation valid even when the VAR system is not co-integrated One advantage of Toda and Yamamoto procedure is that it makes Granger-Causality test easier. Researchers do not have to test cointegration or transform VAR into ECM 8
 test which is a modified Wald test for restriction on the parameters of the VAR (p) with p being the lag length of the VAR system. In their approach the correct order of the system (p) is augmented by the maximal order of integration (m). It is in terms of avoiding integration and complexity that this study adopts the Toda and Yamamoto (1995) procedure to improve the power of the Granger-Causality test . Toda and Yamamoto procedure is a methodology of statistical inference, which makes parameter estimation valid even when the VAR system is not co-integrated One advantage of Toda and Yamamoto procedure is that it makes Granger-Causality test easier. Researchers do not have to test cointegration or transform VAR into ECM 8.")
9
METHODOLOGY Suppose one want to see if Y affects X or vice-versa then he has to test the null hypothesis with the model as shown below For the above, Null hypothesis: α 1 (12) = α 2 (12) = α 3 (12) = ….. α k (12) = 0 where α (12) are the coefficients of X. If the null hypothesis is rejected, then the one-way effect can be confirmed Augmented Dickey Fuller (ADF) test is done to check the Stationarity of the series. If the series are not stationary at levels, the order of Integration for each series is obtained and the maximum order is considered as d 9
 = 0 where α (12) are the coefficients of X. If the null hypothesis is rejected, then the one-way effect can be confirmed Augmented Dickey Fuller (ADF) test is done to check the Stationarity of the series. If the series are not stationary at levels, the order of Integration for each series is obtained and the maximum order is considered as d 9.")
10
STATIONARITY CHECK All the three series are Non-stationary in nature as shown below, the Augmented Dickey-Fuller The result above shows that all the three series are of I(1) in nature since the 1st difference of all the three series is stationary (P-value < 0.05). However this will not affect the T-Y procedure to examine the granger causality The ADF test without intercept and without Trend The ADF test with intercept and without Trend The ADF test with intercept and with Trend Series ADF test statisticP-value LnSpotLevel-0.83010.3470 First Difference-8.4600.000 LnNDFLevel-0.80520.3656 First Difference-8.6200.000 LnFWLevel-0.83860.3510 First Difference-9.8530.000 Series ADF test statisticP-value LnSpotLevel-2.81280.0589 First Difference-8.4810.000 LnNDFLevel-2.71400.0740 First Difference-8.6440.000 LnFWLevel-2.74400.0691 First Difference-9.8690.000 Series ADF test statisticP-value LnSpotLevel-2.29950.4312 First Difference-8.6750.000 LnNDFLevel-2.14900.5135 First Difference-8.8480.000 LnFWLevel-2.13510.5215 First Difference-10.0830.000 10

11
RELATIONSHIP BETWEEN SPOT MARKET AND NDF MARKET VAR model was setup in the levels of data to determine the appropriate lag length. With NDF exchange rate and spot exchange rate as endogenous variable and constant as exogenous variable two out of three information criteria says that lag of 2 is appropriate However to remove the serial correlation present in the residuals lag of three was selected. The results of lag autocorrelation LM test shows that there is no serial correlation at lag length of three LagLogLLRFPEAICSCHQ 0722.3893NA1.00E-07-10.4404-10.398-10.4232 11223.175979.79777.48E-11-17.6402-17.5129-17.5885 21256.86464.938054.87E-11-18.0705-17.85838*-17.98430* 31262.25910.24226* 4.77e- 11*-18.09071*-17.7938-17.97 41264.0723.3892834.92E-11-18.059-17.6772-17.9039 51267.1095.590614.99E-11-18.0451-17.5784-17.8554 61269.3534.064575.13E-11-18.0196-17.4681-17.7955 71272.1194.9300445.22E-11-18.0017-17.3654-17.7431 81272.510.6866475.51E-11-17.9494-17.2282-17.6563 Autocorrelation LM test (Spot market and NDF market) Lag length Criteria (Spot market and NDF market) LagsLM-StatProb. 14.5911020.3319 25.8082910.2139 30.4714020.9762 44.7534190.3135 11
 Lag length Criteria (Spot market and NDF market) LagsLM-StatProb")
12
RELATIONSHIP BETWEEN SPOT MARKET AND NDF MARKET VAR Granger Causality/Block Exogeneity Wald Tests Sample: 1 146 Dependent variable: NDF ExcludedChi-sqDfProb. Spot11277.4430 Dependent variable: spot ExcludedChi-sqDfProb. NDF5.44584430.1419 Model is stable since all the roots are within unit circle. From the upper panel of Table, we see that we can reject the null of no causality from spot to NDF. From the lower panel we see that we cannot reject the null of no causality from NDF to spot, at the 5% Significance level VAR Granger Causality (Spot market and NDF market) 12
 12.")
13
RELATIONSHIP BETWEEN SPOT MARKET AND NDF MARKET It is customary to check for the structural break in the model. Therefore the system of VAR (p) model was created and tested with Quandt Andrews break point test with 5% trimmed data. The result shows that 67 th observation has maximum value of LR F- statistic, which was verified by doing chow test and it was found that there is a break in the model at 67 th observation (2008 (Sept)) The split analysis has given an interesting observation that for the period 2008 (August) to 2014 (Feb) there is two way causal relationship since the P-value is 0 and 0.0368 but for the period 2002(Jan) to 2008 (Aug) there is only unidirectional causal relationship i.e. from spot to NDF but not vice-versa VAR Granger Causality/Block Exogeneity Wald Tests Sample: 1 66 Dependent variable: NDF ExcludedChi-sqDfProb. Spot5948.24130 Dependent variable: Spot ExcludedChi-sqDfProb. NDF8.493630.0368 Sample: 68 146 Dependent variable: NDF ExcludedChi-sqDfProb. Spot4056.47330 Dependent variable: Spot ExcludedChi-sqDfProb. NDF0.332730.9538 VAR Granger Causality (2008 (Aug.) to 2014 (Feb.) VAR Granger Causality (2002 (Jan.) to 2008 (Aug.) 13
 model was created and tested with Quandt Andrews break point test with 5% trimmed data. The result shows that 67 th observation has maximum value of LR F- statistic, which was verified by doing chow test and it was found that there is a break in the model at 67 th observation (2008 (Sept)) The split analysis has given an interesting observation that for the period 2008 (August) to 2014 (Feb) there is two way causal relationship since the P-value is 0 and but for the period 2002(Jan) to 2008 (Aug) there is only unidirectional causal relationship i.e. from spot to NDF but not vice-versa VAR Granger Causality/Block Exogeneity Wald Tests Sample: 1 66 Dependent variable: NDF ExcludedChi-sqDfProb. Spot Dependent variable: Spot ExcludedChi-sqDfProb. NDF Sample: Dependent variable: NDF ExcludedChi-sqDfProb. Spot Dependent variable: Spot ExcludedChi-sqDfProb. NDF VAR Granger Causality (2008 (Aug.) to 2014 (Feb.) VAR Granger Causality (2002 (Jan.) to 2008 (Aug.) 13.")
14
RELATIONSHIP BETWEEN SPOT MARKET AND NDF MARKET On 2008 (Sept) Lehman Bros. collapsed and the inter-connected world was in financial crisis with the value of currencies falling and Indian rupee also started feeling pressure till RBI intervened The slew of measures taken in 2011-2012 by RBI has created constraints in the domestic forward market and has therefore propelled market participants to take position in the off-shore market. It can be observed that the global Turnover of Indian rupee has increased from 23.6 billion U.S. dollars in 2007 to 52.8 billion U.S. dollars in 2013 i.e. an increase of 123% which is a very huge increase as compared to all the emerging markets except china. This recent increase in the depth of the market can be the reason of its influence to the spot market 14

15
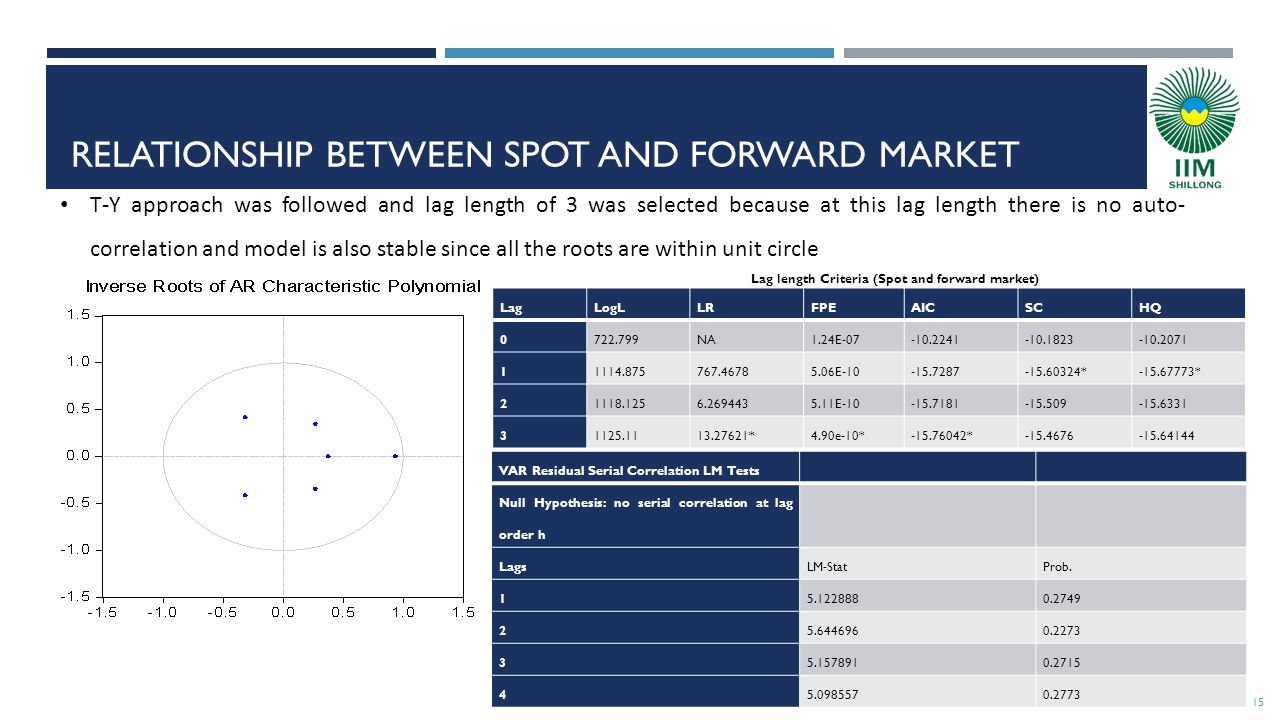
RELATIONSHIP BETWEEN SPOT AND FORWARD MARKET LagLogLLRFPEAICSCHQ 0722.799NA1.24E-07-10.2241-10.1823-10.2071 11114.875767.46785.06E-10-15.7287-15.60324*-15.67773* 21118.1256.2694435.11E-10-15.7181-15.509-15.6331 31125.1113.27621*4.90e-10*-15.76042*-15.4676-15.64144 Lag length Criteria (Spot and forward market) T-Y approach was followed and lag length of 3 was selected because at this lag length there is no auto- correlation and model is also stable since all the roots are within unit circle VAR Residual Serial Correlation LM Tests Null Hypothesis: no serial correlation at lag order h LagsLM-StatProb. 15.1228880.2749 25.6446960.2273 35.1578910.2715 45.0985570.2773 15
16
RELATIONSHIP BETWEEN SPOT AND FORWARD MARKET VAR Granger Causality/Block Exogeneity Wald Tests Included observations: 142 Dependent variable: Forward Rate ExcludedChi-sqDfProb. Spot1363.2530 Dependent variable: Spot ExcludedChi-sqDfProb. Forward Rate13.112830.0044 From the upper panel of results, we see that we can reject the null of no causality from spot to Forward market. From the lower panel we see that we can reject the null of no causality from Forward to spot, at the 5% Significance level. This implies that spot and forward market both has an impact on each other VAR Granger Causality (Spot and forward market) 16
 16.")
17
RELATIONSHIP BETWEEN SPOT AND FORWARD MARKET The split period analysis shows that the till 2012-2013 financial year there was a bidirectional causal relationship between the two markets but now in the last one year the relationship is unidirectional i.e. causal relationship exists only from spot to forward rate VAR (p) model was tested for structural break points and for this purpose Quandt Andrews break point test with 5% trimmed data was performed. It was found that there is a break point in the series at an observation number 13 i.e. 2013 (Feb). This observation was further verified by chow test and it was concluded that there is a break in the model at 13 th observation. The study was further divided into two parts VAR Granger Causality/Block Exogeneity Wald Tests Dependent variable: Forward Rate ExcludedChi-sqdfProb. Spot51900.0530 Dependent variable: Spot ExcludedChi-sqdfProb. Forward Rate0.1506730.9851 VAR Granger Causality/Block Exogeneity Wald Tests Dependent variable: Forward Rate ExcludedChi-sqdfProb. Spot1847.0130 Dependent variable: Spot ExcludedChi-sqdfProb. Forward Rate16.6630.0008 VAR Granger Causality (2013 (Jan.) to 2014 (Feb.) ) VAR Granger Causality (2002 (Jan) to 2013 (Feb.) ) 17
 model was tested for structural break points and for this purpose Quandt Andrews break point test with 5% trimmed data was performed. It was found that there is a break point in the series at an observation number 13 i.e (Feb). This observation was further verified by chow test and it was concluded that there is a break in the model at 13 th observation. The study was further divided into two parts VAR Granger Causality/Block Exogeneity Wald Tests Dependent variable: Forward Rate ExcludedChi-sqdfProb. Spot Dependent variable: Spot ExcludedChi-sqdfProb. Forward Rate VAR Granger Causality/Block Exogeneity Wald Tests Dependent variable: Forward Rate ExcludedChi-sqdfProb. Spot Dependent variable: Spot ExcludedChi-sqdfProb. Forward Rate VAR Granger Causality (2013 (Jan.) to 2014 (Feb.) ) VAR Granger Causality (2002 (Jan) to 2013 (Feb.) ) 17.")
18
RELATIONSHIP BETWEEN SPOT AND FORWARD MARKET The result is perfectly explaining the fact that the steps taken by RBI after the U.S. downgrade in 2011 August which prompted decline in emerging market currencies has helped to curb the Volatility and unidirectional speculative pull RBI took measures which has helped to prevent the spill over effect from forward market to spot market. That is why in the period 2013-2014 there is no causality relationship from forward market to spot market which was present in the earlier period The causal relationship from spot market to forward market exists because of the technical reason as the underlying asset in forward is U.S. dollar which is apparently the future spot price. This major step is one of the reasons that there is structural break in the model 18

19
MEASURES TAKEN BY RBI AIMED AT CURBING SPECULATIVE ATTACKS Rebooking of cancelled forward contracts involving the rupee booked by residents to hedge transactions has not been permitted The facility for importers availing themselves of the past performance facility was reduced to 25 per cent of the average of actual import/export turnover of the previous three financial years or the actual import/export turnover of the previous year, whichever is higher Transactions undertaken by Authorised Dealers (ADs) on behalf of clients are for actual remittances/delivery only and cannot be cancelled/cash settled Rebooking of cancelled forward contracts booked by FIIs is not permitted The Net Overnight Open Position Limits (NOOPL) and intra-day open position/daylight limit of AD banks has been reduced Positions taken by banks in currency futures/options cannot be offset by undertaking positions in the OTC market. The NOOPL of the banks as applicable to the positions involving the rupee as one of the currencies would not include positions taken by banks on the exchanges 19

20
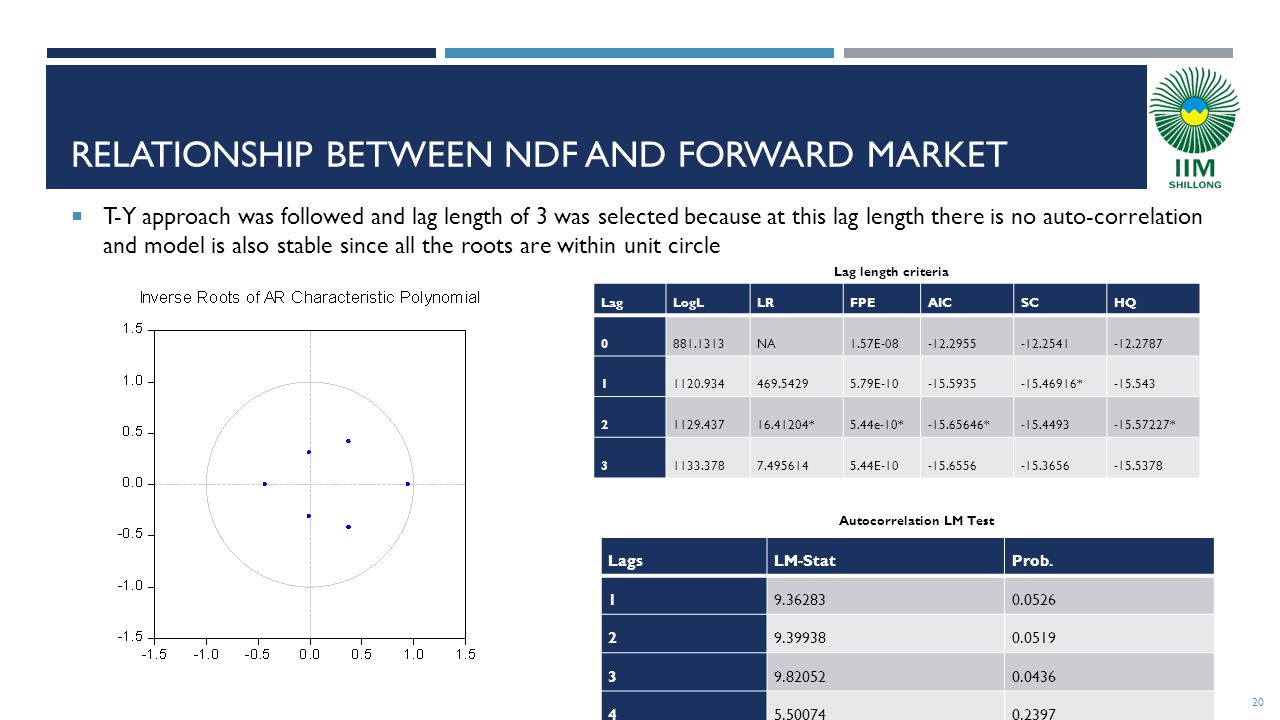
RELATIONSHIP BETWEEN NDF AND FORWARD MARKET T-Y approach was followed and lag length of 3 was selected because at this lag length there is no auto-correlation and model is also stable since all the roots are within unit circle LagLogLLRFPEAICSCHQ 0881.1313NA1.57E-08-12.2955-12.2541-12.2787 11120.934469.54295.79E-10-15.5935-15.46916*-15.543 21129.43716.41204*5.44e-10*-15.65646*-15.4493-15.57227* 31133.3787.4956145.44E-10-15.6556-15.3656-15.5378 Lag length criteria Autocorrelation LM Test LagsLM-StatProb. 19.362830.0526 29.399380.0519 39.820520.0436 45.500740.2397 20
21
RELATIONSHIP BETWEEN NDF AND FORWARD MARKET VAR Granger Causality/Block Exogeneity Wald Tests Included observations: 142 Dependent variable: NDF Rate ExcludedChi-sqDfProb. Forward7.845930.0493 Dependent variable: Forward ExcludedChi-sqDfProb. NDF Rate21.08630.0001 The results shows that there exists a causal relationship from NDF market to Forward market since P-value is 0.0001 but the causal relationship from forward market to NDF market is significant just at the margin with p- value of 0.0493 VAR Granger Causality (NDF and Forward market) 21
 21.")
22
RELATIONSHIP BETWEEN NDF AND FORWARD MARKET VAR (p) model was tested for structural break points and for this purpose Quandt Andrews break point test with 5% trimmed data was performed. It was found that there are 9 break points in the model at an observation number 12, 27, 33,42,43,47,48,66,84,121. These observations were further verified by chow test and it was concluded that break points do exist at these places VAR Granger Causality/Block Exogeneity Wald Tests Sample: 1 27 Included observations: 23 Dependent variable: NDF ExcludedChi-sqdfProb. Forward Rate1.48761430.6851 Dependent variable: Forward Rate ExcludedChi-sqdfProb. NDF6.02796730.1103 VAR Granger Causality (2011 (Dec.) to 2014 (Feb.)) VAR Granger Causality/Block Exogeneity Wald Tests Sample: 28 50 Included observations: 23 Dependent variable: NDF ExcludedChi-sqdfProb. Forward Rate27.3378130 Dependent variable: Forward Rate ExcludedChi-sqDfProb. NDF18.735193 0.000 3 VAR Granger Causality (2011(Nov.) to 2010(Jan.)) 22
 to 2014 (Feb.)) VAR Granger Causality/Block Exogeneity Wald Tests Sample: Included observations: 23 Dependent variable: NDF ExcludedChi-sqdfProb. Forward Rate Dependent variable: Forward Rate ExcludedChi-sqDfProb. NDF VAR Granger Causality (2011(Nov.) to 2010(Jan.)) 22.")
23
RELATIONSHIP BETWEEN NDF AND FORWARD MARKET The results clearly shows that there exists no causality between the NDF market and Forward market in the period of 2011(Dec) to 2014(Feb.). This again is due to the fact that RBI intervention in the forward market has restricted many speculative players to take position in the Forward market From 2011(Nov) to 2010(Jan) and it was found that there was causal relationship between the NDF market and Forward market. This is the period before RBI intervened hence in this period there was flow of information from Off- shore market to domestic market and vice-versa From 2009 (Dec.) to 2008 (Sept.) i.e. when the world was in crisis after the collapse of Lehman and it was found there exists causal relationship between the NDF market and Forward market For 2007(March) to 2004(March)This period shows that no causal relationship exists between NDF and Forward market as P-value > 0.05, therefore enough evidence is not there to not to reject the Null Hypothesis of no causality 23
 to 2010(Jan) and it was found that there was causal relationship between the NDF market and Forward market. This is the period before RBI intervened hence in this period there was flow of information from Off- shore market to domestic market and vice-versa From 2009 (Dec.) to 2008 (Sept.) i.e. when the world was in crisis after the collapse of Lehman and it was found there exists causal relationship between the NDF market and Forward market For 2007(March) to 2004(March)This period shows that no causal relationship exists between NDF and Forward market as P-value > 0.05, therefore enough evidence is not there to not to reject the Null Hypothesis of no causality 23.")
24
CONCLUSION It was found that the relationship between all the three markets is quite dynamic owing to the policy measures taken by RBI to curb the volatility in 2012 The split analysis has given an interesting observation that for the period 2008 (August) to 2014 (Feb) there is two way causal relationship but for the period 2002(Jan) to 2008 (Aug) there is only unidirectional causal relationship i.e. from spot to NDF but not vice-versa. On 2008 (Sept) Lehman Bros. collapsed and the inter-connected world was in financial crisis with the value of currencies falling and rupee also started feeling pressure till RBI intervened. This was structural change in the market which is observation number 67 rightly predicted in this analysis The measures taken by RBI has created constraints in the domestic forward market and has therefore propelled market participants to take position in the off-shore market. It can be observed that the global Turnover of Indian rupee has increased from 23.6 billion U.S. dollars in 2007 to 52.8 billion U.S. dollars in 2013 i.e. an increase of 123% which is a very huge increase as compared to all the emerging markets except china 24
 Lehman Bros. collapsed and the inter-connected world was in financial crisis with the value of currencies falling and rupee also started feeling pressure till RBI intervened. This was structural change in the market which is observation number 67 rightly predicted in this analysis The measures taken by RBI has created constraints in the domestic forward market and has therefore propelled market participants to take position in the off-shore market. It can be observed that the global Turnover of Indian rupee has increased from 23.6 billion U.S. dollars in 2007 to 52.8 billion U.S. dollars in 2013 i.e. an increase of 123% which is a very huge increase as compared to all the emerging markets except china 24.")
25
CONCLUSION This recent increase in the depth of the market can be the reason of its influence to the spot market. Again in 2012 many restrictions were put in place by RBI to wipe out the speculative attacks, this has also helped to protect the domestic spot market against external shock. This can be the reason that why there is no causal relationship in this period (2013-2014) from forward market to the spot market However the relationship between NDF and forward market is more dynamic than other markets because of the evolving nature of these markets. Till 2007 there was no causal relationship between the markets but it was only after the expansion of both the markets with increase in turnover and evolution of more sophisticated products that the markets started passing information to each other. But in the period 2012-2014 there was again no causal relationship again owing to the measures taken by RBI to curb the speculative attacks by market participants in 2012 25
 from forward market to the spot market However the relationship between NDF and forward market is more dynamic than other markets because of the evolving nature of these markets. Till 2007 there was no causal relationship between the markets but it was only after the expansion of both the markets with increase in turnover and evolution of more sophisticated products that the markets started passing information to each other. But in the period there was again no causal relationship again owing to the measures taken by RBI to curb the speculative attacks by market participants in")
26
LIMITATIONS AND FUTURE DIRECTION In this study the period under consideration is from 2002 to 2014 i.e. 12 years. However period under study can be extended and analysis can be done by breaking the period into sub-periods as per the business cycle. The difference in the Tax rates between India and Singapore can also be the influencing factor, as in India corporate tax stands at 34% whereas in Singapore the maximum tax rate is 17%, and can be considered in analysis 26

27
REFERENCES Behera, H., V. Narasimhan and K.N. Murty (2006), 'Relationship between exchange rate volatility and central bank intervention - An empirical analysis for India', South Asia Economic Journal, 9(1): 69-84 Case, K., J. Quigley and R. Shiller (2001), 'Comparing wealth effects: the stock market versus the housing market', Advances in Macroeconomics, 5(1): 1-32 Cheng, X., D. He and C. Shu (2013), 'Impact of the renminbi on Asian currencies: role of the offshore market', mimeo Colavecchio R. and M. Funke (2008), 'Volatility transmissions between renminbi and Asia-Pacific onshore and offshore U.S. dollar futures', china economic review, 19: 635-648 Dua, P. and R. Ranjan (2009), 'Exchange Rate Policy and Modelling in India', RBI Development Research Group, 33: 1-117 27
, Relationship between exchange rate volatility and central bank intervention - An empirical analysis for India , South Asia Economic Journal, 9(1): Case, K., J. Quigley and R. Shiller (2001), Comparing wealth effects: the stock market versus the housing market , Advances in Macroeconomics, 5(1): 1-32 Cheng, X., D. He and C. Shu (2013), Impact of the renminbi on Asian currencies: role of the offshore market , mimeo Colavecchio R. and M. Funke (2008), Volatility transmissions between renminbi and Asia-Pacific onshore and offshore U.S. dollar futures , china economic review, 19: Dua, P. and R. Ranjan (2009), Exchange Rate Policy and Modelling in India , RBI Development Research Group, 33:")
28
REFRENCES Ehlers, T. and F. Packer (2013), ‘FX and derivatives market in emerging economies and the internationalisation of their currencies’, BIS Quaterly Review, December Goyal, R., R. Jain and S. Tewari (2013), ’Non Deliverable Forward and Onshore Indian Rupee Market: A Study on Inter-linkages’, RBI Working paper series, 11: 1-15 Guru, A. (2009), 'Non-Deliverable Forwards Markets for Indian Rupee: An Emprical Study‘, Indian Journal of Economics and Business, 8(2): 245-260 Hutchison, M., J. Kendall, G. Pasricha and N. Singh (2009), ‘Indian Capital Control Liberalisation: Evidence from NDF Markets, NIPFP Working Paper, 60 Ludwig, A. and T. Slok (2004), 'The relationship between stock prices, house prices and consumption in OECD countries', The B.E. Journal of Macroeconomics, 4(1): 1-28 28
, ‘FX and derivatives market in emerging economies and the internationalisation of their currencies’, BIS Quaterly Review, December Goyal, R., R. Jain and S. Tewari (2013), ’Non Deliverable Forward and Onshore Indian Rupee Market: A Study on Inter-linkages’, RBI Working paper series, 11: 1-15 Guru, A. (2009), Non-Deliverable Forwards Markets for Indian Rupee: An Emprical Study‘, Indian Journal of Economics and Business, 8(2): Hutchison, M., J. Kendall, G. Pasricha and N. Singh (2009), ‘Indian Capital Control Liberalisation: Evidence from NDF Markets, NIPFP Working Paper, 60 Ludwig, A. and T. Slok (2004), The relationship between stock prices, house prices and consumption in OECD countries , The B.E. Journal of Macroeconomics, 4(1):")
29
REFRENCES Ma, G., H. Corrine and R. N. McCauley (2004), ‘The Markets for Non- deliverable forwards in Asian currencies’, Bis Quaterly Review, June Misra, S. and H. Behera (2006), ' Non-Deliverable Forward Exchange Market: An Overview', Reserve Bank of India Occasional Papers, 27(3): 25-55 Pedroni, P. (2004), ' Panel co-integration: asymptotic and finite sample properties of pooled time series tests with an application to the PPP hypothesis', Econometric Theory, 20: 597-625 Park, J. (2001), ‘Information flows between non-deliverable forwards (NDF) and spot markets: Evidence from Korean currency’, Pacific Basin Finance Journal, 9 (4): 363-377 Park, Y. and C. Song (2011), 'Renminbi internationalization: prospects and implications for economic integration in East Asia', Asian Economic Papers, 10 (3): 42-72 29
, ‘The Markets for Non- deliverable forwards in Asian currencies’, Bis Quaterly Review, June Misra, S. and H. Behera (2006), Non-Deliverable Forward Exchange Market: An Overview , Reserve Bank of India Occasional Papers, 27(3): Pedroni, P. (2004), Panel co-integration: asymptotic and finite sample properties of pooled time series tests with an application to the PPP hypothesis , Econometric Theory, 20: Park, J. (2001), ‘Information flows between non-deliverable forwards (NDF) and spot markets: Evidence from Korean currency’, Pacific Basin Finance Journal, 9 (4): Park, Y. and C. Song (2011), Renminbi internationalization: prospects and implications for economic integration in East Asia , Asian Economic Papers, 10 (3):")
30
REFERENCES Sharma, S. (2011), ' An Empirical Analysis of the relationship between currency futures and exchange rates volatility in India', RBI Working paper series, 1: 1-20 Toda, H. Y. and T. Yamamoto (1995), ' Statistical inference in vector autoregressions with possible integrated processes', Journal of Econometrics, 66(1-2): 225-250 Tripathy, R. (2013), 'Intervention in foreign exchange markets: the approach of the Reserve Bank of India', BIS Papers, 73: 169-176 Wang K.L., C. Fawson and M.L. Chen (2007), ‘Information Flows among Exchange Rate Markets: What Do We Learn From Non-Deliverable Forward Markets in Asia?’, Chaoyang University of Technology, October 30
, An Empirical Analysis of the relationship between currency futures and exchange rates volatility in India , RBI Working paper series, 1: 1-20 Toda, H. Y. and T. Yamamoto (1995), Statistical inference in vector autoregressions with possible integrated processes , Journal of Econometrics, 66(1-2): Tripathy, R. (2013), Intervention in foreign exchange markets: the approach of the Reserve Bank of India , BIS Papers, 73: Wang K.L., C. Fawson and M.L. Chen (2007), ‘Information Flows among Exchange Rate Markets: What Do We Learn From Non-Deliverable Forward Markets in Asia ’, Chaoyang University of Technology, October 30.")
31
31 THANK YOU !!

Similar presentations


 Roberto Golinelli.>")


 Zhang Deputy Director General China Banking Regulatory Commission Shanghai Bureau Asia-Pacific.>")

 Lecturer: Dr B. M. Nowbutsing Topic: Open economy macroeconomics.>")


