Download presentation
Presentation is loading. Please wait.

1
Evolution- “Change Over Time”
All of the changes that have occurred in living things since the beginning of life on Earth

2
Theories of Evolution Darwin vs. Lamarck

3
Lamarck Darwin

4
Jean-Baptiste LaMarck
French, Early 1800’s Theory of Inheritance of Acquired Characteristics Two main points…

5
Most used body structures develop, unused structures waste away
1. Principle of Use & Disuse: Most used body structures develop, unused structures waste away 2. Inheritance of Acquired Characteristics: Once the structure is modified, the new trait can be inherited (passed to offspring)
")
6
Explain the picture below as if you were LaMarck…

7
Why we don’t believe him…
Experiments: show that changes that occur in an animal’s life are not passed on to its offspring Genetics: Gregor Mendel discovered that traits are passed down through GENES (which aren’t affected by the outside world in that way)
")
8
Charles Darwin “The Father of Evolution”
1831- sailed on the HMS Beagle to the Galapagos Islands. Studied many species of finches. Published book in 1845: “On the Origin of Species by Natural Selection”

9
Darwin’s Theory of Evolution (don’t copy all this it’s on your handout)
“Natural Selection” “Survival of the Fittest”

10
Natural Selection Process by which favorable heritable traits become more common in successive generations of a population of reproducing organisms, and unfavorable heritable traits become less common.

11
Natural Selection

12
Four main points… 1. More organisms are produced than can survive…leads to COMPETITION OVER RESOURCES Ex’s of resources… Water Food Habitat Mates

13
2. Individuals within a population vary, and some of these traits are heritable.

14
3. Some variations are FAVORABLE (increase chances for survival/ reproduction)
Male vs. Female Cardinals Male color attracts female= reproductive advantage

15
Better adapted individuals survive and reproduce
These are the individuals that will pass on their genes to the next generation. This can change the GENE POOL: Includes all the genes of every reproductive member of a population

16
What The theory of evolution IS NOT!!!
It does NOT occur in INDIVIDUALS…only populations! It does NOT happen quickly…the Earth has a Looooooong history! It does NOT explain how life came to be on Earth, just how it evolved after it was here. It does NOT have any driving force except the competition for limited resources.

17
Species… A group of organisms that are genetically similar enough to produce healthy, fertile offspring.

18
An example of Adaptive Radiation
Darwin’s Finches An example of Adaptive Radiation

19
The Galapagos Islands

20
Finch Types: Using Darwin’s Theory, explain how all of these different species evolved.

21
Darwin…one smart guy… “Seeing this gradation & diversity of structure in one small, intimately related group of birds, one might really fancy that from an original paucity of birds in this archipelago, one species had been taken and modified for different ends.”

22
Phylogenetic Trees Show evolutionary “relatedness”
Based on fossil record, dna evidence, structural similarity, etc

23
What common ancestor do all of
These organisms share?

24
Darwin’s Finches…again…
What common ancestor do the seed eating and cactus eating finches share? What do each of the finch pictures on here represent? Which 2 species are more closely related: Mangrove Finch and Woodpecker finch Small ground finch and Bud-eating finch

25
Good Questions with Good Answers.
How can new species be formed and the old one not go extinct? Wasn’t the whole reason a new species formed was that it had a survival advantage?

26
Speciation does NOT necessarily cause EXTINCTION!
A NEW SPECIES’ existence just means… That POPULATION’S GENES have been altered so much that they can no longer mate with members of the original population. NOW there are TWO SPECIES Eventually…one may go extinct, but NOT NECESSARY!!!

27
Darwin’s Finches…p 558 Illustrate SPECIATION: when a species breaks into two (or more) The organisms in the two species can no longer… INTERBREED

28
What could cause this to happen?
Occupy a new niche/habitat Geographic barriers/Reproductive Isolation Reduction of gene flow Selective Pressure

29
Geographic Isolation…
Sometimes populations are spit In two due to a geographic barrier. This can lead to reproductive isolation. How could this lead to speciation?

30
Reduction of Gene Flow…
If members of a species live far away from each other, they will have a decreased chance of mating. This would create reduced gene flow, but not total isolation. Speciation would probably also require different selective pressures at the two ends. Eventually, this could alter gene frequencies in groups at different ends of the range so much that they would not be able to mate if they were reunited…that’s speciation!

31
Selective Pressure A “pressure” from the environment that makes some individuals more likely to survive and reproduce. Three types… Disruptive Directional Stabilizing

32
Types of Natural Selection
Stabilizing Selection Occurs when natural selection works against the 2 extremes of a trait to make the population more uniform.

33
Stabilizing Selection

34
Stabilizing Selection
Birth weight of babies Babies that are too big or too small might have less chance of being born healthy.

35
Natural Selection Directional Selection
Selects the extreme of 1 trait.

36
Directional Selection
In a population of plants, flowers with the brightest color might be selected for in order to attract the most pollinators.

37
Natural Selection Disruptive Selection
Selects against the mean of the population.

38
Disruptive Selection If there are 2 types of seeds to eat for a population of birds, either of 2 different beak shapes (sharp or blunt) might be selected for, but a beak that’s the average of the 2 shapes might not be particularly good at eating either seed, so it would be selected against.
 might be selected for, but a beak that’s the average of the 2 shapes might not be particularly good at eating either seed, so it would be selected against.")
39
Three important points…
Evolution occurs over MANY generations Evolution occurs within POPULATIONS (NOT individuals) Evolution involves genetic changes in a SPECIES (Members of a species interbreed to produce healthy, fertile offspring)
 Evolution involves genetic changes in a SPECIES. (Members of a species interbreed to produce healthy, fertile offspring)")
40
Genetic Recombination
The process by which favorable heritable traits become more common in successive generations of a population of reproducing organisms, and unfavorable heritable traits become less common. Evolution Natural Selection Adaptations Genetic Recombination 1 2 3 4 5 6 7 8 9 10 11 12 13 14 15 16 17 18 19 20 21 22 23 24 25 26 27 28

41
Stabilizing Selection Directional Selection Disruptive Selection
Consider, for example, a population of shellfish called limpets. The shell color of these limpets ranges from white, to tan, to dark brown. As adults, limpets live attached to rocks. On light-colored rocks, white-shelled limpets have an advantage because their bird predators cannot easily see them. On dark-colored rocks, dark-colored limpets have the advantage because they are camouflaged. On the other hand, birds easily see tan-colored limpets on either the light or dark backgrounds. These tan-colored limpets will be at a selection disadvantage and will most likely become extinct from the population. This type of natural selection is known as: Stabilizing Selection Directional Selection Disruptive Selection 1 2 3 4 5 6 7 8 9 10 11 12 13 14 15 16 17 18 19 20 21 22 23 24 25 26 27 28

42
Stabilizing Selection Directional Selection Disruptive Selection
Consider a population of spiders in which the average size is a survival advantage. Predators in the area might easily see and capture spiders that are larger than average. However, small spiders may find it difficult to find food. Therefore, in this environment, average-sized spiders are more likely to survive. This type of natural selection is known as: Stabilizing Selection Directional Selection Disruptive Selection 1 2 3 4 5 6 7 8 9 10 11 12 13 14 15 16 17 18 19 20 21 22 23 24 25 26 27 28

43
Stabilizing Selection Directional Selection Disruptive Selection
Imagine a population of woodpeckers pecking holes in trees to feed on the insects living under the bark. Suppose that a species of insect that lives deep in tree tissues invades the trees in a woodpecker population’s territory. Only woodpeckers with long beaks could feed on that insect. Therefore, the long-beaked woodpeckers in the population would have a selective advantage over woodpeckers with very short or average-sized beaks. This type of natural selection is known as: Stabilizing Selection Directional Selection Disruptive Selection 1 2 3 4 5 6 7 8 9 10 11 12 13 14 15 16 17 18 19 20 21 22 23 24 25 26 27 28

44
The smallest unit that can evolve is:
A genome An individual A community A population 1 2 3 4 5 6 7 8 9 10 11 12 13 14 15 16 17 18 19 20 21 22 23 24 25 26 27 28

45
To predict evolutionary activity, we look at the population’s Gene Pool
Gene pool - all the genes of every reproductive member of a population.

46
Genetic Equilibrium Not all populations are in an active state of “natural selection” GENETIC EQUILIBRIUM This means that there is no change in the gene pool = no evolution

47
Genetic Equilibrium 1.) Population size is large
2.) No gene flow in the population No new organisms introducing more alleles 3.) No mutations 4.) No environmental factors causing natural selection No trait is favorable over another 5.) Random mating must occur
 No gene flow in the population. No new organisms introducing more alleles. 3.) No mutations. 4.) No environmental factors causing natural selection. No trait is favorable over another. 5.) Random mating must occur.")
48
So what factors exist to make a population evolve?
It must NOT be in GENETIC EQUILIBRIUM Something that knocks the population out of genetic equilibrium is called a MECHANISM OF EVOLUTION

49
Mechanisms of Evolution

50
Sources of Genetic Variation
What do you think are some sources of genetic variation? Natural Selection Mutations gene flow genetic drift

51
Mechanisms of Evolution
1. Natural Selection 2. Sexual Selection / Non-random mating 3. Mutation 4. Gene Flow (Migration) 5. Genetic Drift- reduces population size Bottleneck effect Founder effect
 5. Genetic Drift- reduces population size. Bottleneck effect. Founder effect.")
52
(NOT natural selection)
Genetic Drift Genetic Drift occurs when the frequency of alleles change due to RANDOM PROCESSES! (NOT natural selection)
")
53
Genetic Drift

54
Natural Selection vs. Genetic Drift

55
Genetic Drift

56
Kinds of Genetic Drift… Bottleneck Effect

57
Bottleneck Effect

58
Bottleneck Effect

59
Another kind of Genetic Drift…Founder Effect

60
What term(s) would best describe the picture below.
Founder Effect Bottleneck Effect Ross Effect Mutation Original Population Newly Established Population

61
What term(s) would best describe the picture below.
Pizza effect Bottleneck effect Founder effect Woods effect

62
Evolution Rewind

63
If a large population of the same species of squirrels were fed nuts that come from plant containing a toxin that is poisonous to the squirrel, the researcher concludes that these squirrels die and cannot survive on these nuts alone. Then the researcher introduces the poisonous nuts to a smaller isolated population of the same species of bird and finds that these birds are able to eat the nuts. How can this be explained?

64
Recently West Nile Virus has become a major problem in our area
Recently West Nile Virus has become a major problem in our area. Cities have begun spraying pesticides in the summertime to try and kill off a large amount of mosquitoes. How come every few years the cities should change their pesticide mix?

65
Population Genetics

66
Relative Frequency of an Allele
The number of times an allele occurs in the gene pool, given as a percentage Relative frequency has nothing to do with dominant or recessive The recessive allele can occur more frequently

67
How does reproduction affect natural selection
Discuss with your partner: How would a population that reproduces asexually “evolve” differently than one that reproduces sexually? WHY?

68
A note on sexual reproduction…
Sexual reproduction can produce many different phenotypes Sexual reproduction does NOT change relative frequency of alleles in a population Think about shuffling a deck of cards Shuffling cards gives you different hands It won’t change the number of kings in a deck

69
Population Genetics In the early 1900s these two men discovered how the frequency of a trait’s alleles in a population could be described mathematically. G H Hardy – British Mathematician Wilhelm Weinberg – German Doctor

70
Population Genetics For every phenotype how many alleles do you have??? 2 1 from Mom and 1 from Dad These scientists figured out an equation that can be used to figure out the percentages of alleles and genotypes that are in a population.

71
Genetic Equilibrium: Hardy-Weinberg Principle
Allele frequency in a population will remain constant unless an outside factor causes those frequencies to change When allele frequencies remain constant, we call this genetic equilibrium

72
Population Genetics Background
Given a population of 300 plants… How many total height genes are there? Given that 100 plants are short (recessive trait), 200 are tall, and 50 are homozygous tall, how many are there of each genotype? Homozygous recessive Homozygous dominant Heterozygous How many T alleles are there in the gene pool? What is this alleles’ frequency in the population? How many t alleles are there in the gene pool?
, 200 are tall, and 50 are homozygous tall, how many are there of each genotype Homozygous recessive. Homozygous dominant. Heterozygous. How many T alleles are there in the gene pool What is this alleles’ frequency in the population How many t alleles are there in the gene pool")
73
Genetic Equilibrium Review
In order for their equation to work the population has to be in GENETIC EQUILIBRIUM This means that there is no change in the gene pool = no evolution

74
Genetic Equilibrium (Review)
1.) Population size is large 2.) No gene flow in the population No new organisms introducing more alleles 3.) No mutations 4.) No environmental factors causing natural selection No trait is favorable over another 5.) Random mating must occur
 Population size is large. 2.) No gene flow in the population. No new organisms introducing more alleles. 3.) No mutations. 4.) No environmental factors causing natural selection. No trait is favorable over another. 5.) Random mating must occur.")
75
The Hardy-Weinberg Equation
p2 + 2pq + q2 = 1 p2 = frequency of the homozygous dominant genotype 2pq = frequency of the heterozygous genotype q2 = frequency of the homozygous recessive genotype

76
Hardy-Weinberg p – frequency of the dominant allele
q – frequency of the recessive allele Because there are only 2 alleles, the frequency of the dominant allele (p) and the frequency of the recessive allele (q) will add up to 1 or 100% p + q = 1
 and the frequency of the recessive allele (q) will add up to 1 or 100% p + q = 1.")
77
Hardy-Weinberg In reality, no population satisfies the Hardy-Weinberg equilibrium completely However, in large populations with little migration and little natural selection, it can approximate gene frequencies

78
Hardy-Weinberg Example
In a population of 100 people 28 of them were found to have freckles and 72 were not. We learned in class during our genetics unit that having freckles is a recessive trait and not having them is because of a dominant trait. If this population is in genetic equilibrium then solve for the allelic frequencies and the variables in the hardy-weinberg equation:

79
How does reproduction affect natural selection
Discuss with your partner: How would a population that reproduces asexually “evolve” differently than one that reproduces sexually? WHY? We didn’t finish these yesterday- on another powrepoint

80
A note on sexual reproduction…
Sexual reproduction can produce many different phenotypes Sexual reproduction does NOT change relative frequency of alleles in a population Think about shuffling a deck of cards Shuffling cards gives you different hands It won’t change the number of kings in a deck

81
Queens full of Jacks! Let’s Mate! red card=dominant allele=R
black card=recessive allele=r

82
P2 + 2pq + q2 RR Rr rr Prediction 36% 48% 16% 1st gen. 2nd gen 3rd gen

83
Predicted vs Actual If this population is in equilibrium, we should have the predicted % for our genotypes… We have…20 rr envelopes and 30RR envelopes Are we in equilibrium?

84
What should happen? If we are evolving… If we are not…

85
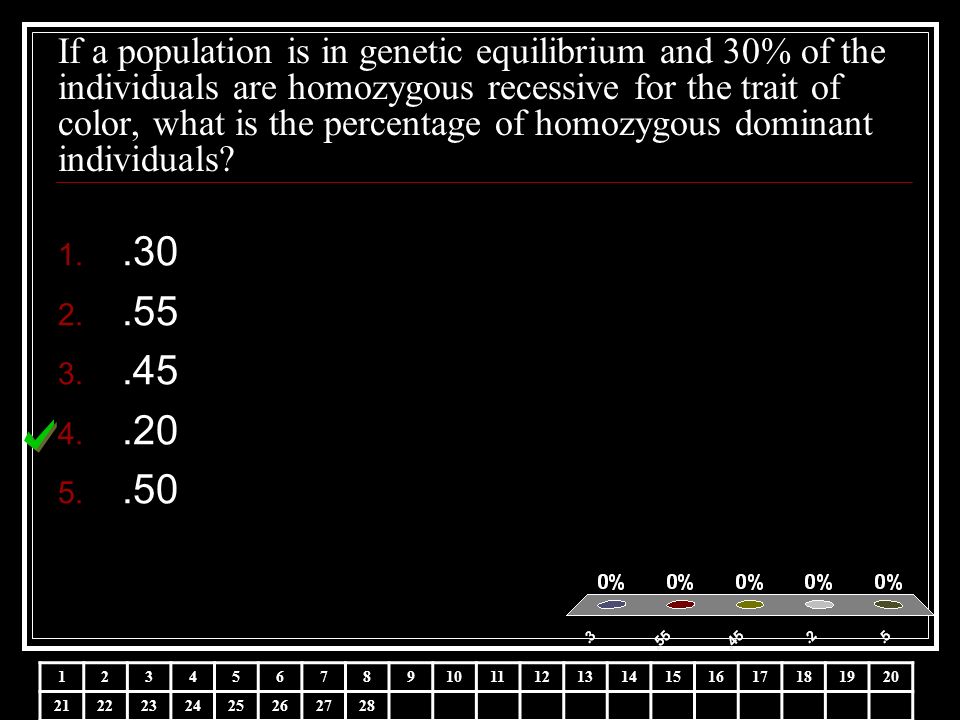
If a population is in genetic equilibrium and 30% of the individuals are homozygous recessive for the trait of color, what is the percentage of homozygous dominant individuals? .30 .55 .45 .20 .50 1 2 3 4 5 6 7 8 9 10 11 12 13 14 15 16 17 18 19 20 21 22 23 24 25 26 27 28
86
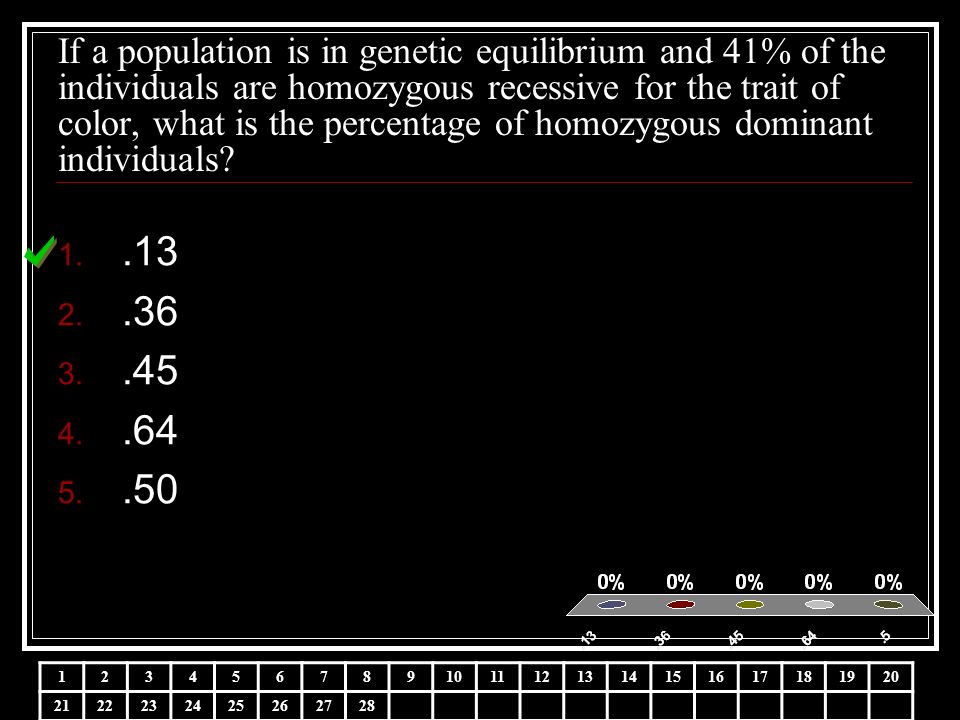
If a population is in genetic equilibrium and 41% of the individuals are homozygous recessive for the trait of color, what is the percentage of homozygous dominant individuals? .13 .36 .45 .64 .50 1 2 3 4 5 6 7 8 9 10 11 12 13 14 15 16 17 18 19 20 21 22 23 24 25 26 27 28
87
Picture Choice 1 Picture Choice 2 Picture Choice 3 Picture Choice 4
Using the example of the west nile mosquitoes that are sprayed with a pesticide, suppose one mosquito has a genetic mutation that allows the mosquito to survive. Which graph best represents the frequency of this gene over time? 1. 2. Picture Choice 1 Picture Choice 2 Picture Choice 3 Picture Choice 4 3. 4. 1 2 3 4 5 6 7 8 9 10 11 12 13 14 15 16 17 18 19 20 21 22 23 24 25 26 27 28

88
Random mating Large population size No natural selection No gene flow
You have determined the frequency of the dominant allele in a population. Over the next two generations, the frequency of this allele does not change. Which factors below must be true in order to maintain this equilibrium: Random mating Large population size No natural selection No gene flow No mutations 1 2 3 4 5 6 7 8 9 10 11 12 13 14 15 16 17 18 19 20 21 22 23 24 25 26 27 28

89
The frequency of a particular recessive allele in a population of chipmunks is .3 The frequency of the dominant allele in this same population is: .3 .6 .7 1 1 2 3 4 5 6 7 8 9 10 11 12 13 14 15 16 17 18 19 20 21 22 23 24 25 26 27 28

Similar presentations


 Genotype frequency.>")


