Download presentation
Presentation is loading. Please wait.

1
THE CALIFORNIA WATER CRISIS RISK TO THE CALIFORNIA FOOD SYSTEM CDFA BOARD MEETING 1-21-2009 Cornelius “Corny” Gallagher Chairman California Banking Association Ag Lending Committee

2
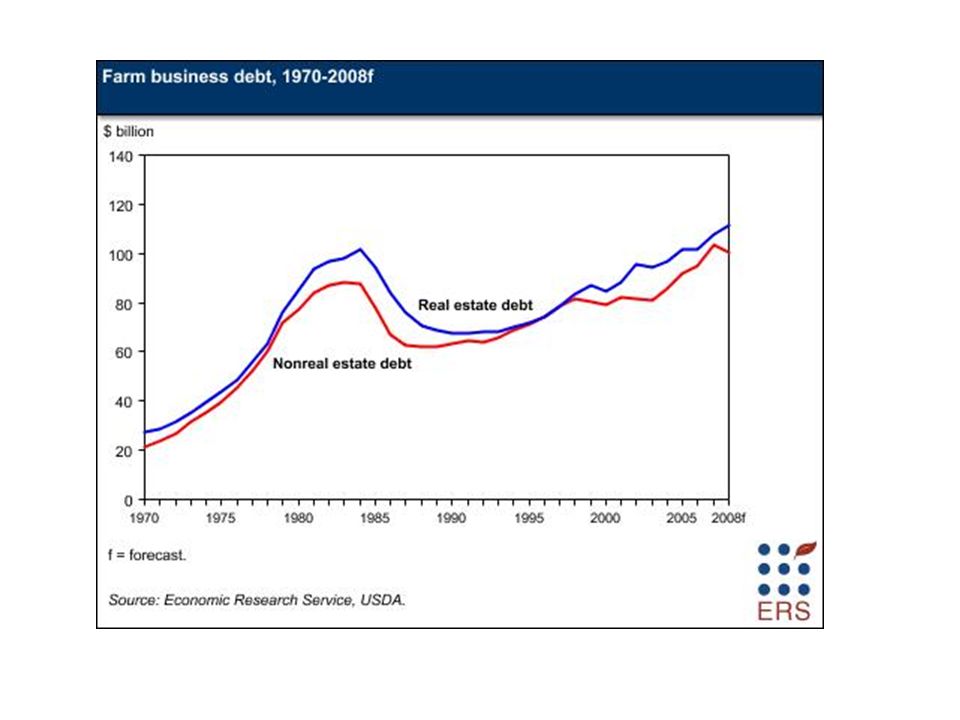
SOURCE OF FARM DEBT ERS.USDA.GOV

4
U.S. FARM EQUITY ($ billions) 2007 2008 20092012 SOURCE (EST)USDA USDAFSE FSE Real Estate1,912 2,052 2,0841,826 Total Assets2,210 2,359 2,389 Total Debt 212 212 213 Equity $1,998 $2,147 $2,176 Net Income $87 $91 $74 $64 ROA 3.9% 3.9% 3.1%
 SOURCE (EST)USDA USDAFSE FSE Real Estate1,912 2,052 2,0841,826 Total Assets2,210 2,359 2,389 Total Debt Equity $1,998 $2,147 $2,176 Net Income $87 $91 $74 $64 ROA 3.9% 3.9% 3.1%.")
5
http://aic.ucdavis.edu/publications/MOCA_Ch_5.10aPrePrint.pdf http://aic.ucdavis.edu/publications/MOCA_Ch_5.10aPrePrint.pdf UC AG ISSUES CENTER Dan Sumner, Director

6
Global and National Competitiveness California is nearly 19 percent of the US Ag GDP. California Ag is one of top ag economies in World.

7
Broad Economic Impacts California farms and processing industries generate 7.3 percent of state’s private sector labor force. (This includes part-time workers.) This accounted for 5.6% of the California state labor income in 2002. For every $1 billion in farm sales, there are 18,100 jobs created in the state: –10,900 in the farm sector and –7,200 in other industries.
 This accounted for 5.6% of the California state labor income in For every $1 billion in farm sales, there are 18,100 jobs created in the state: –10,900 in the farm sector and –7,200 in other industries..")
8
California farms have a significant direct effect on the state ’ s economy. According to the U.S. Bureau of Economic Analysis, California ’ s gross state product (GSP), the value added by all industries in the state, was $1,438 billion in 2003. At $21 billion (Table 5.1), agriculture (farming), forestry, fishing, hunting, and support services accounted for 1.45 percent of the California GSP.
, the value added by all industries in the state, was $1,438 billion in At $21 billion (Table 5.1), agriculture (farming), forestry, fishing, hunting, and support services accounted for 1.45 percent of the California GSP..")
9
Economic Impact of Ag Production and Processing Region ( %) CaliforniaCentral Valley San Joaquin Valley Jobs7.324.137.8 Labor Income 5.618.529.9 Value Added 6.522.234.1
 CaliforniaCentral Valley San Joaquin Valley Jobs Labor Income Value Added")
10
California Agricultural Productivity, 1949-2002 Driven by water Output Index Index (1949=100) Input Index
 Input Index")
12
Almonds: 100% Pistachios: 100% Walnuts: 100% Processing Tomatoes: 95% Figs, Dates, Olives, Kiwi: 100% Apricots: 95% Plums/Prunes: 97% Grapes: 87% Vegetables: Very high percentage CALIFORNIA DOMINATES U.S. SPECIALTY CROP AGRICULTURE

13
WHERE THE FOOD PROCESSORS ARE

14
Value of Commodity Type as Percentage of Total California Agriculture: 2006 Source: NASS, California Statistics

15
Top 5 Agricultural Producing States as Percent of Total U.S. Ag Value, 1997-2007 Source: USDA

16
FOCUS ON THE FUTURE DANIEL M. DOOLEY VICE PRESIDENT, UNIVERSITY OF CALIFORNIA UCD Dean’s Advisory Council April 10, 2008

17
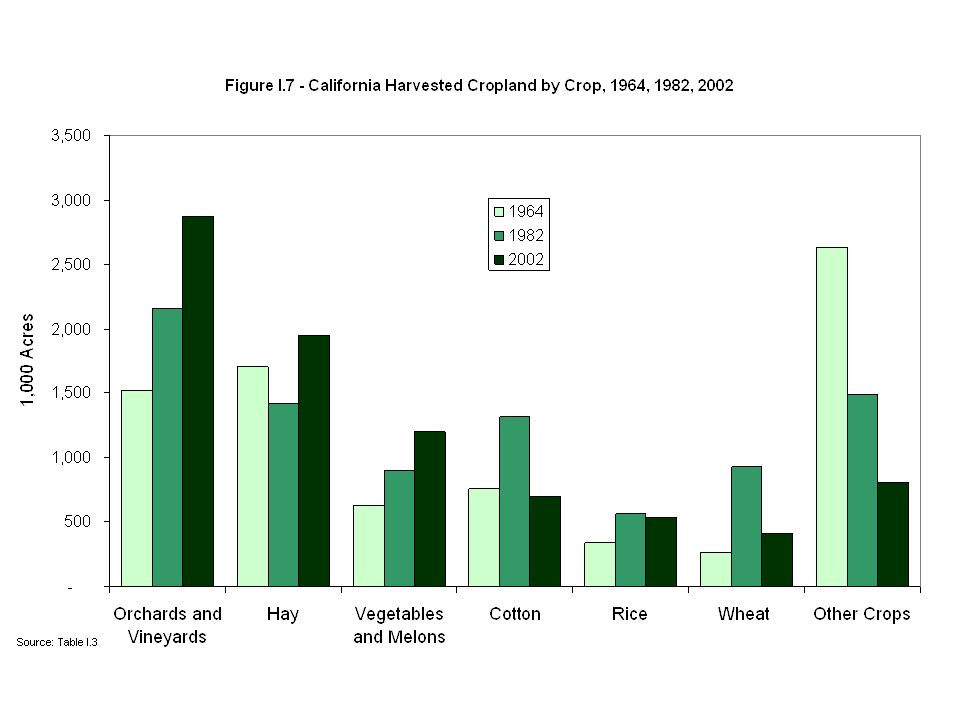
Agricultural Land in California Harvested Cropland: 8.5 million acres –34% -- orchards and vineyards –23% -- hay –14% -- vegetables

18
11/15 fastest growing counties are major agricultural counties

19
Significant Cost Increases in CA Agriculture Water Regulatory Compliance Fertilizer Electricity

20
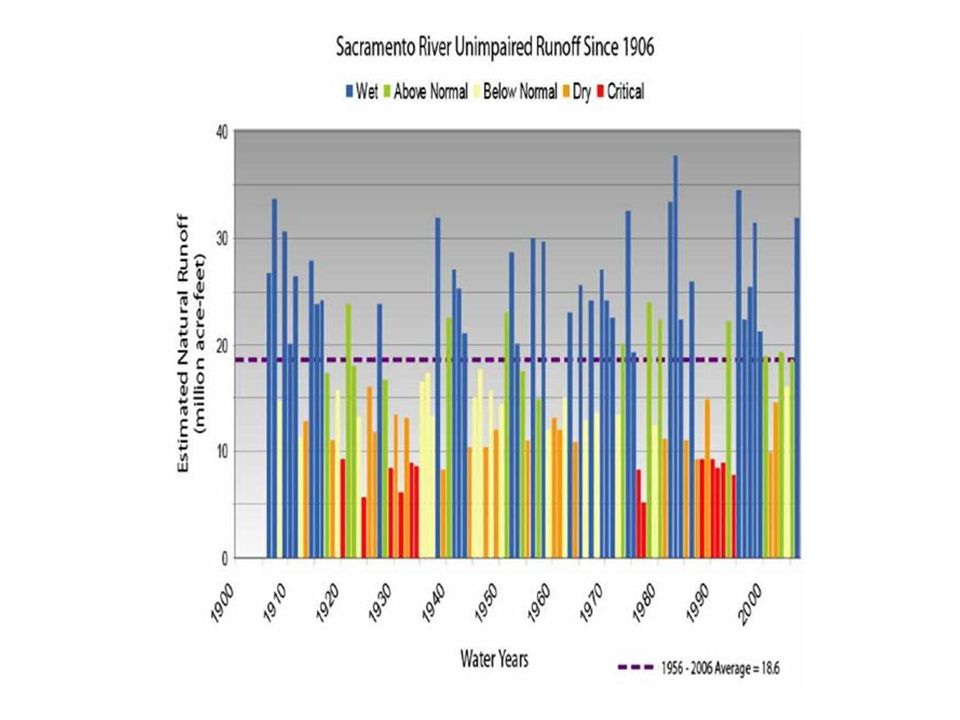
California population growth vs. Water Supply

21
2009 WATER SUPPLY?? POSSIBLE ZERO SURFACE DELIVERIES SOUTH OF DELTA

23
Provisional Draft Report 11-30- 2008 Long Term Impacts with No Groundwater increase and No Markets

25
California People, Ag and the Environment Need State Water Bank to Work in 2009

26
Water Quality, Quantity and Mediterranean Crop Production Richard Howitt Cal-Med Sonoma Workshop October 25 2007 Department of Agricultural and Resource Economics University of California, Davis

27
Yield Reduction by Salinity VanGenucten & Maas (Salinity indirectly measured as Electrical Conductivity, EC)
")
28
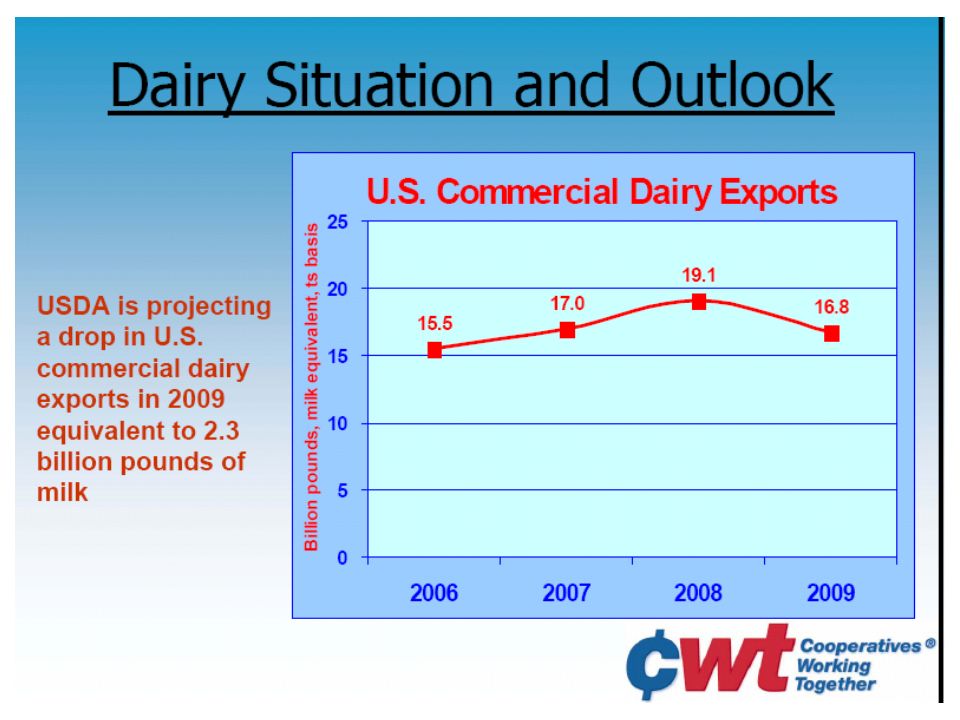
COWS NEED WATER TO MAKE MILK

29
WHERE THE DAIRY COWS ARE

33
VINES NEED WATER TO MAKE WINE

34
Continued Growth – Deeply Rooted in Communities: $45.4 billion – 40% growth from ’98-’02 207,550 jobs; 1,049 wineries; 4,805 growers 14.8 million visitors 92% of U.S. wine production Fourth largest in the world California Wine Community

35
ALMONDS NEED WATER TO PRODUCE EXPORTS

36
RankCommodity ($mill)% Exported 1Almonds 1,89971 2Wine73617 3Dairy Products604 - 4Cotton55412 5Table Grapes50040 6Walnuts36545 7Oranges35938 8Pistachios28743 9Tomatoes (Processed)28614 10Strawberries27312 Top-10 California Exports, 2006 Source: Agricultural Issues Center Top 5 account for 50% of total CA exports
% Exported 1Almonds 1, Wine Dairy Products Cotton Table Grapes Walnuts Oranges Pistachios Tomatoes (Processed) Strawberries27312 Top-10 California Exports, 2006 Source: Agricultural Issues Center Top 5 account for 50% of total CA exports")
37
Global and National Competitiveness California is losing the battle to be the low cost producer of many commodities.

38
California Ag Opportunities Innovations in Sustainability and Specialty Crops. Health benefits of ag products and parts. Changing demographics = New products. Food Service Chefs driving menu ideas. Drive for local and fresh products for food service. Environmental solutions and improvements. It ’ s not waste it is …..potential new revenue. Coordinate and collaborate research for solutions.

39
SUSTAINABILITY The Code is conceived around the three “ E ”’ s

40
GLOBAL SUSTAINABILITY CALIFORNIA AG IS STRATEGIC RESOURCE

41
Accelerating Global Development Perspectives from the Bill & Melinda Gates Foundation September 17, 2008 Lutz Goedde Global Development

Similar presentations


 2005 By Samir Jrad Agro-Food Division.>")


 13 th Annual Farmer Cooperatives Convention December 6-7, 2010 Economic.>")
 Student ID: MA2N0216 23.12.2014.>")


