Download presentation
Presentation is loading. Please wait.

1
Imagining the Future of Agriculture Robert Tse USDA Rural Development Yribarren Ranch Bishop, CA July 24, 2014

2
Global Demographic Drivers Global Ag Challenges Global Ag Opportunities

3
Global Demand Drivers to 2050 Global Population Increase Rapid Urbanization Growing Middle Class Climate Change Impact Rising Food Prices Rising Global Trade of Food Rising Demand for Protein, Fruits and Vegetables Agriculture Adapts to Climate Change Rising Global Travel

4
UNWTO up 80% from 982 Million in 2011 International Tourism Spending: $1.2 Trillion 2011 US International Visitors 62.3 Million 2011 Forecast to Rise to 77 Million by 2016* International Traveler’s by 2030: 1.8 Billion International Traveler’s by 2030: 1.8 Billion $1.2 Trillion International Travel Spending (2011): $1.2 Trillion $800 Billion U.S. Tourism Spending $800 Billion (2011) (Domestic & International Spending) $100 Billion California Tourism Spending > $100 Billion (2011)
 (Domestic & International Spending) $100 Billion California Tourism Spending > $100 Billion (2011).")
5
World Population Reaches 7 Billion October 31, 2011 …Projected to Reach 9.3 Billion in 2050 4 Billion 1975 3 Billion 1960 1 Billion 1804 2 Billion 1927 7 Billion 2050 9 Billion October 31, 2011

6
World Becomes More Urban May 23, 2007 World Became Majority Urban May 23, 2007 Urban Percentage of World Population

7
Rise of the Global Middle Class By 2030, 50% of world population will be middle income ($6 – 30,000 PPP) Percent Source: Goldman Sachs Economic Research
 Percent Source: Goldman Sachs Economic Research")
8
Global Agriculture Challenges Limited availability of more arable land for production without high environmental costs Double Productivity on farm land already in production Adapt to Global Climate Change Meet Local Challenges

9
Global Agriculture Opportunities Produce More with Less Labor New Plant Hybrids, and Animal Breeds New Agricultural Technology New Agricultural Production Practices Greater Efficiency in Agricultural Utilization of Water Expanding Markets for California’s Food and Agriculture Products

10
Central Valley Produces More Than Any Other State - Except California $33.8 B $27 B $47.5 B Gross Farm Gate USDA NASS

11
San Joaquin Valley Dominates California Ag Production $BillionAll Crops California$51.5 San Joaquin Valley $30.2 Fresno$6.914% Tulare$5.611% Kern$5.411% Merced$3.36% Stanislaus$3.16% San Joaquin $2.24% Kings$2.24% Madera$1.63% Gross Value 59% 2011 USDA NASS CA

12
Surface View

13
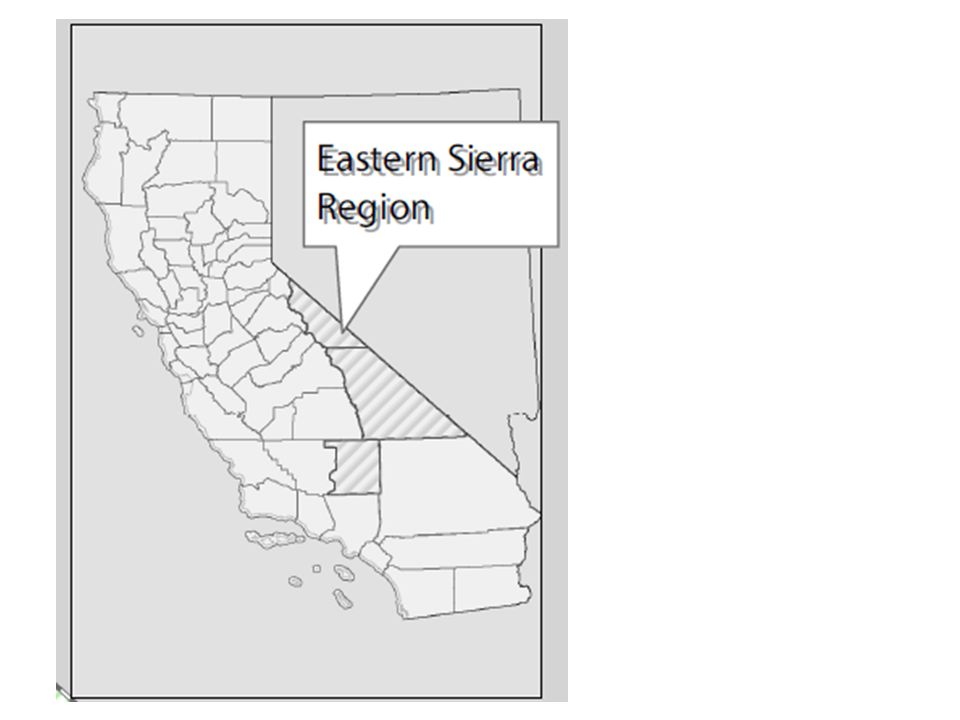
Inyo & Mono County Farm Gate $77.3 Million Animal Agriculture Dominates USDA NASS 2012

14
Local Impact Disruptive Events

15
Disruptive Event: Drought

16
2014 Drought Impact Greatest absolute reduction in water available … for California agriculture ever seen … State wide Impact: – Crop Revenue Loss:$810 Million – Additional Pumping Cost$454 Million – Livestock / Dairy Revenue Loss$203 Million – TOTAL DIRECT LOSSES$1.5 BILLION TOTAL ECONOMIC COST:$2.2 BILLION TOTAL JOB LOSSES:17,000 Economic Analysis of the 2014 Drought for California Agriculture UC Davis Center for Watershed Sciences July 15, 2014

17
GROUND WATER IS KEY Ground water availability and use is key to ag prosperity Replaces 75% or 5 million acre feet of loss of available surface water Failure to replenish … reduce[s] … availability to sustain agriculture … during CA’s frequent droughts Economic Analysis of the 2014 Drought for California Agriculture UC Davis Center for Watershed Sciences July 15, 2014
![GROUND WATER IS KEY Ground water availability and use is key to ag prosperity Replaces 75% or 5 million acre feet of loss of available surface water Failure to replenish … reduce[s] … availability to sustain agriculture … during CA’s frequent droughts Economic Analysis of the 2014 Drought for California Agriculture UC Davis Center for Watershed Sciences July 15, 2014](http://images.slideplayer.com/15/4632316/slides/slide_17.jpg "GROUND WATER IS KEY Ground water availability and use is key to ag prosperity Replaces 75% or 5 million acre feet of loss of available surface water Failure to replenish … reduce[s] … availability to sustain agriculture … during CA’s frequent droughts Economic Analysis of the 2014 Drought for California Agriculture UC Davis Center for Watershed Sciences July 15, 2014")
18
Disruptive Event: Digital 395

19
Agriculture Technology Combines two California core strengths: Agriculture and Technology Robert Tse USDA RD CA

20
New Ag Technology Ag Tech Pro- duction Water Environ- ment Energy Food Safety

21
New Data Driven Technology Production Side of Agriculture

23
Infrastructure BROADBAND RURAL WIRELESS BROADBAND NEW AGRICULTURE TECHNOLOGY PRODUCTIONWATERENERGY ENVIRONMENTFOOD SAFETY RURAL TELE-HEALTH / TELE-MEDICINE Distance LearningPublic Libraries TRANSPORTATION & LOGISTICS PUBLIC SAFETY DIRECT MARKET ACCESS TO GLOBAL MARKETS Rural Agro Tourism & Recreation FOUNDATION FOR ECONOMIC GROWTH AND OPPORTUNITY

24
Technology is Here! http://www.youtube.com/watch?v=q8dBOGAf UIk

26
Travel – Tourism is Critical to Rural Counties RankCountyPercent Employment From Tourism Percent Earnings From Tourism 1Mariposa52%33% 2Mono49%32% 3Alpine34%16% 4Inyo24%12% 5Sierra23%13% California Tourism Commission

27
Regional Economy Driven by Tourism $ Million 2012 2012 2011 2012 Source: California Tourism Commission, USDA - NASS $195 $ 136 $77

29
Global Demand Drivers to 2050 Global Population Increase Rapid Urbanization Growing Middle Class Climate Change Impact Rising Food Prices Rising Global Trade of Food Rising Demand for Protein, Fruits and Vegetables Agriculture Adapts to Climate Change

30
$30.2 Billion - 2011 Gross Domestic Receipts $30.2 Billion - 2011 Gross Domestic Receipts $6.6 Billion $4.8 Billion $6.6 Billion $2.4 Billion $2.1 Billion $1.6 Billion $1.5 Billion $1.1 Billion Robert Tse USDA RD CA

31
Food and Beverage Services Inyo and Mono County $ Million $195

32
Ag Tech - New Ag Regional Cluster Development of new agricultural technology and its adoption in the San Joaquin Valley offers continued growth of the regional agriculture economy and the potential to develop agriculture technology clusters Robert Tse USDA RD CA

33
San Joaquin Valley Dominates California Ag Production $1,000All Crops State Total51,488,191 San Joaquin Valley 30,243,586 Fresno6,884,582 Tulare5,629,264 Kern5,364,363 Merced3,259,866 Stanislaus3,069,823 San Joaquin2,246,920 Kings2,219,529 Madera1,569,239 Gross Value 59% 2011 USDA NASS CA

Similar presentations