Download presentation
Presentation is loading. Please wait.

12
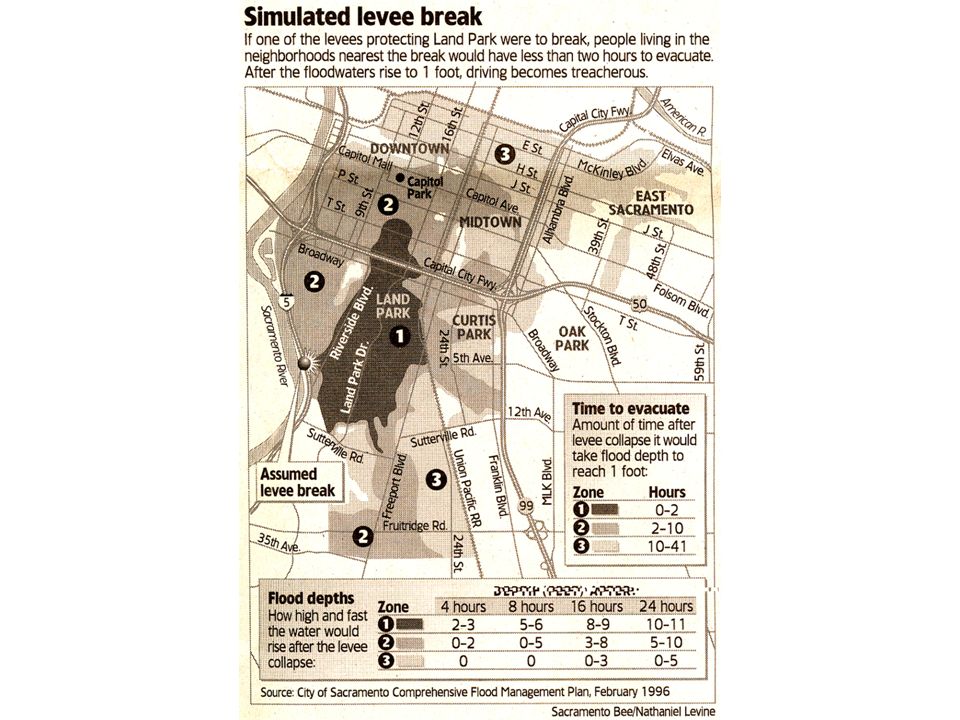
Flood maps – Modeling a levee break http://www.msa.saccounty.net/waterresources/stormready/default.asp

13
Flooding Urban flooding –Paved areas and storm sewers increase runoff by inhibiting infiltration –Rapid delivery of water to streams increases peak discharge and hastens occurrence of flood Flash floods –Local, sudden floods of large volume and short duration –Typically triggered by heavy thunderstorms

14
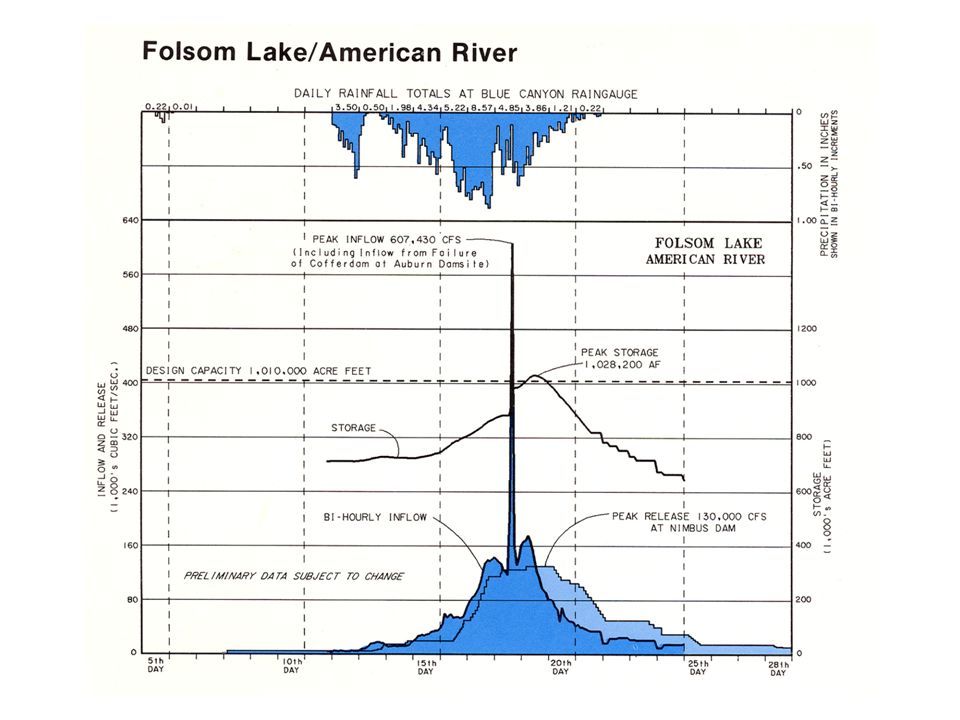
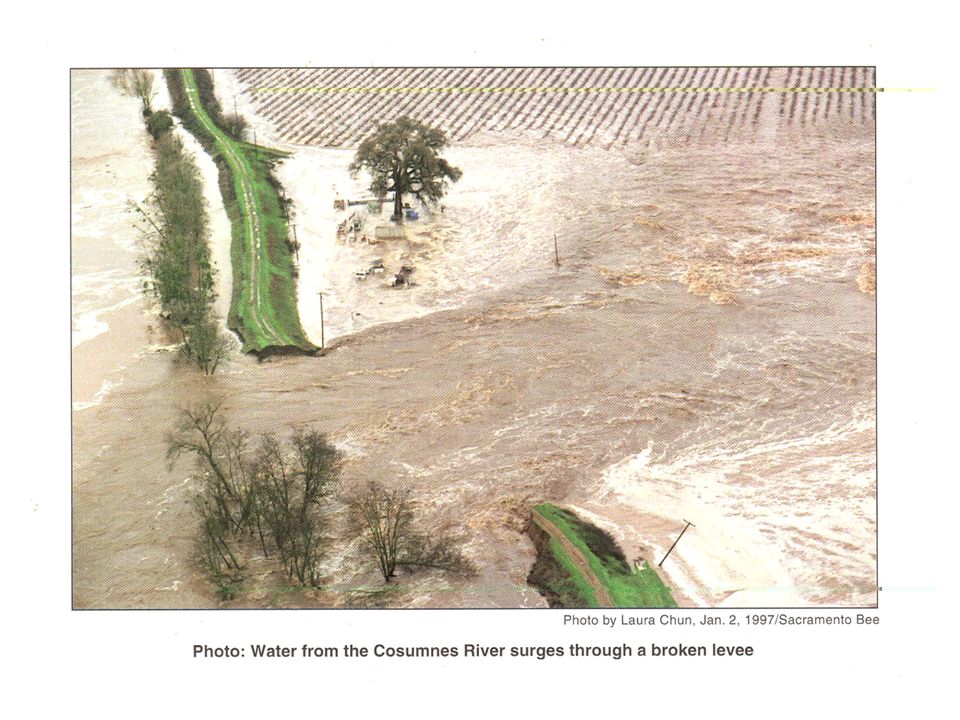
Flooding Flood control –Dams designed to trap flood waters in reservoirs upstream and release it gradually over time –Artificial levees designed to increase capacity of river channel Works well until stream overtops artificially raised levees, leading to extremely rapid flooding and erosion –Wise land-use planning, including prevention of building within 100-year floodplains, is most effective

15
Real-time river data http://cdec.water.ca.gov/river/rivcond.html http://cdec.water.ca.gov/river/americanStages.html

Similar presentations


 Urbanization ERS 482/682 Small Watershed Hydrology.>")
 Flood Stage and height above Flood.>")
>")
 Cycle. Surface Water Oceans Rivers and streams Lakes and ponds Springs – groundwater becomes surface water.>")


