Download presentation
Presentation is loading. Please wait.

1
Statistical Analyses t-tests Psych 250 Winter, 2013

2
Hypothesis: People will give longer sentences when the victim is female.

3
Independent Variable: Gender of the Victim Dependent Variable: Length of Sentence

4
Types of Measures / Variables Nominal / categorical –Gender, major, blood type, eye color Ordinal –Rank-order of favorite films; Likert scales? Interval / scale –Time, money, age, GPA

5
Variable TypeExampleCommonly-used Statistical Method Nominal by Nominalblood type by genderChi-square Scale by NominalGPA by gender GPA by major t-test Analysis of Variance Scale by Scaleweight by height GPA by SAT Regression Correlation Main Analysis Techniques

6
Variable TypeExampleCommonly-used Statistical Method Nominal by Nominalblood type by genderChi-square Scale by NominalGPA by gender GPA by major t-test Analysis of Variance Scale by Scaleweight by height GPA by SAT Regression Correlation Main Analysis Techniques

7
Stat Analysis / Hypothesis Testing 1.Form of the relationship 2.Statistical significance

8
Variables: Scale by Categorical Form of the relationship: Means of each category (M & F victim) Statistical Significance: Independent samples t-test
 Statistical Significance: Independent samples t-test")
9
Means observed in Sample Victim GenderAverage Sentence Male6 months Female16 months

10
Statistical Signficance Q: Is this a “statistically significant” difference? Can the “null hypothesis” be rejected? Null hypothesis: there are NO differences in sentencing for male vs. female victims

11
Universe n = ∞ Sample n = 40 M victim: 6 months F victim: 16 months sample inference

12
Logic of Statistical Inference What is the probability of drawing the observed sample (M = 6 months vs. F = 16 months) from a universe with no differences? If probability very low, then differences in sample likely reflect differences in universe Then null hypothesis can be rejected; difference in sample is statistically significant
 from a universe with no differences. If probability very low, then differences in sample likely reflect differences in universe Then null hypothesis can be rejected; difference in sample is statistically significant.")
13
Strategy Draw an infinite number of samples of n = 40, and graph the distribution of their male victim / female victim differences

14
Null Hyp: M = 11 months F = 11 months M: 6 F: 16 Samples of n = 40 Universe n = ∞ M: 13 F: 9 M: 11 F: 11 M: 8 F: 14

15
T-test Sampling distribution: Mean difference Function of: 1) difference in means 2) variance (dispersion around mean)
 difference in means 2) variance (dispersion around mean)")
16
Possible Sample -- 1 1 2 3 4 5 6... 16 Male Victim Female Victim

17
Possible Sample -- 2 1 2 3 4 5 6... 16 Male Victim Female Victim

18
Frequency Distribution Mean = 11

19
Variance x i - Mean ) 2 Variance = s 2 = ----------------------- N x i - Mean ) 2 but:s 2 = ----------------------- N - 1 Standard Deviation = s = variance
 2 Variance = s 2 = N x i - Mean ) 2 but:s 2 = N - 1 Standard Deviation = s = variance")
20
Calculating Variance Mean = 11

21
Variance

22
t distribution Sampling distribution of a difference in means Function of mean difference & “pooled” variance (of both samples) mean 1 – mean 2 t = -------------------------------- s p √ (1/n 1 ) + (1/n 2 )
 mean 1 – mean 2 t = s p √ (1/n 1 ) + (1/n 2 )")
23
Null Hyp: M = 11 months F = 11 months mean dif & var Samples of n = 40 Universe n = ∞ mean dif & var mean dif & var mean dif & var

24
Null Hyp: M = 11 months F = 11 months t Samples of n = 40 Universe n = ∞ t t t

25
t distribution 2.5% of area

26
Statistical Significance If probability is less than 5 in 100, the null hypothesis can be rejected, and it can be concluded that the difference also exists in the universe. p <.05 The finding from the sample is statistically significant

27
SPSS t-test Output 1. Read means 2. Read Levene’s Test 3. Read p value

28
Report Findings “Assailants were given an average sentence of 16 months when the victims were female, compared to 6 months when the victims were male (df = 46, t = 3.13, p. <.005).” “Respondents gave longer sentences when the victims were female (16 months) than when they were male (6 months), a difference that was statistically signficant (df = 46, t = 3.13, p. <.005).”
. Respondents gave longer sentences when the victims were female (16 months) than when they were male (6 months), a difference that was statistically signficant (df = 46, t = 3.13, p. <.005). .")
29
Statistical Analyses analysis of variance ( ANOVA ) Psych 250 Winter, 2011
 Psych 250 Winter, 2011")
30
Variable TypeExampleCommonly-used Statistical Method Nominal by Nominalblood type by gender Chi-square Scale by NominalGPA by gender GPA by major t-test Analysis of Variance Scale by Scaleweight by height GPA by SAT Regression Correlation Analysis of Variance

31
Dep Var: Length of Sentence Indep var: Major Mean = 14.6 Variance = 212.4

32
Form of Relationship (differences seen in sample)
")
33
Length of Sentence by Major Nat sci14.3 Soc sci 7.4 Art & Hum11.0

34
Statistical Inference ( generalize from sample to universe? )
")
35
Universe n = ∞ Sample n = 40 Nat sci = 14.3 Soc sci = 7.4 A & H = 11.0 sample inference

36
Possible Sample -- 1 1 2 3 4 5 6 7 8 9 10 11 12 13 14 15 Social Science Art & Human Natural Science

37
Possible Sample -- 2 1 2 3 4 5 6 7 8 9 10 11 12 13 14 15 Social Science Art & Human Natural Science

38
ANOVA Logic 1.Calculate ratio of “between-groups” variance to “within-groups” variance 2.Estimate the sampling distribution of that ratio:F distribution 3.If the probability that the ratio in sample could come from universe with no differences in group means is <.05, can reject null hypothesis and infer that mean differences exist in universe

39
ANOVA Logic Between groups: n socsci (Mean socsci - Mean) 2 + n arthum (Mean arthum - Mean) 2 +n natsci (Mean natsci – Mean) 2 / df Within groups: (n i – Mean socsci ) 2 + (n i - Mean arthum ) 2 + (n i - Mean natsci ) 2 / df
 2 + n arthum (Mean arthum - Mean) 2 +n natsci (Mean natsci – Mean) 2 / df Within groups: (n i – Mean socsci ) 2 + (n i - Mean arthum ) 2 + (n i - Mean natsci ) 2 / df")
40
F ratio between groups mean squares F = within groups mean squares

41
Null Hyp: Nat sci = 11 months Soc sci = 11 months Art-Hum = 11 months f Samples of n = 40 Universe n = ∞ f f f

42
f Distributions

43
ANOVA: sentence by major

44
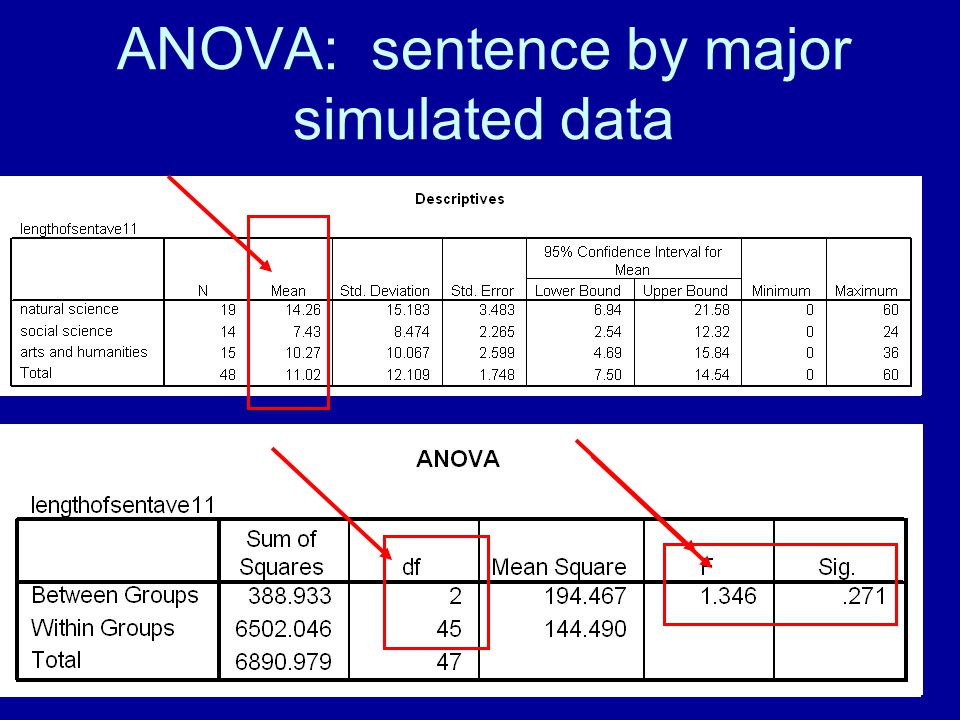
ANOVA: sentence by major simulated data

46
Write Findings “Social science majors assigned sentences averaging 7.4 years, arts and humanities students 10.3 years, and natural science students 14.3 years, but these differences were not statistically significant (df = 2, 42, F = 1.35, p <.30).”
.")
Similar presentations


 Lecture 9.>")


,>")


