Download presentation
Presentation is loading. Please wait.

1
Heteronuclear Relaxation and Macromolecular Structure and Dynamics
Outline: Note: refer to lecture on “Relaxation & nOe” Information Available from Relaxation Measurements Relaxation Mechanisms Relaxation Rates Experimental Methods Data Analysis Case Studies Fushman, D., R. Xu, et al. (1999). "Direct determination of changes of interdomain orientation on ligation: Use of the orientational dependence of N-15 NMR relaxation in Abl SH(32)." Biochemistry 38(32): Eisenmesser, E. Z., D. A. Bosco, et al. (2002). "Enzyme dynamics during catalysis." Science 295(5559): Lee, A. L., S. A. Kinnear, et al. (2000). "Redistribution and loss of side chain entropy upon formation of a calmodulin-peptide complex." Nature Structural Biology 7(1): Ishima, R., D. I. Freedberg, et al. (1999). "Flap opening and dimer-interface flexibility in the free and inhibitor-bound HIV protease, and their implications for function." Structure with Folding & Design 7(9): References Isn’t relaxation and dynamics contradictory? One would think that relaxation means that you don’t have dynamics but in NMR, relaxation requires dynamics – the return from an excited state to the ground state requires motion so relaxation is highly dependent on dynamics and its measurement allows us to probe the dynamics of a system.
. Direct determination of changes of interdomain orientation on ligation: Use of the orientational dependence of N-15 NMR relaxation in Abl SH(32). Biochemistry 38(32): Eisenmesser, E. Z., D. A. Bosco, et al. (2002). Enzyme dynamics during catalysis. Science 295(5559): Lee, A. L., S. A. Kinnear, et al. (2000). Redistribution and loss of side chain entropy upon formation of a calmodulin-peptide complex. Nature Structural Biology 7(1): Ishima, R., D. I. Freedberg, et al. (1999). Flap opening and dimer-interface flexibility in the free and inhibitor-bound HIV protease, and their implications for function. Structure with Folding & Design 7(9): References. Isn’t relaxation and dynamics contradictory One would think that relaxation means that you don’t have dynamics but in NMR, relaxation requires dynamics – the return from an excited state to the ground state requires motion so relaxation is highly dependent on dynamics and its measurement allows us to probe the dynamics of a system.")
2
NMR Relaxation and Dynamics
NMR relaxation measurements provide information on structure and dynamics at a wide range of time scales that is site specific: S2 ti Rex D kon koff In NMR we have many “handles” or sites to report on the local dynamics of that site – each 1H-15N or 1H-13C bond is a potential reporter. Without internal dynamics, most biomolecules cannot function – so when elucidating the function of a biomolecule, it is important to determine its dynamics along with its structure tc Biomolecules are not static: rotational diffusion (tc) translational diffusion (D) internal dynamics of backbone and sidechains (ti) degree of order for backbone and sidechains (S2) conformational exchange (Rex) interactions with other molecules (kon,koff) Biomolecules are often not globular spheres: anisotropy (Dxx,Dyy,Dzz) Structure/Dynamics Function
 translational diffusion (D) internal dynamics of backbone and sidechains (ti) degree of order for backbone and sidechains (S2) conformational exchange (Rex) interactions with other molecules (kon,koff) Biomolecules are often not globular spheres: anisotropy (Dxx,Dyy,Dzz) Structure/Dynamics Function.")
3
Dynamics on Different Time Scales
time scale example experiment type ns – ps bond librations lab frame relaxation reorientation of protein T1, T2 motions of protein main chain side chain rotations (case study #2) us – ms rapid conformational exchange lineshape analysis (case study #4) rotating frame relax. T1r ms – s interconversion of discrete magnetization exch. conformations > s protein folding exchange rates opening of 2o structures (H/D exchange) Structural Information from Relaxation anisotropy of overall shape (case study #1) distance information from cross-correlation relaxation Thermodynamics from Relaxation relationship to entropy (case study #3) NMR is unique in that it can probe a large range of timescales and each timescale is capable of reporting a specific kind of dynamics. Cross-correlated relaxation will not be discussed further but it can provide info on structure It can be used to validate molecular dynamics simulations (trajectories on the order of a nanosecond) and can complement other methods (ESR and Fluorescence depolarization sensitive to us-ns timescale and xray and ir/raman sensitive to ps time scale)
 us – ms rapid conformational exchange lineshape analysis. (case study #4) rotating frame relax. T1r. ms – s interconversion of discrete magnetization exch. conformations. > s protein folding exchange rates. opening of 2o structures (H/D exchange) Structural Information from Relaxation. anisotropy of overall shape (case study #1) distance information from cross-correlation relaxation. Thermodynamics from Relaxation. relationship to entropy (case study #3) NMR is unique in that it can probe a large range of timescales and each timescale is capable of reporting a specific kind of dynamics. Cross-correlated relaxation will not be discussed further but it can provide info on structure. It can be used to validate molecular dynamics simulations (trajectories on the order of a nanosecond) and can complement other methods (ESR and Fluorescence depolarization sensitive to us-ns timescale and xray and ir/raman sensitive to ps time scale)")
4
Relaxation Bloch equations – introduce relaxation to account for return of magnetization to equilibrium state: excite relax treat relaxation as a first order process: dM/dt = gM x B – R(M-Mo) where T1 (longitudinal or spin-lattice relaxation time) is the time constant used to describe rate at which Mz component of magnetization returns to equilibrium (the Boltzman distribution) after perturbation. T2 (transverse or spin-spin relaxation time) is the time constant used to describe rate at which Mxy component of magnetization returns to equilibrium (completely dephased, no coherence) after perturbation. R = 1/T 0 1/T2 0 /T1
 where. T1 (longitudinal or spin-lattice relaxation time) is the time constant used to describe rate at which Mz component of magnetization returns to equilibrium (the Boltzman distribution) after perturbation. T2 (transverse or spin-spin relaxation time) is the time constant used to describe rate at which Mxy component of magnetization returns to equilibrium (completely dephased, no coherence) after perturbation. R = 1/T /T /T1.")
5
so far, all we have is a time constant; is it possible to get a “picture” of what is causing relaxation? consider spontaneous emission of photon: transition probability a 1/l3 = s-1 for NMR consider stimulated emission: the excited state couples to the EMF inducing transitions – this phenomenon is observed in optical spectroscopy (eg. lasers) but its effect is negligible in RF fields. in a historic paper, Bloembergen, Purcell and Pound (Phys. Rev. 73, (1948)) found that relaxation is related to molecular motion (NMR relaxation time varied as a function of viscosity or temperature). They postulated that relaxation is caused by fluctuating fields caused by molecular motion. RF photon
 but its effect is negligible in RF fields. in a historic paper, Bloembergen, Purcell and Pound (Phys. Rev. 73, (1948)) found that relaxation is related to molecular motion (NMR relaxation time varied as a function of viscosity or temperature). They postulated that relaxation is caused by fluctuating fields caused by molecular motion. RF. photon.")
6
RF relaxation is dependent on motion of molecule
Zeeman interaction is independent of molecular motion therefore “local fields” exist that are orientation dependent and couple the magnetic moment with the external environment (the “lattice”) time dependence of interaction determines how efficiently the moment couples to the lattice it is the fluctuating “local fields” that induce transitions between energy levels of spins: RF source of local fields? timescale of fluctuation? Just as magnetization is used to tip magnetization away from z-axis, fluctuating fields are used to drive system back to equilibrium.
 time dependence of interaction determines how efficiently the moment couples to the lattice. it is the fluctuating local fields that induce transitions between energy levels of spins: RF. source of local fields timescale of fluctuation Just as magnetization is used to tip magnetization away from z-axis, fluctuating fields are used to drive system back to equilibrium.")
7
Relaxation Mechanisms
The relaxation of a nuclear spin is governed by the fluctuations of local fields that result when molecules reorient in a strong external magnetic field. Although a variety of interactions exist that can give rise to a fluctuating local field, the dominant sources of local fields experienced by 15N and 13C nuclei in biomolecules are dipole-dipole interactions and chemical shift anisotropy: Magnetic Dipole-Dipole Interaction - the dipolar interaction is a through-space coupling between two nuclear spins: q I S rIS CSA is field dependent but DD is not (remember TROSY) The local field experienced by spin I is: Hloc = gSh/r3IS ((3cos2q – 1)/2) Chemical Shift Anisotropy - the CSA interaction is due to the distribution of electrons surrounding the nucleus, and the local magnetic field generated by these electrons as they precess under the influence of the applied magnetic field. The effective field at the nucleus is: Hloc = Ho(1-s) where Ho is the strength of the applied static magnetic field and s is the orientationally dependent component of the CSA tensor.
 The local field experienced by spin I is: Hloc = gSh/r3IS ((3cos2q – 1)/2) Chemical Shift Anisotropy - the CSA interaction is due to the distribution of electrons surrounding the nucleus, and the local magnetic field generated by these electrons as they precess under the influence of the applied magnetic field. The effective field at the nucleus is: Hloc = Ho(1-s) where Ho is the strength of the applied static magnetic field and s is the orientationally dependent component of the CSA tensor.")
8
Expressions for Relaxation Rates
The relaxation rate constants for dipolar, CSA and quadrupolar interactions are linear combinations of spectral density functions, J(w). For example, one can derive the following equations for dipolar relaxation of a heteronucleus (i.e. 15N or 13C) by a proton R1,N = 1/T1,N = (d2/4)[J(wH-wN) + 3J(wN) + 6J(wH+wN)] R2,N = 1/T2,N = (d2/8)[4J(0) + J(wH-wN) + 3J(wN) + 6J(wH) + 6J(wH+wN)] NOE15N{1H} = 1 + (d2/4)(gH/gN) [6J(wH+wN) - J(wH-wN)] x T1,N where d = (gHgN(h/8p)/rHN3) The J(w) terms are “spectral density” terms that tell us what frequency of motions are going to contribute to relaxation. They have the form J(w) = tc/(1+w2tc2) and allow the motional characteristics of the system (the correlation time tc) to be expressed in terms of the “power” available for relaxation at frequency w: Note: maximum at J(w=108) term occurs when tauc=10-8 tc =10-7 J(w) tc =10-8 tc =10-9 w 106 107 108 109 1010
. For example, one can derive the following equations for dipolar relaxation of a heteronucleus (i.e. 15N or 13C) by a proton. R1,N = 1/T1,N = (d2/4)[J(wH-wN) + 3J(wN) + 6J(wH+wN)] R2,N = 1/T2,N = (d2/8)[4J(0) + J(wH-wN) + 3J(wN) + 6J(wH) + 6J(wH+wN)] NOE15N{1H} = 1 + (d2/4)(gH/gN) [6J(wH+wN) - J(wH-wN)] x T1,N. where d = (gHgN(h/8p)/rHN3) The J(w) terms are spectral density terms that tell us what frequency of motions are going to contribute to relaxation. They have the form. J(w) = tc/(1+w2tc2) and allow the motional characteristics of the system (the correlation time tc) to be expressed in terms of the power available for relaxation at frequency w: Note: maximum at J(w=108) term occurs when tauc=10-8. tc =10-7. J(w) tc =10-8. tc =10-9. w")
9
Measurement of Relaxation Rates
spin lattice relaxation is measured using an inversion recovery sequence: 180 t I It = Io(1-2exp(-t/T1)) t spin-spin relaxation is measured using a “spin echo” sequence (removes effect of field inhomogeneity): 90 t 180 t I It = Ioexp(-t/T2) t
) t. spin-spin relaxation is measured using a spin echo sequence (removes effect of field inhomogeneity): 90. t t. I. It = Ioexp(-t/T2) t.")
10
Measurement of Relaxation Rates
The inversion-recovery sequence and spin-echo sequence can be incorporated into a 2D 1H-15N HSQC pulse sequence in order to measure 15N T1 and T2 for each crosspeak in the HSQC: Measuring within 2D HSQC allows one to determine T1,T2 and NOE for each residue in protein Experimental techniques for 15N (a) R1, (b) R2, and (c) {1H}15N NOE spin relaxation measurements using two-dimensional, proton-detected pulse sequences. R1 and R2 intensity decay curves are recorded by varying the relaxation period T in a series of two dimensional experiments. The NOE is measured by recording one spectrum with saturation of 1H magnetization and one spectrum without saturation.
 R1, (b) R2, and (c) {1H}15N NOE spin relaxation measurements using two-dimensional, proton-detected pulse sequences. R1 and R2 intensity decay curves are recorded by varying the relaxation period T in a series of two dimensional experiments. The NOE is measured by recording one spectrum with saturation of 1H magnetization and one spectrum without saturation.")
11
Data Analysis Analysis of the relaxation data provides dynamical parameters (amplitude and timescale of motion) for each bond vector under study and parameters related to the overall shape of the molecule (rotational diffusion tensor): Dynamical parameters in proteins. (a) Overall rotational diffusion of the molecule is represented using an axially symmetric diffusion tensor for an ellipsoid of revolution. The diffusion constants are D|| for diffusion around the symmetry axis of the tensor and Dperp. for diffusion around the two orthogonal axes. For isotropic rotational diffusion, D|| = Dperp.. The equilibrium position of the ith N-H bond vector is located at an angle qi with respect to the symmetry axis of the diffusion tensor. Picosecond-nanosecond dynamics of the bond vector are depicted as stochastic motions within a cone with amplitude characterized by S2 and time scale characterized by te. (b) The value of S2 is graphed as a function of (-) qo calculated using Equation 22 for diffusion within a cone or (- - -) sf calculated using Equation 23 with q= 70.5° for the GAF (Gaussian Axial Fluctuation) model. from: Palmer, A. G. (2001). “NMR probes of molecular dynamics: Overview and comparison with other techniques.” Annual Review of Biophysics and Biomolecular Structure 30: 129.
 for each bond vector under study and parameters related to the overall shape of the molecule (rotational diffusion tensor): Dynamical parameters in proteins. (a) Overall rotational diffusion of the molecule is represented using an axially symmetric diffusion tensor for an ellipsoid of revolution. The diffusion constants are D|| for diffusion around the symmetry axis of the tensor and Dperp. for diffusion around the two orthogonal axes. For isotropic rotational diffusion, D|| = Dperp.. The equilibrium position of the ith N-H bond vector is located at an angle qi with respect to the symmetry axis of the diffusion tensor. Picosecond-nanosecond dynamics of the bond vector are depicted as stochastic motions within a cone with amplitude characterized by S2 and time scale characterized by te. (b) The value of S2 is graphed as a function of (-) qo calculated using Equation 22 for diffusion within a cone or (- - -) sf calculated using Equation 23 with q= 70.5° for the GAF (Gaussian Axial Fluctuation) model. from: Palmer, A. G. (2001). NMR probes of molecular dynamics: Overview and comparison with other techniques. Annual Review of Biophysics and Biomolecular Structure 30: 129.")
12
J(w) ~ { S2tc/(1+w2tc2) + (1-S2)t/(1+w2t2) }
Data Analysis “Model Free” analysis of relaxation based on Lipari, G. and A. Szabo “Model-Free Approach to the Interpretation of Nuclear Magnetic Resonance Relaxation in Macromolecules. 1. Theory and Range of Validity.” Journal of the American Chemical Society 104: 4546 (1982). Internal dynamics characterized by: internal correlation time, te spatial restriction of motion of bond vector, S2 S2 = 1 highly restricted S2 = 0 no restriction Rex, exchange contribution to T2 The spectral density terms in the relaxation equations are modified with terms representing internal dynamics and spatial restriction of bond vector: J(w) ~ { S2tc/(1+w2tc2) + (1-S2)t/(1+w2t2) } where t = tetc/(te + tc). Analysis of relaxation data using software package (eg. Model-Free or DASHA) allows the dynamical parameters to be calculated: tc Rex,S2,te 15N 1H measure: 15N T1 15N T2 15N{1H} NOE calculate relaxation data for a given tc recalculate by varying values of S2, te and Rex Compare measured vs. calc. value
. Internal dynamics characterized by: internal correlation time, te. spatial restriction of motion of bond vector, S2. S2 = 1 highly restricted. S2 = 0 no restriction. Rex, exchange contribution to T2. The spectral density terms in the relaxation equations are modified with terms representing internal dynamics and spatial restriction of bond vector: J(w) ~ { S2tc/(1+w2tc2) + (1-S2)t/(1+w2t2) } where t = tetc/(te + tc). Analysis of relaxation data using software package (eg. Model-Free or DASHA) allows the dynamical parameters to be calculated: tc. Rex,S2,te. 15N. 1H. measure: 15N T1. 15N T2. 15N{1H} NOE. calculate relaxation data for a given tc. recalculate by varying values of S2, te and Rex. Compare measured vs. calc. value.")
13
Defining Regions of Structure using NMR Relaxation Measurements

14
Case study #1 In many tyrosine kinases, the contacts between SH3 and SH2 domains are reduced and SH3–SH2 double domain constructs are ideal systems to evaluate the ability of relaxation studies to define inter-domain orientations. Using a SH3–SH2 (SH32) segment from the human Abelson tyrosine kinase, the relative orientation of the domains could be defined using 15N relaxation data [124]. A model peptide comprising a phosphotyrosine containing peptide (SH2 ligand) chemically linked to proline-rich peptide (SH3 ligand) was synthesised. Analysis of the correlation times for individual SH2 and SH3 domains, and for unliganded and ligand-bound SH(32), demonstrated that while retaining some inter-domain flexibility, the SH3–SH2 linker sequence induces a restriction of individual domain motions within the SH(32) construct. An increased global correlation time upon binding to the synthetic dual-target peptide demonstrated the ligand’s ability to further reduce the independence between individual domain motions. Using an improved calculation of the rotational diffusion axes from the R2=R1 ratios, the authors were able to define the relative positions of the domains and to show that this is modified by the binding event. The functional importance of inter-domain dynamics in signal transduction was shown subsequently in studies of proteins containing multiple Src Homology domains [125,126], providing new insights into the close interplay between structure and dynamics used to achieve function. It is now believed that inter-domain flexibility is necessary to facilitate binding to many different independent phosphotyrosine or proline-rich ligands from diverse components of the signal transduction machinery.
 segment from the human Abelson tyrosine kinase, the relative orientation of the domains could be defined using 15N relaxation data [124]. A model peptide comprising a phosphotyrosine containing peptide (SH2 ligand) chemically linked to proline-rich peptide (SH3 ligand) was synthesised. Analysis of the correlation times for individual SH2 and SH3 domains, and for unliganded and ligand-bound SH(32), demonstrated that while retaining some inter-domain flexibility, the SH3–SH2 linker sequence induces a restriction of individual domain motions within the SH(32) construct. An increased global correlation time upon binding to the synthetic dual-target peptide demonstrated the ligand’s ability to further reduce the independence between individual domain motions. Using an improved calculation of the rotational diffusion axes from the R2=R1 ratios, the authors were able to define the relative positions of the domains and to show that this is modified by the binding event. The functional importance of inter-domain dynamics in signal transduction was shown subsequently in studies of proteins containing multiple Src Homology domains [125,126], providing new insights into the close interplay between structure and dynamics used to achieve function. It is now believed that inter-domain flexibility is necessary to facilitate binding to many different independent phosphotyrosine or proline-rich ligands from diverse components of the signal transduction machinery.")
15
Red indicates chemical shift changes observed upon ligand binding

16
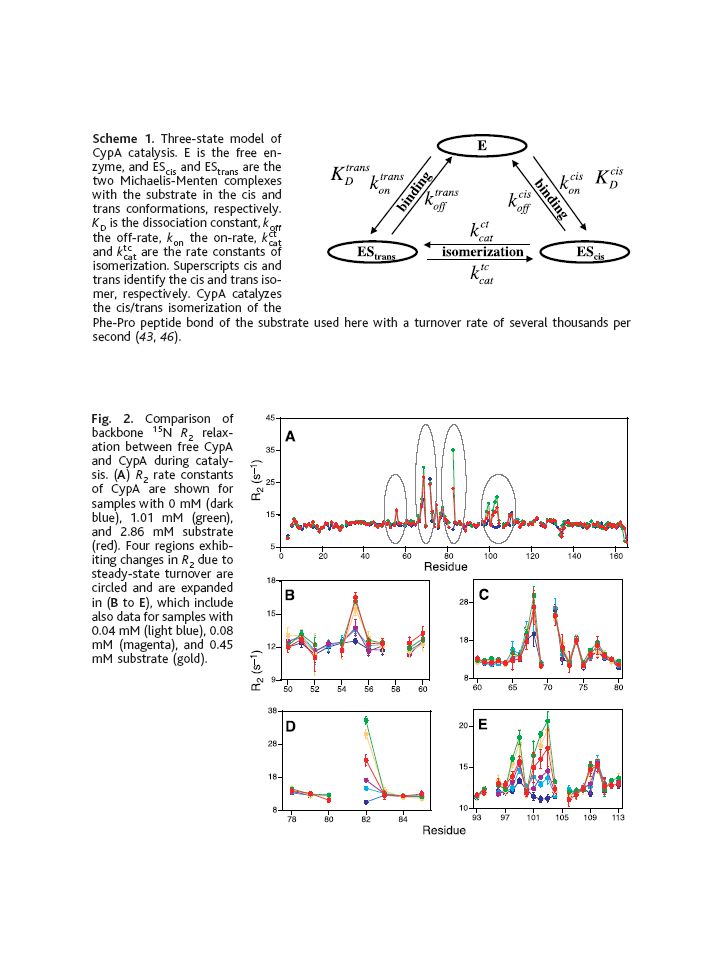
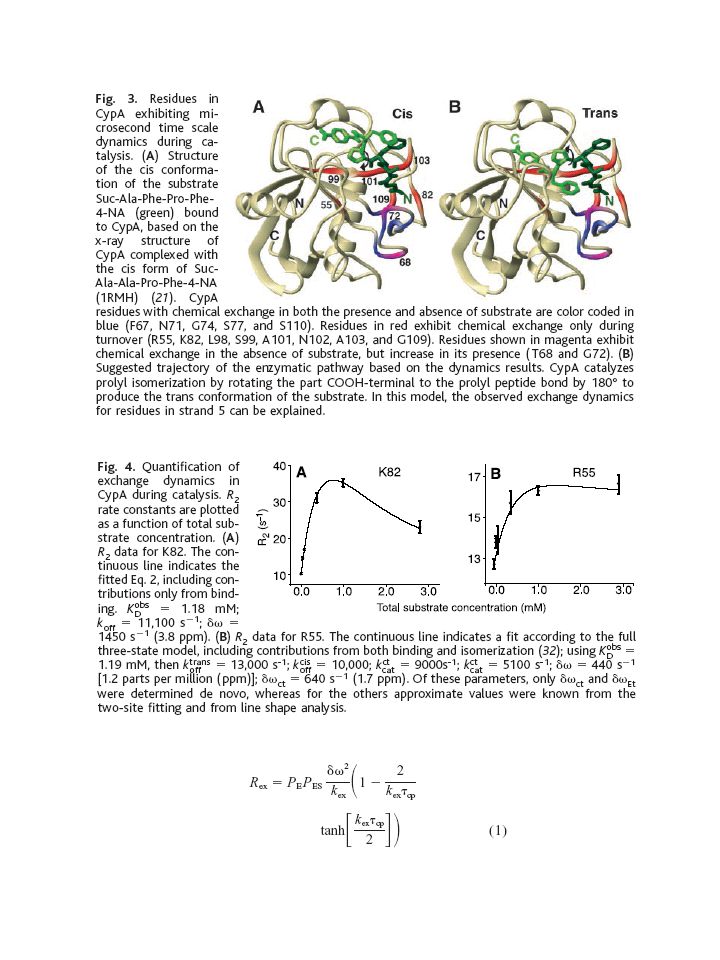
Case study #2 Eisenmesser et al. [190] show that in the case of a peptidyl-prolyl cis/trans isomerase, cyclophilin A, exchange contributions to relaxation measured as a function of substrate concentration allow characterisation of enzyme dynamics during catalysis. Differential build-up of backbone 15N R2 relaxation rates allows the behaviour of residues to be associated solely with binding or with binding and isomerisation, since build-up curves which peak when free enzyme is still present may be presumed to be associated with binding. Residues for which R2 build-up curves increase monotonically with substrate concentration are sensitive to motions associated with isomerisation of the prolyl peptide bond. Eisenmesser et al. show that the observed effects cannot arise solely from isomerisation of the substrate against the background of a rigid protein and this provides evidence for collective conformational fluctuations that may be coupled to those of the catalytic arginine side-chain. The dependence of the dynamic properties of the protein on ligand concentration can be used to distinguish contributions from substrate binding or product release and contributions from catalysis.123 Investigations are facilitated if the enzyme system has been highly characterized biochemically, so that a well-developed kinetic mechanism exists and multiple substrate analogues, inhibitors, and transition state analogues are available. The large body of information available on adenylate kinase, DHFR, and HIV-1 protease exemplify these approaches. Most studies of enzymes to date have been performed on inhibited proteins or in the absence of substrates. In the case of cyclophilin A, however, measurements of exchange broadening were performed while the protein was actively turning over substrate.123

21
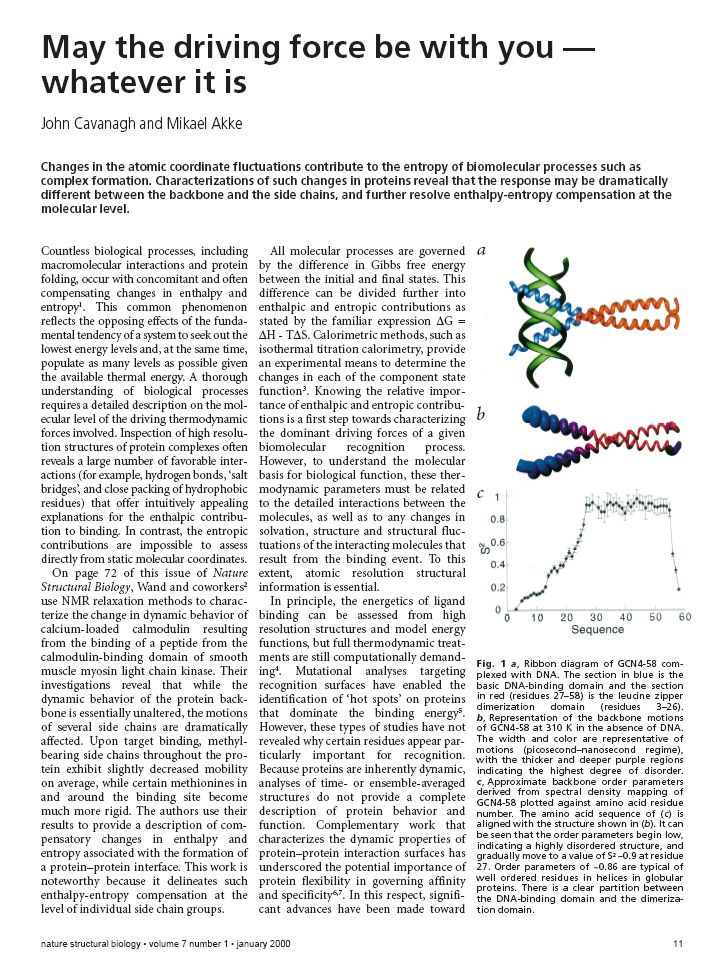
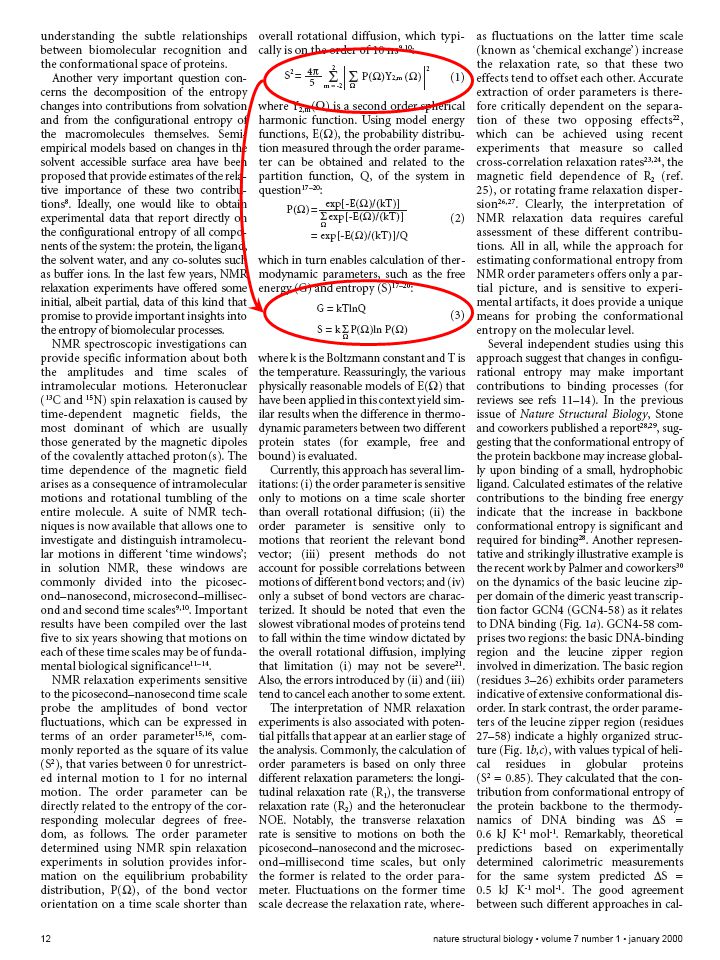
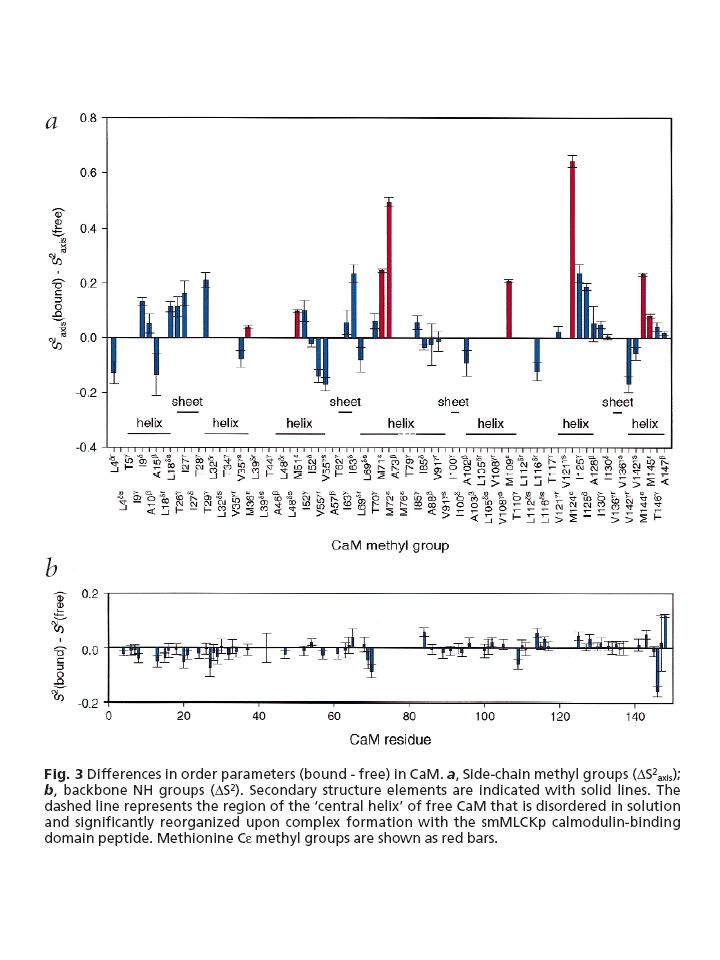
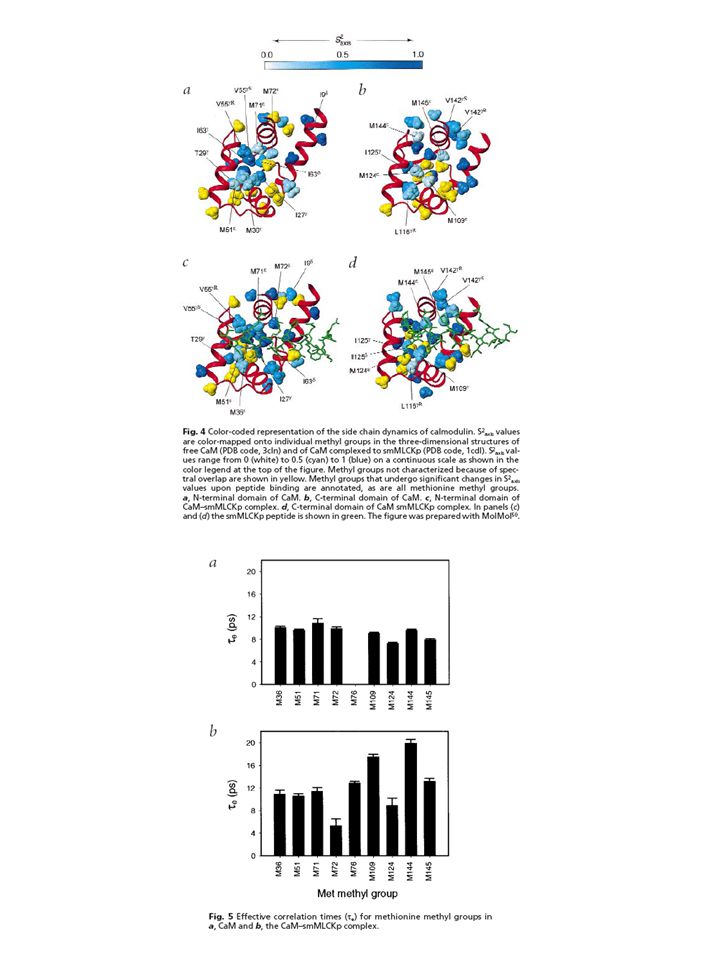
Case study #3 A detailed study of the complex between calcium saturated calmodulin and a peptide model of the calmodulin-binding domain of smooth muscle myosin light chain kinase [115] described the role of conformational entropy changes involving side-chain motions. The backbone of calmodulin was found to be nearly unaffected by binding, whereas the dynamics of side-chains are significantly perturbed with an overall loss of ps–ns time scale mobility. Comparison of the total entropic cost of binding (estimated at 146 kJ mol21) with the total free energy change of complex formation (250 kJ mol21) implies considerable entropy/enthalpy compensation. The favourable enthalpic contributions are provided by the extensive buried hydrophobic surface that characterises the calmodulin–peptide complex. Interestingly, despite this global rigidification, some conserved methionine side-chains, important for peptide recognition, exhibit significant increases in ps–ns time-scale motion upon binding, reflecting a re-distribution of conformational entropy at the protein surface.
 with the total free energy change of complex formation (250 kJ mol21) implies considerable entropy/enthalpy compensation. The favourable enthalpic contributions are provided by the extensive buried hydrophobic surface that characterises the calmodulin–peptide complex. Interestingly, despite this global rigidification, some conserved methionine side-chains, important for peptide recognition, exhibit significant increases in ps–ns time-scale motion upon binding, reflecting a re-distribution of conformational entropy at the protein surface.")
24
Case study #4 Crystal structures to date had only “closed flaps” or flaps in “semi-open” state – are flaps flexible (can flexibility of flap be correlated to catalytic rate) Role of ms–ms time-scale motions in substrate binding Because of the possible functional significance of conformational exchange on the ms–ms time-scale, these motions were characterised in great detail for HIV-1 protease, with attempts to define the source of the exchange terms. Conformational exchange contributions to the transverse 15N relaxation rates in the DMP323-bound form of the enzyme are localised in the tips of the flaps and in the inter-monomer b-sheet [13,85]. Ishima et al. suggested the use of the ð dvH= dvNÞ2 ratio derived from both 1H and 15N relaxation dispersion measurements to gain an insight into the source of the chemical shift difference between exchanging forms of the protease [183]. Large values of this term may reflect the effects of varying distance from an aromatic ring, while small values may indicate motion of the NH vector itself. This analysis suggests that the ms–ms time-scale motion affecting the inter-monomer b-sheet results from intrinsic local fluctuations [184]. The measurement of R2 relaxation rates for 13 nuclei in CHD2 groups provides complementary information on the dynamic properties of the inter-monomer interface, confirming the presence of microsecond timescale motions in what is apparently a well-ordered structural element [185,186]. The methyl groups of three interfacial residues exhibit elevated R2 rates, and it was estimated that the exchange correlation time for these side-chains is greater than 1 ms. Chemical exchange was noted for the same residues in the free protein and values of ð dvH= dvNÞ2 indicates that the origin of the exchange is fluctuations of backbone f= w angles, on a time-scale less than 100 ms. In the intermonomer b-sheet itself, larger effects are noted for the liganded form of the protein than for the free form, suggesting larger conformational fluctuations in the bsheet when inhibited. The authors suggest that maturation of the protease may require this increased flexibility on the microsecond time-scale in its substrate-bound form. Finally, residues in the tips of the flaps are characterised by more extensive exchange than in the DMP323-bound form. This was shown to arise from fluctuations in backbone f= w angles on a time-scale less than 100 ms, but for several residues, large values of ð dvH= dvNÞ2 reflect additional contributions from changes in position relative to the aromatic ring of F53, on the same time-scale [184]. Coupling of fluctuations of the phenylalanine ring to backbone motions supports the proposal that interaction of substrate or inhibitor with the hydrophobic side-chain may facilitate flap opening. goal: measure effects of inhibitor binding on conformational fluctuations of HIV protease on ms-ms timescale. sample: 0.3mM protease dimer + DMP323 inhibitor experiments: 1H and 15N T2 and T1r at 500MHz
 Role of ms–ms time-scale motions in substrate binding Because of the possible functional significance of conformational exchange on the ms–ms time-scale, these motions were characterised in great detail for HIV-1 protease, with attempts to define the source of the exchange terms. Conformational exchange contributions to the transverse 15N relaxation rates in the DMP323-bound form of the enzyme are localised in the tips of the flaps and in the inter-monomer b-sheet [13,85]. Ishima et al. suggested the use of the ð dvH= dvNÞ2 ratio derived from both 1H and 15N relaxation dispersion measurements to gain an insight into the source of the chemical shift difference between exchanging forms of the protease [183]. Large values of this term may reflect the effects of varying distance from an aromatic ring, while small values may indicate motion of the NH vector itself. This analysis suggests that the ms–ms time-scale motion affecting the inter-monomer b-sheet results from intrinsic local fluctuations [184]. The measurement of R2 relaxation rates for 13 nuclei in CHD2 groups provides complementary information on the dynamic properties of the inter-monomer interface, confirming the presence of microsecond timescale motions in what is apparently a well-ordered structural element [185,186]. The methyl groups of three interfacial residues exhibit elevated R2 rates, and it was estimated that the exchange correlation time for these side-chains is greater than 1 ms. Chemical exchange was noted for the same residues in the free protein and values of ð dvH= dvNÞ2 indicates that the origin of the exchange is fluctuations of backbone f= w angles, on a time-scale less than 100 ms. In the intermonomer b-sheet itself, larger effects are noted for the liganded form of the protein than for the free form, suggesting larger conformational fluctuations in the bsheet when inhibited. The authors suggest that maturation of the protease may require this increased flexibility on the microsecond time-scale in its substrate-bound form. Finally, residues in the tips of the flaps are characterised by more extensive exchange than in the DMP323-bound form. This was shown to arise from fluctuations in backbone f= w angles on a time-scale less than 100 ms, but for several residues, large values of ð dvH= dvNÞ2 reflect additional contributions from changes in position relative to the aromatic ring of F53, on the same time-scale [184]. Coupling of fluctuations of the phenylalanine ring to backbone motions supports the proposal that interaction of substrate or inhibitor with the hydrophobic side-chain may facilitate flap opening. goal: measure effects of inhibitor binding on conformational fluctuations of HIV protease on ms-ms timescale. sample: 0.3mM protease dimer + DMP323 inhibitor. experiments: 1H and 15N T2 and T1r at 500MHz.")
25
Spin lock field represents a “fluctuating field”
Relaxation rate highest when spin lock field matches exchange lifetime

26
result: inhibitor binding enhances dyanamics on the ms timescale of the b-sheet interface, a region that stabilizes the dimeric structure of the protease (residues 95-98). Relaxation behavior of the flap (residues 48-55) indicates a transition from a slow dynamic equilibrium between semi-open conformations on the 100ms timescale to a closed conformation upon inhibitor binding.
 indicates a transition from a slow dynamic equilibrium between semi-open conformations on the 100ms timescale to a closed conformation upon inhibitor binding..")
27
References Palmer, A. G. (2001). “NMR probes of molecular dynamics: Overview and comparison with other techniques.” Annual Review of Biophysics and Biomolecular Structure 30: 129. Palmer, A. G., C. D. Kroenke and J. P. Loria (2001). “Nuclear magnetic resonance methods for quantifying microsecond-to-millisecond motions in biological macromolecules.” Nuclear Magnetic Resonance of Biological Macromolecules, Pt B 339: 204. Brutscher, B. (2000). “Principles and applications of cross-correlated relaxation in biomolecules.” Concepts in Magnetic Resonance 12(4): 207. Engelke, J. and H. Ruterjans (1999). Recent Developments in Studying the Dynamics of Protein Structures from 15N and 13C Relaxation Time Measurements. Biological Magnetic Resonance. N. R. Krishna and L. J. Berliner. New York, Kluwer Academic/ Plenum Publishers. 17: Fischer, M. W. F., A. Majumdar and E. R. P. Zuiderweg (1998). “Protein NMR relaxation: theory, applications and outlook.” Progress in Nuclear Magnetic Resonance Spectroscopy 33(4): Daragan, V. A. and K. H. Mayo (1997). “Motional Model Analyses of Protein and Peptide Dynamics Using 13C and 15N NMR Relaxation.” Progress in Nuclear Magnetic Resonance Spectroscopy 31: Cavanagh, J., W. J. Fairbrother, A. G. Palmer and N. J. Skelton (1996). Protein NMR Spectroscopy: Principles and Practice, Academic Press. Chapter 5 “Relaxation and Dynamic Processes” Nicholson, L. K., L. E. Kay and D. A. Torchia (1996). Protein Dynamics as Studied by Solution NMR Techniques. NMR Spectroscopy and Its Application to Biomedical Research. S. K. Sarkar.
. NMR probes of molecular dynamics: Overview and comparison with other techniques. Annual Review of Biophysics and Biomolecular Structure 30: 129. Palmer, A. G., C. D. Kroenke and J. P. Loria (2001). Nuclear magnetic resonance methods for quantifying microsecond-to-millisecond motions in biological macromolecules. Nuclear Magnetic Resonance of Biological Macromolecules, Pt B 339: 204. Brutscher, B. (2000). Principles and applications of cross-correlated relaxation in biomolecules. Concepts in Magnetic Resonance 12(4): 207. Engelke, J. and H. Ruterjans (1999). Recent Developments in Studying the Dynamics of Protein Structures from 15N and 13C Relaxation Time Measurements. Biological Magnetic Resonance. N. R. Krishna and L. J. Berliner. New York, Kluwer Academic/ Plenum Publishers. 17: Fischer, M. W. F., A. Majumdar and E. R. P. Zuiderweg (1998). Protein NMR relaxation: theory, applications and outlook. Progress in Nuclear Magnetic Resonance Spectroscopy 33(4): Daragan, V. A. and K. H. Mayo (1997). Motional Model Analyses of Protein and Peptide Dynamics Using 13C and 15N NMR Relaxation. Progress in Nuclear Magnetic Resonance Spectroscopy 31: Cavanagh, J., W. J. Fairbrother, A. G. Palmer and N. J. Skelton (1996). Protein NMR Spectroscopy: Principles and Practice, Academic Press. Chapter 5 Relaxation and Dynamic Processes Nicholson, L. K., L. E. Kay and D. A. Torchia (1996). Protein Dynamics as Studied by Solution NMR Techniques. NMR Spectroscopy and Its Application to Biomedical Research. S. K. Sarkar.")
28
Peng, J. W. and G. Wagner (1994). “Investigation of protein motions via relaxation measurements.” Methods in Enzymology 239: Wagner, G., S. Hyberts and J. W. Peng (1993). Study of Protein Dynamics by NMR. NMR of Proteins. G. M. Clore and A. M. Gronenborn, CRC Press: Mini Reviews: Ishima, R. and D. A. Torchia (2000). “Protein dynamics from NMR.” Nature Structural Biology 7(9): Kay, L. E. (1998). “Protein dynamics from NMR.” Nature Structural Biology 5: Palmer, A. G., 3rd (1997). “Probing molecular motion by NMR.” Current Opinion in Structural Biology 7(5): Case Studies: Fushman, D., R. Xu, et al. (1999). "Direct determination of changes of interdomain orientation on ligation: Use of the orientational dependence of N-15 NMR relaxation in Abl SH(32)." Biochemistry 38(32): Eisenmesser, E. Z., D. A. Bosco, et al. (2002). "Enzyme dynamics during catalysis." Science 295(5559): Lee, A. L., S. A. Kinnear, et al. (2000). "Redistribution and loss of side chain entropy upon formation of a calmodulin-peptide complex." Nature Structural Biology 7(1): Ishima, R., D. I. Freedberg, et al. (1999). "Flap opening and dimer-interface flexibility in the free and inhibitor-bound HIV protease, and their implications for function." Structure with Folding & Design 7(9):
. Study of Protein Dynamics by NMR. NMR of Proteins. G. M. Clore and A. M. Gronenborn, CRC Press: Mini Reviews: Ishima, R. and D. A. Torchia (2000). Protein dynamics from NMR. Nature Structural Biology 7(9): Kay, L. E. (1998). Protein dynamics from NMR. Nature Structural Biology 5: Palmer, A. G., 3rd (1997). Probing molecular motion by NMR. Current Opinion in Structural Biology 7(5): Case Studies: Fushman, D., R. Xu, et al. (1999). Direct determination of changes of interdomain orientation on ligation: Use of the orientational dependence of N-15 NMR relaxation in Abl SH(32). Biochemistry 38(32): Eisenmesser, E. Z., D. A. Bosco, et al. (2002). Enzyme dynamics during catalysis. Science 295(5559): Lee, A. L., S. A. Kinnear, et al. (2000). Redistribution and loss of side chain entropy upon formation of a calmodulin-peptide complex. Nature Structural Biology 7(1): Ishima, R., D. I. Freedberg, et al. (1999). Flap opening and dimer-interface flexibility in the free and inhibitor-bound HIV protease, and their implications for function. Structure with Folding & Design 7(9):")
Similar presentations

 (Fall Term, 2005) Department of Chemistry National Sun Yat-sen University 無機物理方法(核磁共振部分)>")


>")


 A photon generates both an electric and a magnetic field A current passing through a wire also generates both an electric and a magnetic.>")


>")
