Download presentation
Presentation is loading. Please wait.

1
2011-2012 SHC Student Experiences Survey March 22, 2012 Prepared by Dr. Jamie Franco-Zamudio

2
2011 SHC Student Experiences Survey Goal: To increase retention by examining the factors that affect Spring Hill College students’ satisfaction and commitment. Method: Franco-Zamudio solicited questions from faculty and staff at SHC in August and September of 2011. Once the online survey was constructed, the link was emailed to all SHC students enrolled in fall of 2011. Survey questions addressed – student expectations, – satisfaction with academics and social activities, – technological needs, – alcohol and drug use, – perceptions of campus safety, and – confidence in academic abilities.

3
2011 SHC Student Experiences Survey Questionnaire Development Team Questionnaire development: Joe Deighton, Dean of Students, Student Affairs; Margarita Perez, Associate Dean of Students, Student Affairs; George Sims, Provost, Academic Affairs; Theresa McGonagle-Crider, Assistant Vice-President for Academic Affairs; Ramona Hill, Vice-President for Enrollment Management; Dan Sepion, Director of Residential Life and Student Conduct, Housing; Lynda Olen, Counselor, Wellness Center; Brian Studebaker, Director, Admissions; Julie LaSalle, Director of Student Involvement, Student Affairs; Daniel Jesus Iglesias, Psychology, Student Researcher; and the Student Affairs Department. Research Assistants: Victoria Gonzalez, Daniel Jesus Iglesias, Olivia Garcia, Carolina Dominguez, and Emily Martin.

4
Method Method: In January of 2012, Franco-Zamudio trained research assistant, Gonzalez, to code the open-ended questions for common responses. Iglesias conducted similar analyses and the coding scheme was deemed appropriate. Gonzalez trained two research assistants to quantitatively code the open-ended questions for common themes. Franco-Zamudio analyzed the data; the frequencies and descriptive statistics are outlined in this report.

5
Participant Demographics Three hundred and eighty-two SHC students completed one or more sections of the survey between September and November of 2011. The demographic representation is in line with the SHC Common Data Set (2010-2011). The average age of the participants was 20 years (range 18-59).
. The average age of the participants was 20 years (range 18-59)..")
6
NumberPercentage Gender Men8021% Women26269% Declined to state4010% Race/Ethnicity White/European-American23361% Black/African-American6818% Hispanic/Latino236% Asian-American62% Other51% Declined to state4712% Additional Information Commuters6116% Transfer Students174% Students in Learning Communities8522%

7
Results: Academic Confidence Students completed the 17-item Academic Self- Efficacy Scale (Chemers, Hu, & Garcia, 2001; M=4.08, SD=.50). – Students indicated their level of agreement (1= Strongly disagree to 5= Strongly agree) with statements such as, “With the right amount of effort, I can overcome any obstacles I might face in school;” “I believe I have the ability to meet any demands placed on me throughout the course of my studies;” “I know how to schedule my time to accomplish my schoolwork;” and “I can understand a vast amount of academic information.” – There were no significant differences in responses for gender or race/ethnicity.
 with statements such as, With the right amount of effort, I can overcome any obstacles I might face in school; I believe I have the ability to meet any demands placed on me throughout the course of my studies; I know how to schedule my time to accomplish my schoolwork; and I can understand a vast amount of academic information. – There were no significant differences in responses for gender or race/ethnicity..")
9
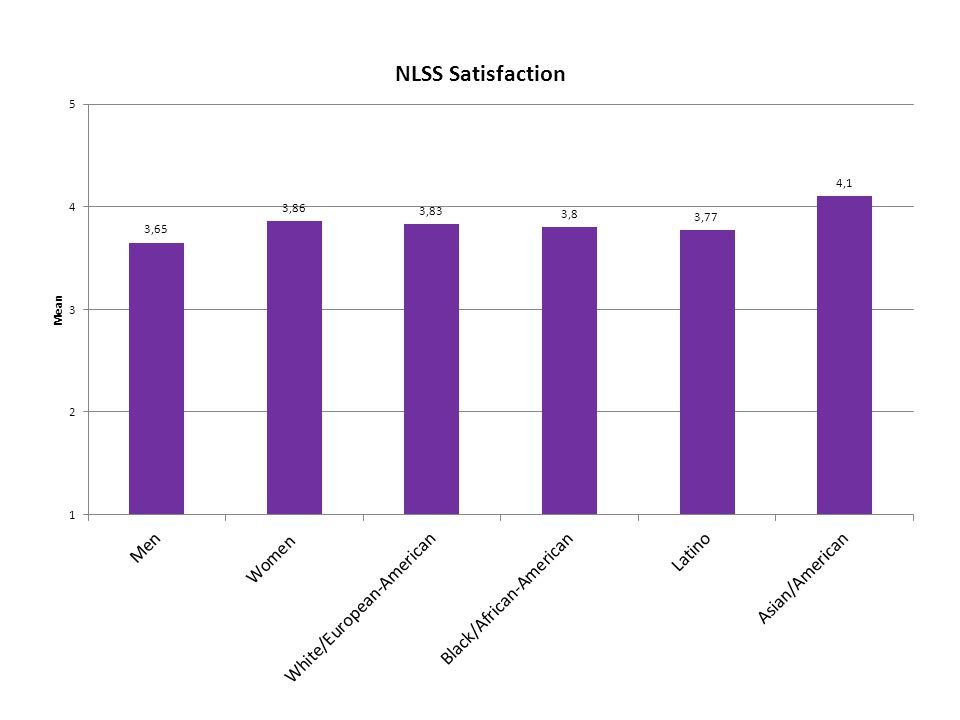
Results: Student satisfaction Students completed the 21-item Noel Levitz Student Satisfaction Survey ( M=3.82, SD=.54). Students indicated their level of agreement (1= Strongly disagree to 5= Strongly agree) with statements such as, “It is an enjoyable experience to be a student at SHC;” “SHC staff and faculty show concern for students as individuals;” “Admission counselors accurately portray the campus in their recruiting practices;” “Living conditions in residence halls are comfortable;” and “This campus is safe and secure for all students.” – There were significant differences for gender, F(1, 338) =10.03, p<.01, with women (M=3.86, SD=.52) reporting greater satisfaction than men (M=3.65, SD=.55).
 with statements such as, It is an enjoyable experience to be a student at SHC; SHC staff and faculty show concern for students as individuals; Admission counselors accurately portray the campus in their recruiting practices; Living conditions in residence halls are comfortable; and This campus is safe and secure for all students. – There were significant differences for gender, F(1, 338) =10.03, p<.01, with women (M=3.86, SD=.52) reporting greater satisfaction than men (M=3.65, SD=.55)..")
11
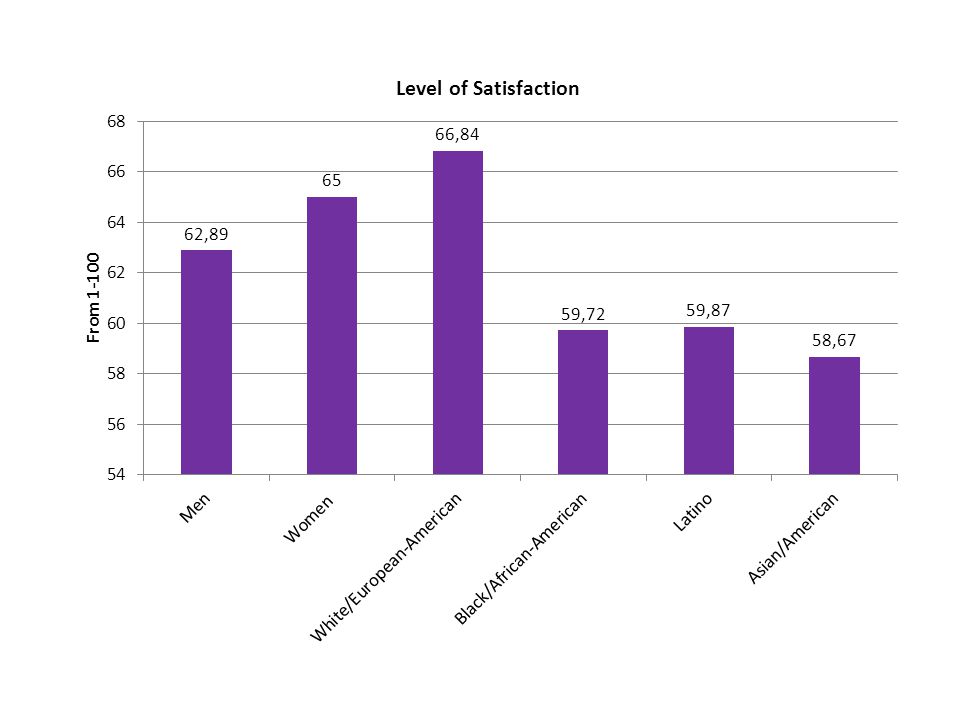
Student Satisfaction Students also responded to a one-item question: “How satisfied are you with your social life on campus?” Students indicated satisfaction on a 1 to 100-point feeling thermometer. 1100 There were significicant differences for race/ethnicity, F(4, 329) =2.92, p=.05, with White/European-American students reporting greater satisfaction M=66.84, SD= 25.39) than Black/African-American students M=59.72, SD= 27.44).
 =2.92, p=.05, with White/European-American students reporting greater satisfaction M=66.84, SD= 25.39) than Black/African-American students M=59.72, SD= 27.44)..")
13
What is the number one thing that students spend their time doing?* Homework (n=236) Socializing (n=90) Procrastinating (n=87) Involvement in clubs or organizations (n=38) Exercising (n=34) Greek life (n=31) Service (n=28) *Students were instructed to rank order the choices listed above.
 Socializing (n=90) Procrastinating (n=87) Involvement in clubs or organizations (n=38) Exercising (n=34) Greek life (n=31) Service (n=28) *Students were instructed to rank order the choices listed above.")
15
Favorite Social Activities Students’ favorite social activities were hanging out with friends (n=137), Greek activities (n=52), parties (n=51), and school-organized events (n=41). “Spring Hill is my home away from home and I truly value being a part of the Spring Hill community and everything that comes with it.”

16
What would you like to see on campus? Football (n=7) Concerts/ Music events (n=28) Physical Activities (n=15) – sports – games – intramurals – teams Lectures/ Speakers (n=2) More Greek life events (n=7) Movie nights (n=6) Laser tag/ dodge ball/ kick ball/ disc golf (games) (n=11) Food events (n=5) Community service (n=3) Cultural events (n=4) Clubs (n=7) Tailgate (n=3) Formal dances (n=17) Pep rallies (n=2)
 Concerts/ Music events (n=28) Physical Activities (n=15) – sports – games – intramurals – teams Lectures/ Speakers (n=2) More Greek life events (n=7) Movie nights (n=6) Laser tag/ dodge ball/ kick ball/ disc golf (games) (n=11) Food events (n=5) Community service (n=3) Cultural events (n=4) Clubs (n=7) Tailgate (n=3) Formal dances (n=17) Pep rallies (n=2).")
19
Do you feel safe on campus? Why or why not? Yes Public Safety (n=94) Community (n=33) Gated/ enclosed campus (n=13) “Closed” campus at night (n=6) Quick response time from public safety (n=5) Good lighting (n=4) Presence of RA’s (n=1) No Car break-ins/jacking (n=40) Recent assaults (n=33) Lack of security presence (n=18) Petty crimes/theft (n=15) Trespassing and intrusion (n=7) Not checking ID’s at gate (n=6) Break- ins (n=6) Ease of dormitory access (n=5) Pests/ raccoons/ possums (n=5) Speeding on roads (n=2)
 Community (n=33) Gated/ enclosed campus (n=13) Closed campus at night (n=6) Quick response time from public safety (n=5) Good lighting (n=4) Presence of RA’s (n=1) No Car break-ins/jacking (n=40) Recent assaults (n=33) Lack of security presence (n=18) Petty crimes/theft (n=15) Trespassing and intrusion (n=7) Not checking ID’s at gate (n=6) Break- ins (n=6) Ease of dormitory access (n=5) Pests/ raccoons/ possums (n=5) Speeding on roads (n=2).")
24
Retention SHC Student Experiences Survey Goal: To increase retention by examining the factors that affect Spring Hill College students’ satisfaction and commitment. There were several reasons why students reported that they never considered leaving SHC (n=97) Sense of community Perfect fit Small campus size. Only 4% (n=17) of the students reported that they are/were seriously considered leaving SHC.
 Sense of community Perfect fit Small campus size. Only 4% (n=17) of the students reported that they are/were seriously considered leaving SHC..")
25
Retention While some students reported that the thought crossed their mind due to – Cost (n=33) – Lack of a social life (n=19) – Homesickness (n=15) – Lack of course offerings (n=14) – School size (n=11) These same students reported that they would not leave because of the Friends/relationships/Community (n=30) Level of academics (n=19) Financial assistance (n= 16) Greek life (n=10) Professors (n=7) Parental influence (n=4) Athletics (n=3)
 – Lack of a social life (n=19) – Homesickness (n=15) – Lack of course offerings (n=14) – School size (n=11) These same students reported that they would not leave because of the Friends/relationships/Community (n=30) Level of academics (n=19) Financial assistance (n= 16) Greek life (n=10) Professors (n=7) Parental influence (n=4) Athletics (n=3)")
Similar presentations


 Survey FY 2012 ROSI Survey Results Virginia Department of Behavioral Health and Developmental Services January,>")

 1997 to 2013.>")
 ◦ Females: 52 (66%) ◦ Males:>")

 756-2335 or For the complete report.>")


 at UW: Student Life Student Life Assessment Meeting 02 October 2014 Debbie McGhee.>")


