Download presentation
Presentation is loading. Please wait.

1
Line of Best Fit

2
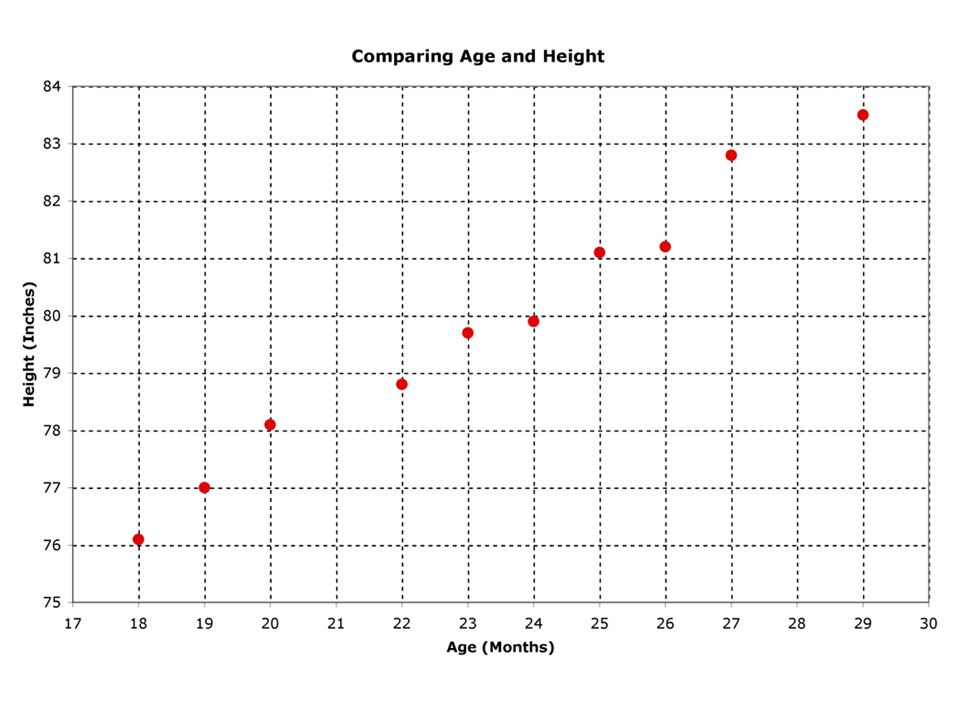
Age (months) Height (inches) 1876.1 1977 2078.1 21 2278.8 2379.7 2479.9 2581.1 2681.2 2782.8 28 2983.5 Work with your group to make a prediction for the height at: 21 months 28 months 20 years
 Height (inches) Work with your group to make a prediction for the height at: 21 months 28 months 20 years")
4
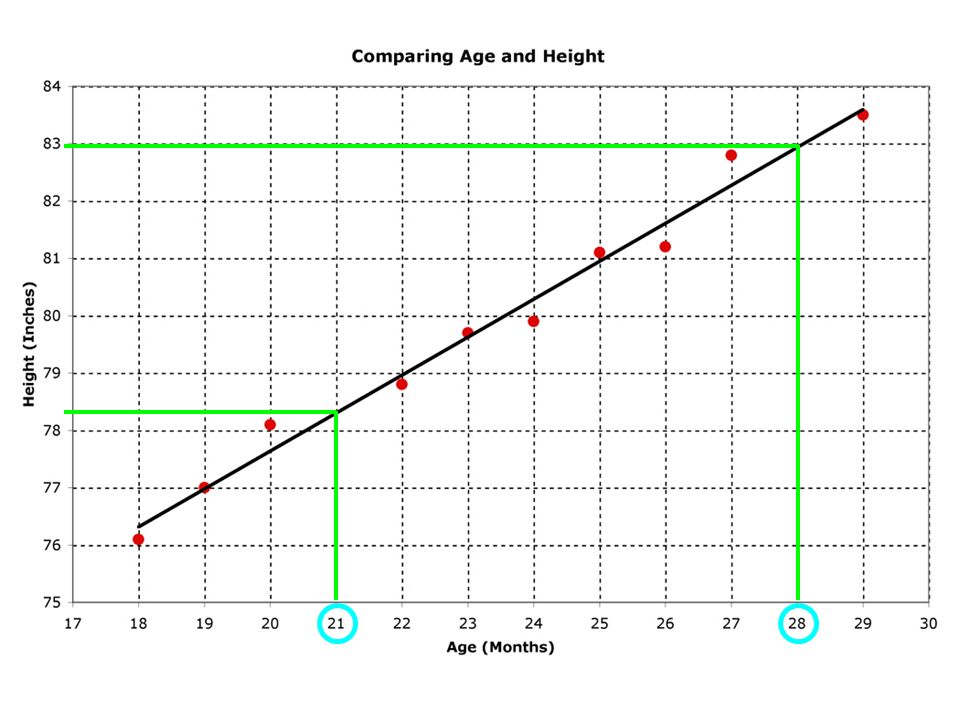
Line of Best Fit Definition - A Line of Best is a straight line on a Scatterplot that comes closest to all of the dots on the graph. A Line of Best Fit does not touch all of the dots. A Line of Best Fit is useful because it allows us to: –Understand the type and strength of the relationship between two sets of data –Predict missing Y values for given X values, or missing X values for given Y values

9
Equation For Line of Best Fit y = 0.6618x + 64.399 X (months)FormulaY (inches) 21 0.6618(21) + 64.399 28 0.6618(28) + 64.399 240 0.6618(240) + 64.399 78.3 82.9 223.3
FormulaY (inches) (21) (28) (240)")
10
Predicting Data with Scatterplots Interpretation - Making a prediction for an unknown Y value based on a given X value within a range of known data Extrapolation - Making a prediction for an unknown Y value based on a given X value outside of a range of known data More accurate: Interpretation Less accurate: Extrapolation

Similar presentations


 Think of how old you are in months, and your shoe size. 2.) Plot on.>")
 Page 350..359: 10b, 12a, 16c, 16e.>")


 Using Data to Predict: Focus L Scatterplots.>")

