Download presentation
Presentation is loading. Please wait.

1
2-5 Using Linear Models Make predictions by writing linear equations that model real-world data.

2
Scatter Plots A scatter plot is a graph that displays two sets of data as ordered pairs. Scatter plots can help show whether or not two sets of data are related.

3
Making a Scatter Plot Make a scatter plot for the data
What’s a car worth? Age (yr) Value (dollars) 3 11,000 1 15,000 2 12,000 4 8,000 7 3,000 5 7,000 8 1,000 6,000 10,000 6
 Value (dollars) 3. 11, , , , , , ,000. 6, ,")
4
Correlation A correlation is a relationship between the sets of data
Also called a trend Positive correlation or trend

5
Correlation Negative correlation or trend

6
Correlation No correlation or trend

7
Line of Best Fit A line you draw on a graph to approximate the relationship between data sets. Also called a trend line A line of best fit should have an equal number of data points on each side If there is no correlation, you cannot draw a line of best fit

8
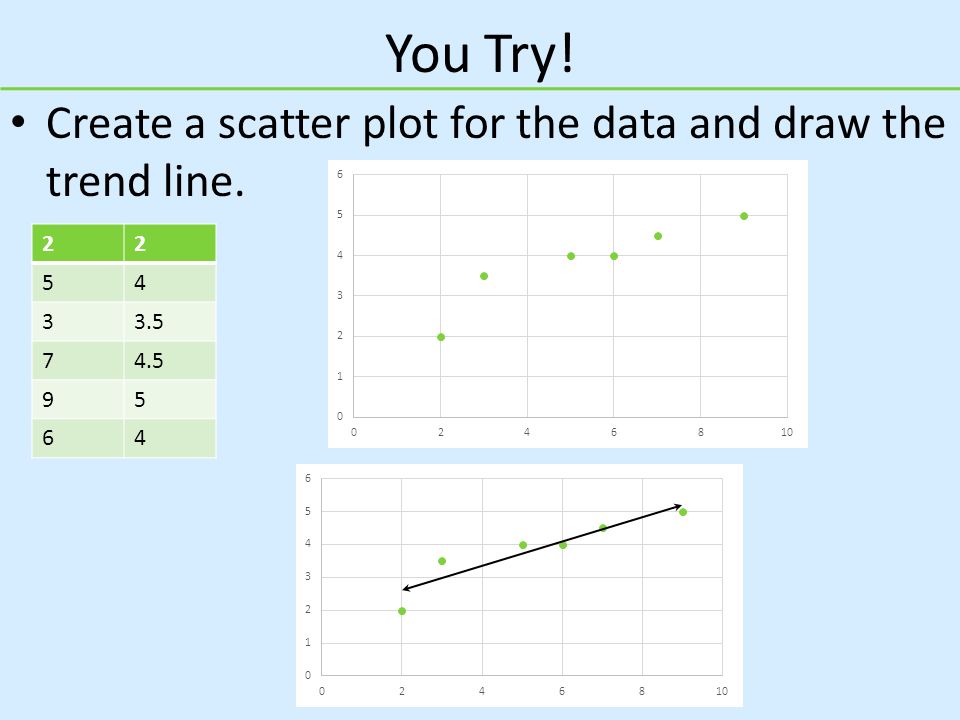
You Try! Create a scatter plot for the data and draw the trend line. 2
5 4 3 3.5 7 4.5 9 6
9
Making Predictions What is the approximate weight of a
7 month old panda? We have just used interpolation to estimate a value between two known values using a line of best fit. Extrapolation is used to predict a value outside the range of known values. Ex: Use your model to find the body weight of a 3-year old panda.

10
Causation A change in one quantity causes a change in the second quantity. Correlation does not always imply causation

11
Using a Calculator Correlation coefficient (r) can be found using a graphing calculator. Ranges between -1 and 1 The nearer r is to 1 or -1, the more closely the trend line fits the data r close to 1 shows a strong positive correlation r close to -1 shows a strong negative correlation r close to 0 means a weaker correlation or no correlation

12
Using a Calculator Press STAT and then 1 to select EDIT
Enter x-values into L1 and y-values into L2 (if x-values are years, do not enter the year, but enter 1 for one year from the start, 2 for 2 years from start, etc.) Press STAT then move Right to the CALC menu Move Down to LinReg(ax+b) and press Enter Press Enter again a will represent slope b will represent the y-intercept And r will show the correlation coefficient (NOT r2)
 Press STAT then move Right to the CALC menu. Move Down to LinReg(ax+b) and press Enter. Press Enter again. a will represent slope. b will represent the y-intercept. And r will show the correlation coefficient (NOT r2)")
13
Assignment ODDS P.96 #7-17

Similar presentations


 CCSS Then/Now New Vocabulary Example 1:Real-World Example: Write an Equation for a Best.>")

>")


