Download presentation
Presentation is loading. Please wait.

1
Treatment Time Reduction through Parameter Optimization in Magnetic Resonance Guided High Intensity Focused Ultrasound Therapy Joshua Coon December 7, 2011

2
PART ONE: OVERVIEW AND THEORY

3
High Intensity Focused Ultrasound (HIFU): Overview Ultrasound energy used to heat/ablate tissue – Magnifying glass and light Clinical use as cancer therapy – Several advantages over traditional therapies Area of active research – Extensive clinical trials in China and Europe
: Overview Ultrasound energy used to heat/ablate tissue – Magnifying glass and light Clinical use as cancer therapy – Several advantages over traditional therapies Area of active research – Extensive clinical trials in China and Europe")
4
Why Use HIFU? No poisonous chemicals – Chemotherapy No ionizing radiation – However, sometimes HIFU used with radiation Relatively non-invasive – Compared to surgery Shorter recovery time – Outpatient procedure; short repetition time

5
Clinical Uses of HIFU Uterine Fibroids – Approved by FDA in 2004 Prostate Cancer – Not approved by FDA – Available in other countries Breast Cancer – Not approved by FDA – Funded grant Brain Tumors and Function – New area of research for group – Brain tumors – Brain function Treatment of tremors, depression

6
HIFU Transducer

7
Safety, Efficacy and Treatment Time Ultrasound Transducer Safety Reduce healthy tissue heating Efficacy Ensure entire tumor treated Treatment Time Long treatments reduce safety and efficacy Patient movement Permanent tissue property changes Attenuation coefficient Cost

8
Treatment Parameters Controllable Transducer manufacturing – Central beam frequency – Number of elements – Size and radius of curvature Transducer state – Power level – Power on and off times Characteristics of focal zones – Focal zone size(s) – Focal zone shape(s) Duty cycle for diluted focal zones – Spacing(s) between focal zones – Focal zone packing Path of focal zones through tumor – Axial and transverse Non-Controllable Physiological parameters – Perfusion and conduction – Tissue composition – Tumor geometry – Tumor location Ultrasound Transducer
 – Focal zone shape(s) Duty cycle for diluted focal zones – Spacing(s) between focal zones – Focal zone packing Path of focal zones through tumor – Axial and transverse Non-Controllable Physiological parameters – Perfusion and conduction – Tissue composition – Tumor geometry – Tumor location Ultrasound Transducer")
9
Components of HIFU Treatment Simulations Ultrasound Attenuation Equation – Models how ultrasound energy is converted to heat Heat Flow Equation – Models flow of heat through the body Thermal Damage Equation – Models how much tissue is damaged due to heating

10
Ultrasound Attenuation

11
Heat Flow Heat equation with uniform “heat sink” (W term) caused by blood flow Model of perfusion from Pennes (1948).
 caused by blood flow Model of perfusion from Pennes (1948).")
12
Thermal Damage Dose increases exponentially with temperature Model from paper by Dewey & Sapareto (1984) Typical target is >240 CEM for tissue death and <30 CEM for tissue survival
 Typical target is >240 CEM for tissue death and <30 CEM for tissue survival")
13
Treatment Time Objective function for optimization routines Has additional constraints to ensure treatment efficacy and patient safety

14
Treatment Time Optimization

15
Placeholder – Explain Constraints, Optimization Method

16
Optimization Flow Chart Tumor and tissue geometry Ultrasound Heat flow Thermal damageTreatment time optimization Final output= Optimal Treatment Times Repeat for several sets of controllable/non-controllable parameters to develop “treatment strategy”

17
PART TWO: MY RESEARCH

18
First Paper: Treatment Time Reduction through Treatment Path Optimization Coon J, Payne A, Roemer R. HIFU treatment time reduction in superficial tumours through focal zone path selection. International Journal of Hyperthermia. 2011;27(5):465-81.
:")
19
Study Motivation Reduce MRgHIFU treatment times – Strategies for treatment path selection Develop a model of the physics behind treatment time reductions – Role of thermal superposition Tumor Normal tissue – Role of non-linear rate of thermal damage

20
11.2 cm 3.3 cm x y z Normal tissue constraints at +/- 1cm Simulation Geometry Tumor = 1.8cm x 1.8cm x 0.8cm 43 °C Normal tissue limit 37 °C Region boundary Pennes equation Homogeneous\constant tissue properties 240 CEM in tumor

21
256 element phased array (Imasonics, Inc.) 15 cm diameter transducer 13cm radius of curvature Element diameter 4mm Focal spot ~ 2mm x 12mm ( -3 dB) 1 MHz central frequency Random element locations to reduce grating lobe clutter Ultrasound Transducer
 15 cm diameter transducer 13cm radius of curvature Element diameter 4mm Focal spot ~ 2mm x 12mm ( -3 dB) 1 MHz central frequency Random element locations to reduce grating lobe clutter Ultrasound Transducer")
22
Ultrasound Modeling Ultrasound beam from transducer modeled via Hybrid Angular Spectrum (HAS) method Modeled with parameters taken from a 256 element phased array used in experiments Developed by Dr. Christensen of the Bioengineering department

23
Thermal and Tissue Damage Modeling

24
Treatment Path Tumor ablated using three treatment planes – Conservative spacings of 3mm for planes – Planes 15 or 36 positions each Paths divided into two major categories – Axially Stacked – Non-Axially Stacked Transverse paths were investigated with the best path from the first part of the study

25
Optimization Method Treatment times optimized on “Point-by- Point” basis along path Dose from cooling considered – Cooling part of curve Past dose considered – Dose deposited at current position from past heating pulses Future dose not considered – Dose at current position from future heating pulses

26
Reasons to Avoid Overheating Normal tissue cools only slowly with time

27
Simulation Region Back Middle Front Tumor 123456 789101112 131415161718 192021222324 252627282930 313233343536 373839404142 434445464748 495051525354 555657585960 616263646566 676869707172 737475767778 798081828384 858687888990 919293949596 979899100101102 103104105106107108 PL (BMF); XY RaAS (MBF); XY Ra 258111417 202326293235 384144475053 565962656871 747780838689 929598101104107 147101316 192225283134 374043464952 555861646770 737679828588 919497100103106 369121518 212427303336 394245485154 576063666972 757881848790 939699102105108
; XY RaAS (MBF); XY Ra")
28
Results

29
AS (MFB) XYRa AS (MBF) XYRa PL (MFB) XYRa AS (FBM) XYRa AS (FMB) XYRa 3D Max Last 3D Max First 3D Kn PL (FBM) XYKn AS (BFM) XYRa AS (BMF) XYRa PL (BFM) XYKn Pl (BMF) XYRa Pl (BMF) XZRa 0 200 400 600 800 1000 1200 1400 1600 1800 2000 2200 Focal Zone Path Treatment Time (s) 58% 0% 38% 30% 32% 50% 63% 47% Treatment Path Conclusion: Treatment path selection reduces treatment time
 XYRa AS (MBF) XYRa PL (MFB) XYRa AS (FBM) XYRa AS (FMB) XYRa 3D Max Last 3D Max First 3D Kn PL (FBM) XYKn AS (BFM) XYRa AS (BMF) XYRa PL (BFM) XYKn Pl (BMF) XYRa Pl (BMF) XZRa Focal Zone Path Treatment Time (s) 58% 0% 38% 30% 32% 50% 63% 47% Treatment Path Conclusion: Treatment path selection reduces treatment time")
30
Additional Path Studies Also ran for subset of paths and several perfusion and transducer power levels The ordering of the paths remained unchanged

31
0.310.400.490.580.670.760.850.941.03 0 200 400 600 800 1000 1200 1400 1600 1800 2000 Power Density*10 7 (W/m 3 ) Treatment Time (s) 2% 13% 17% 24% 35% 42% 51% 56% 61% 63% 0% 47% 67% AS (MBF), XY (Ra) 3D Kn PL(BMF), XY Ra Power Density Conclusion: Path ordering constant across range of transducer powers
 Treatment Time (s) 2% 13% 17% 24% 35% 42% 51% 56% 61% 63% 0% 47% 67% AS (MBF), XY (Ra) 3D Kn PL(BMF), XY Ra Power Density Conclusion: Path ordering constant across range of transducer powers")
32
12345678910 0 100 200 300 400 500 600 700 800 900 1000 1100 Perfusion kg/(m 3 s) Treatment Time (s) 54% 47% 30% 21% 13% 8% 2% 0% AS (MBF), XY (Ra) 3D Kn PL(BMF), XY Ra Perfusion Conclusion: Path ordering constant across range of perfusions
 Treatment Time (s) 54% 47% 30% 21% 13% 8% 2% 0% AS (MBF), XY (Ra) 3D Kn PL(BMF), XY Ra Perfusion Conclusion: Path ordering constant across range of perfusions")
33
Placeholder – Transition Slide

34
Comparison of Stacked & Unstacked Paths Conclusions: Axial stacking responsible for decrease in heating times Mechanism is through thermal superposition through axial stacking X’s= PL(BMF), XY Ra Squares = AS (MBF), XY (Ra)
, XY Ra Squares = AS (MBF), XY (Ra)")
35
Middle Back Front Adjacent Single Pulse Heating: Middle Plane

36
171819202122 36567823 351612924 3415431025 331413121126 323130292827 1223482916 33133015237 212961728 12311424355 25203102718 32112619436 123101112 894171813 765161514 192021282930 262722353631 252423343332 123456 14151617187 1312111098 192021222324 323334353625 313029282726 Transverse Paths Extensions: Take best axial stack and study transverse paths Inner-Middle-Outer (IMO)Knight Jumps (Kn) Small Squares (Sq)Large Rectangles (Rec)
Knight Jumps (Kn) Small Squares (Sq)Large Rectangles (Rec)")
37
Treatment Time (s) Transverse Path * * * * * 10% 11% 29% 39% 43% 57% 72% 79% 6 Degree Constraint 5 Degree Constraint 2500 3000 3500 1500 2000 1000 500 0 KnIOMIMORaMOIOMIOIMRecMIOSq Transverse Path Study Conclusions: Adjacency of axial stacks desirable for higher normal tissue temperature limit Adjacency of axial stacks undesirable for lower normal tissue temperature limit
 Transverse Path * * * * * 10% 11% 29% 39% 43% 57% 72% 79% 6 Degree Constraint 5 Degree Constraint KnIOMIMORaMOIOMIOIMRecMIOSq Transverse Path Study Conclusions: Adjacency of axial stacks desirable for higher normal tissue temperature limit Adjacency of axial stacks undesirable for lower normal tissue temperature limit")
38
Additional Studies Over 125 paths studied in total, including over 100 random paths (not shown) Two additional tumor models studied: – Large superficial tumor – Medium deep tumor Results consistent across several paths and tumor models
 Two additional tumor models studied: – Large superficial tumor – Medium deep tumor Results consistent across several paths and tumor models")
39
IMOIOMRaOMI Kn 0 200 400 600 800 1000 AS (MFB) Transverse Path Treatment Time (sec) Medium Deeper Tumor 15% 21% 16% 25% 35%
 Transverse Path Treatment Time (sec) Medium Deeper Tumor 15% 21% 16% 25% 35%")
40
RaIMOOMIIOMKn 0 200 400 600 800 1000 1200 1400 AS (MFB) Transverse Path Treatment Time (sec) Larger Tumor 0% 38% 39% 35%
 Transverse Path Treatment Time (sec) Larger Tumor 0% 38% 39% 35%")
41
Conclusions Treatment path selection can greatly reduce treatment times Axial stacking provides largest treatment time reduction Middle-Front-Back stack ordering always fastest – Effective use of thermal superposition Transverse stack “adjacency” selection depends on normal tissue constraints – High adjacency for higher temperature limit – Low adjacency for lower temperature limit Effects hold for range of perfusions, transducer power levels, and tumor sizes and depths

42
Second Paper: In Preparation HIFU Treatment Time Reduction through Optimal Scanning, Coon J, Todd N, Roemer R.

43
Goals of Second Paper Compare “Concentrated” versus “Diluted” focal zone treatment strategies Study optimal focal zone spacing and packing Verify concentrated vs. diluted results in phantom model

44
Previous ResearchCurrent Research Treatment Time Reduction Strategies: Axially stack focal zones Treat adjacent axial stacks Maximum focal zone power Path selection important Optimization Method: Each focal zone treated to 240 CEM before next position treated Future dose not considered Expanded by studying: Optimal axial focal zone spacing Optimal transverse axial stack spacing “Discrete” vs. “Volumetric” ablation Path selection with future dose minimized Optimization Method: Focal zones treated to 240 CEM by end of treatment Future Dose minimized in tumor Comparison of First/Second Paper Methods

45
Axial Spacing Optimization x x Focal Zone Spacing Tumor Treatment Parameters: 7x7x7cm 3 tissue region 1x1x16mm 3 and 1x1x30mm 3 Tumors 1x1x12mm 3 Focal Zone Homogeneous Acoustic/Thermal Properties 0.5 and 5.0 kg/(m 3 s) perfusion Treated with 2,3,4 and 5 focal zones Concentrated and diluted focal zones strategies
 perfusion Treated with 2,3,4 and 5 focal zones Concentrated and diluted focal zones strategies")
46
9.5 cm 7.0 cm x y z Temperature/dos e constraints at +/- 1cm from tumor edge Skin/Water Interface Focal Zone Spacing x x Tumor Simulation Schematic Axial Tumor Close-up 1.0mm 16, 30mm Simulation Region

47
Concentrated vs. Diluted Focal Zones x x x x x x Next Position 100% 0% 100% 50% Concentrated Diluted

48
Small Axial Tumor Conclusions: Optimal spacing around 8 or 10mm Concentrated focal zones faster than diluted focal zones

49
024681012141618 10 2 3 4 5 6 7 8 9 Distance from Front of Tumor (mm) Thermal Dose (CEM) 10mm Separation 14mm Separation 2mm Separation Small Axial Tumor: Concentrated Focal Zones Dose Maps Conclusions: Optimal axial spacing has less overdose than other spacings Optimal axial spacing also has better coverage of “cold spots”
 Thermal Dose (CEM) 10mm Separation 14mm Separation 2mm Separation Small Axial Tumor: Concentrated Focal Zones Dose Maps Conclusions: Optimal axial spacing has less overdose than other spacings Optimal axial spacing also has better coverage of cold spots")
50
x x x x x x x x Multi-Position Axial Treatments 3 Position 2 Position 4 Position 17 Position

51
Small Axial Tumor: 3 Position Concentrated Focal Zones

52
Small Axial Tumor: 3 Position Diluted Focal Zones Conclusion: 3 position diluted focal zones treatment longer than concentrated focal zones treatments, even with duty cycle optimized

53
Focal Zone Packing: Small and Large Axial Tumors Conclusions: Diminishing returns with increased focal zone packing 0123456789101112131415161718 60 80 100 120 140 160 180 200 220 Number of Focal Zone Locations Heating Time (sec)
")
54
Concentrated vs. Diluted Focal Zones: Small Axial Tumor Conclusion: Concentrated focal zones treatments faster than diluted for treatments using wide range of focal zone packings Diminishing returns with increased packing in concentrated treatments

55
Transverse Spacing Optimization x x x x Volume Treated Both stacks & volume between treated Vary stack transverse distance Compare ablation rates (mm 3 /sec) because treatment volumes unequal Treatment Approach: 1, 2, 3, 4, 5, 6mm 16mm
 because treatment volumes unequal Treatment Approach: 1, 2, 3, 4, 5, 6mm 16mm")
56
2 Adjacent Axial Stacks: Control Volume Ablation Rates 123456 0.1 0.15 0.2 0.25 0.3 0.35 Distance Between Axial Stack Centers (mm) Control Volume Ablation Rate (mm 3 /sec) 54/20/15/10% 31/30/13/25% 33/30/9/26% 31/32/7/30% 43/41/0/16% 54/21/11/14% 25/25/25/25% Conclusions: Concentrated treatments faster than diluted across range of transverse spacings Optimal transverse spacing at 3mm
 Control Volume Ablation Rate (mm 3 /sec) 54/20/15/10% 31/30/13/25% 33/30/9/26% 31/32/7/30% 43/41/0/16% 54/21/11/14% 25/25/25/25% Conclusions: Concentrated treatments faster than diluted across range of transverse spacings Optimal transverse spacing at 3mm")
57
x x x x Control Volume 1, 2, 3, 4, 5, 6mm 16mm Total Volume Ablated 240 CEM Dose Line Ablation Volume: Control vs. Total

58
2 Adjacent Axial Stacks: Total Volume Ablation Rates 54/20/15/10% 31/30/13/25% 33/30/9/26% 31/32/7/30% 43/41/0/16% 54/21/11/14% 25/25/25/25%

59
1mm Stack Separation2mm Stack Separation 3mm Stack Separation 4mm Stack Separation5mm Stack Separation 6mm Stack Separation

60
1mm Stack Separation2mm Stack Separation 3mm Stack Separation 4mm Stack Separation5mm Stack Separation 6mm Stack Separation

61
F1 B1 F2 B2 F1 B1 B2 F2 F1 F2 B1 B2 F1 F2 B2 B1 F1 B2 B1 F1 B2 F2 B1 F1 F2 B2 B1 F1 B2 F2 B1 F2 F1 B2 B1 F2 B2 F1 B1 B2 F1 F2 B1 B2 F2 F1 50 100 150 200 250 300 350 400 450 Treatment Time Path 5mm Stack Spacing 3mm Stack Spacing 1mm Stack Spacing 2 Adjacent Axial Stacks: Path Study

62
Ultrasound Attenuation Change Model Example on right for middle-back-front path Step increase in attenuation at previous position to 2x or 4x after heating Change at a position instantaneous after heating Attenuation increase even if position has not reached 240CEM x x x x x x

63
Attenuation Changes: Path Selection

64
Concentrated vs. Diluted Scanning: Agar Phantom Concentric Circles 25 points Circles with 1,8 and 16 points Radii of 0mm, 2.25mm and 4.5mm Cartesian Grid 25 points 5x5 grid 2mm between points Concentrated scans had 15 seconds of heating per point with one repeat Diluted scans had 0.1 seconds of heating per point with 150 repeats Concentrated vs. Diluted MR temperature data used to calculate thermal dose

65
Concentrated Cartesian Diluted CartesianConcentrated CirclesDiluted Circles 100 200 300 400 500 600 Phantom Treatment Type Number of Voxels Treated to 240 YZ Plane XZ Plane XY Plane Phantom Experiment: Dose Comparison Conclusions: Concentrated treatments have higher ablation rates than diluted treatments

66
Simulation to Phantom Matching 1.Simulate treatments with variable transducer power and conduction 2. Match dose 240/30 CEM dose contour lines between simulation/phantom 3. Use matched power/conduction to treat volume with different dwell times at each position Method:

67
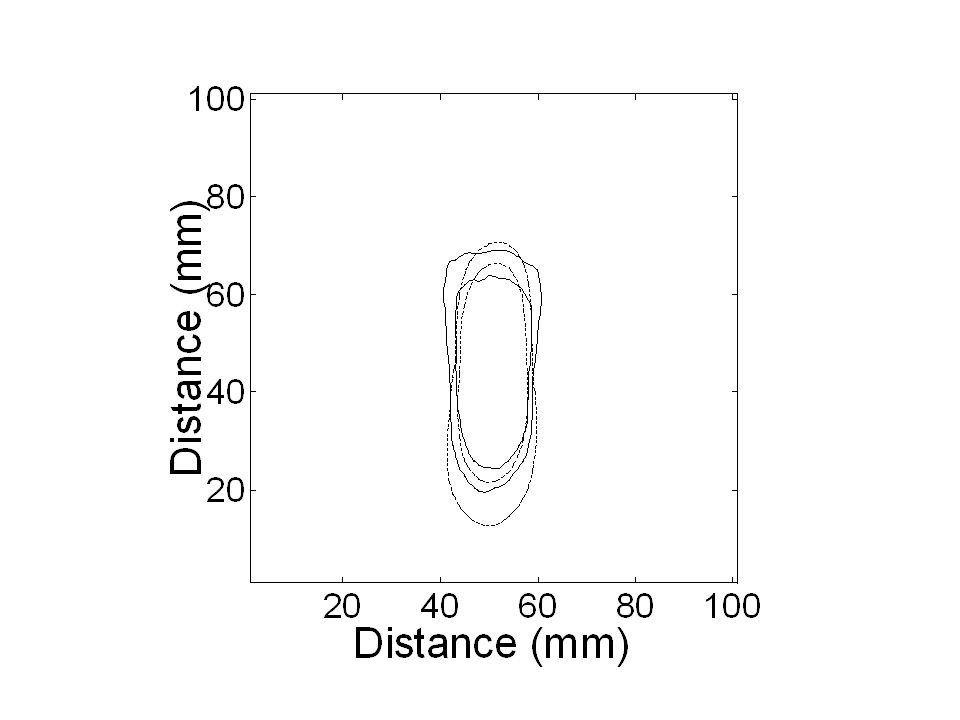
Simulation/Phantom Matching Conclusions: Reasonable match between simulation/phantom dose possible The best match for the 30 CEM line corresponds to “literature value” for agar phantom conduction

71
Dwell Time Study Method Use data from simulation/phantom matching study to set transducer power/conduction coefficient Reproduce phantom treatments modified to treat a small control volume Compare treatments with different dwell times per position

72
Dwell Time Results Diluted FZ0.1 Sec 1.0 Sec Non-Optimed Concentrated FZ Optimized Concentrated FZ 200 210 220 230 240 250 260 270 280 290 Heating Time Conclusion: Making treatments increasingly concentrated shortens treatment times Dwell Time

73
Conclusions Concentrated focal zones treatments faster than diluted focal zones – Verified in agar phantom – Verified in simulations matched to phantom Optimal axial spacing has small amount of overlap between focal zones Optimal transverse spacing with small gap between axial stacks Diminishing returns with increased packing

74
Future Work Verify axial path, concentrated vs. diluted, and optimal spacing results in phantom/animal models Expand simulations to patient specific geometries and changing ultrasound attenuation and blood perfusion values – Preliminary work done with axial path and “worst- case” attenuation change model

75
One FZ Pulse Optimization

76
Hybrid Angular Spectrum (HAS)
")
Similar presentations


. What is cancer? Failure of the mechanisms that control growth and proliferation of the cells Uncontrolled (often rapid) growth.>")


