Download presentation
Presentation is loading. Please wait.

1
High Frequency Ultrasonic Characterization of Carrot Tissue Christopher Vick Advisor: Dr. Navalgund Rao Center for Imaging Science Rochester Institute of Technology

2
Overview Introduction Hypothesis Theory Experimental Results Conclusion

3
Introduction Ultrasound: fast, nondestructive, noninvasive, and inexpensive. Long history of diagnostic use. Many medical applications consist of interpreting an image, based on gray- level and texture.

4
Introduction System and processing limitations make this ineffective in identifying small variations in specific tissue structure. Computer texture analysis models are limited in scope. Models can be aided by quantitatively examining the ultrasonic response of tissue.

5
Alternate Ultrasound Uses Ripeness measurement in banana and avocado; animal backfat estimation; examination of the structure of metals and wood. Ultrasound has been proposed for texture evaluation of plant tissues, but not widely tested.

6
Why carrots? Biological changes well documented. Homogenous structure Since the changing carrot biology is well understood, can examine how ultrasound propagates through various tissues.

7
Previous Research Results: Previous research used low frequency ultrasound. Notice the nature of their two variables. This makes identifying a carrot’s exact texture difficult. Velocity, Attenuation Vs. Cooking Time

8
Hypothesis High frequency ultrasound can be used to characterize the cell texture of cooked carrots. It is hypothesized that varied carrot tissues have uniquely identifiable frequency responses.

9
Ultrasound theory An ultrasound transducer can convert electrical energy to mechanical waves. Velocity and attenuation of this signal in a medium are characteristic of the medium’s physical properties. The amount of scattering, absorption, and reflection, are a function of the medium as well.

11
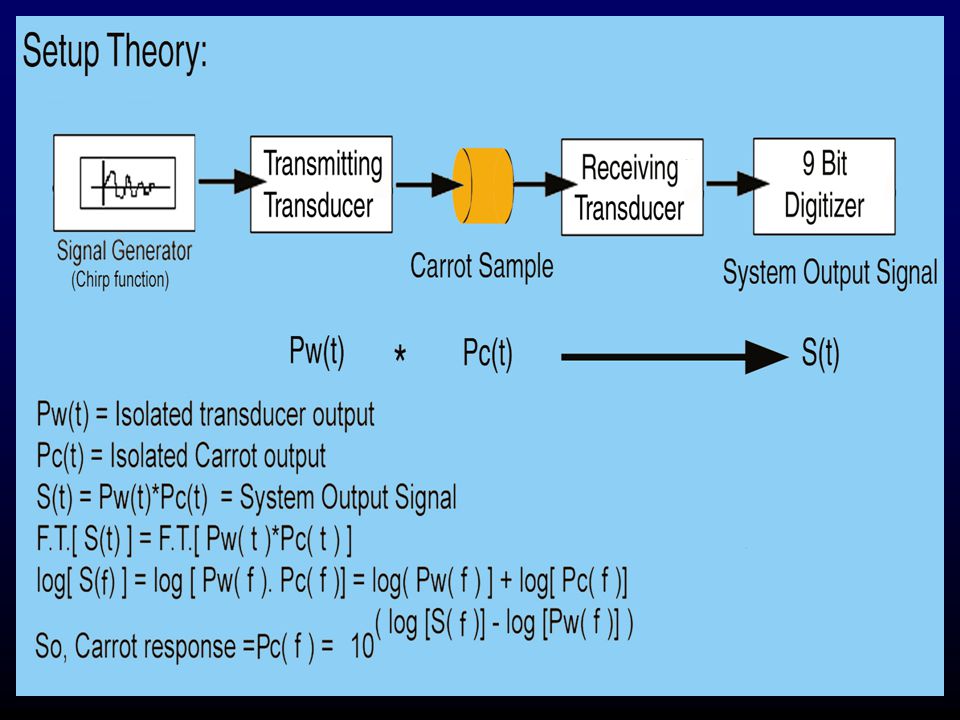
Experimental Setup

12
Experimental Input Signal Selection: Input Signal FFT: 0 5 10 Frequency (MHz)
")
13
Transducer Response Measure transducer response by filling the jar setup with water. - Less than 5% variation across response curve.

14
Carrot Sample Preparation Samples were cored from normal Dole carrots, using an apple corer. Samples to be cooked were placed in boiling water for the appropriate 0-16 minute cooking times, removed, and cooled in distilled water.

15
Tests: Same Sample Examine signal variation from imaging the same carrot sample, repeatedly. - Align carrot/transducers - Image the sample - Remove the sample - Repeat process

16
Testing: Different Samples Examine signal variation along the length of the carrot, as the xylem core diameter changes. Examine signal variation among different carrots of equal cooking time.

17
Testing: Cooked Carrots Random carrot segments, boiled for between 1-16 minutes, in 30 second intervals. Lastly, random carrot samples were cooked for an unknown length of time. If successful, results from the previous tests should allow for identification of the unknown samples.

18
Results: Same Sample Readings - Magnitude variation as high as 20%. - Sources: Alignment, transducer coupling

19
Results: Normalized - Variance drops to below 7%.

20
Results: Different Segments - Notice that Magnitude decreases as the xylem core diameter increases.

21
Results: Normalized - After Normalization, variation drops significantly, to less than 10%

22
Results:Different Carrots - Magnitude Variation can exceed 80% - From alignment, coupling, natural sample differences

23
Results: Normalized - Variation is significantly decreased. - Is error too high to allow accurate classification?

24
Results: Various Cooked Carrots - Frequency response changes can be explained by the structural changes invoked through cooking.

25
Results: Normalized Response LUT

26
Side View of Normalized Response LUT 0 5 10 Frequency (MHz)
")
27
Analysis: Unknown Sample IDL Program is given the system output signal of a carrot of unknown cooking time. Program calculates the FFT, normalizes it, and attempts to identify the lowest error associated with a match from the known LUT.

28
Results: Unknown Carrot Example 1) Given unknown output signal 2) Program calculates signal FFT
 Given unknown output signal 2) Program calculates signal FFT")
29
Results: Unknown Analysis 3) Program normalizes FFT, compares to known FFTs. 4) Program identifies the best match. 5) Program Predicted time: 13 minutes 6) Actual Cooking time: 13 Minutes Result: Match Only 10 unknown trial conducted. 4/10 successful.
 Program identifies the best match. 5) Program Predicted time: 13 minutes 6) Actual Cooking time: 13 Minutes Result: Match Only 10 unknown trial conducted. 4/10 successful..")
30
Conclusions Focused on the frequency response of carrots. Magnitude variation is important factor. By normalizing, variation among same sample, or different segments is lowered substantially. Large signal variation among different carrots.

31
Conclusion: IDL analysis needs further attention; not all carrots can be identified. Combining analysis with the previously studies variables of Velocity and Attenuation would likely provide a more robust tissue identification model.

32
Special Thanks to: Dr. Navalgund Rao Maria Helguera Brad Miller

Similar presentations