Download presentation
Presentation is loading. Please wait.

1
Manuherikia Catchment Hydrology and Irrigation 4 September 2014 Ian Lloyd

2
Presentation Topics Irrigable area Falls Dam Update – Stage Storage Curve, Dam design High Race Alignment Upper Manuherikia Valley Irrigable area and distribution options Lower Valley Irrigable area and distribution options Hydrological model scenarios

3
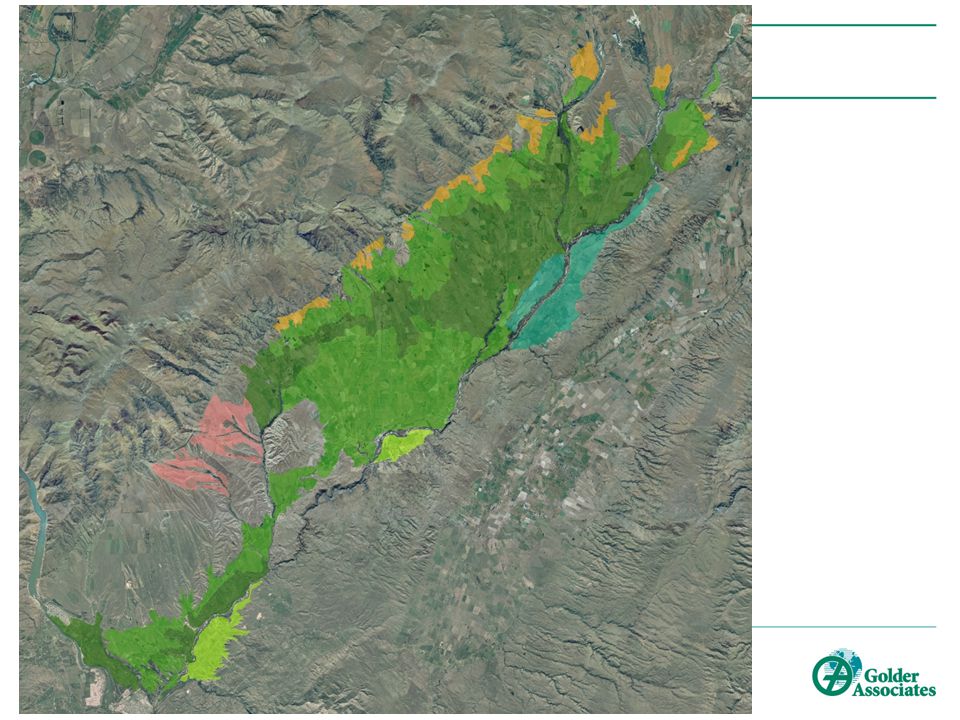
Irrigable Area Irrigable area refined from Aqualinc Stage 1 using aerial photos. Riparian and urban areas removed. The area above the MIS main race (i.e. Dairy Flat Scheme), and the comand areas of the Hawkdun-Idaburn Irrigation Scheme and Ida Valley Irrigation Scheme not considered. Total irrigable land ≈ 36,150 ha. ≈ 29,500 ha above Ophir ≈ 5,000 ha below Ophir (Galloway and MIS) ≈ 1,650 Matakanui Extension.
, and the comand areas of the Hawkdun-Idaburn Irrigation Scheme and Ida Valley Irrigation Scheme not considered. Total irrigable land ≈ 36,150 ha. ≈ 29,500 ha above Ophir ≈ 5,000 ha below Ophir (Galloway and MIS) ≈ 1,650 Matakanui Extension..")
5
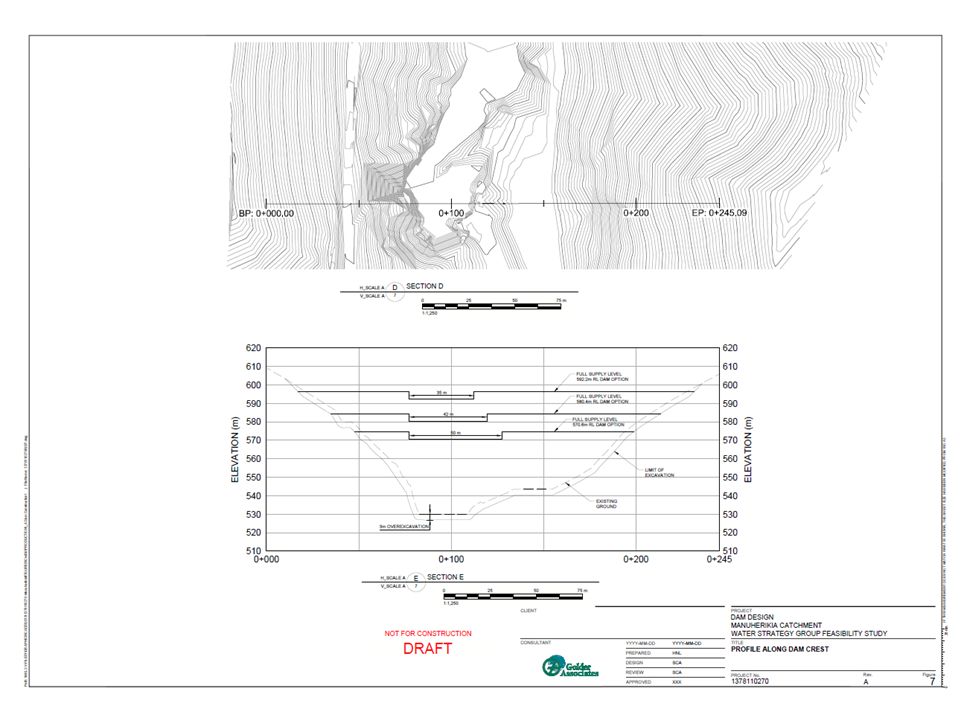
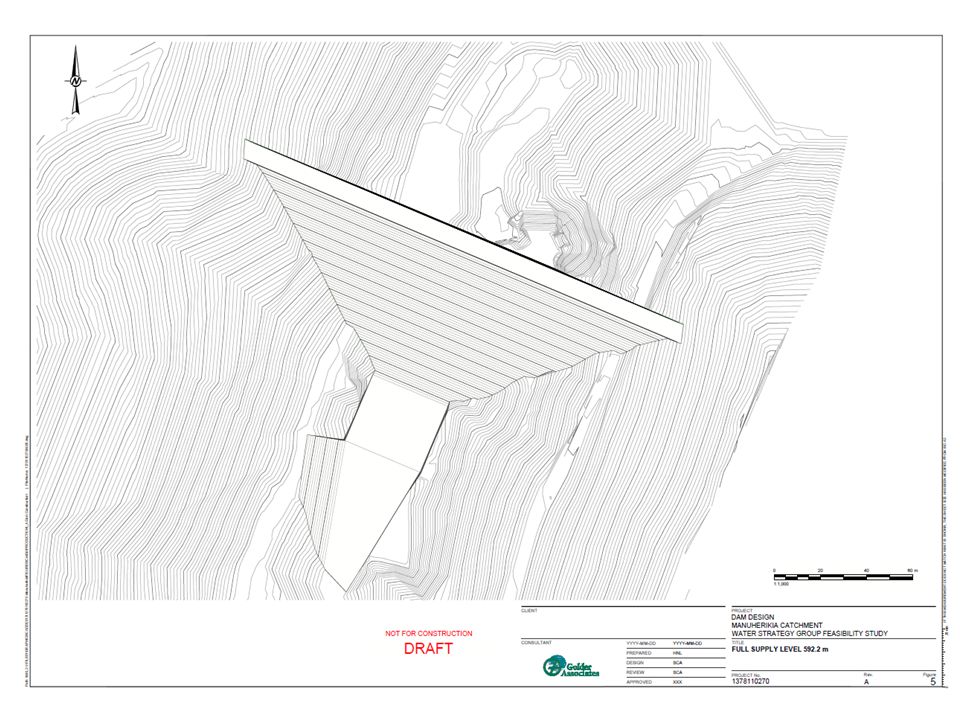
Falls Dam Update

6
Full supply level of Dam (m) Raise (m) Total Storage (M m3) Usable storage (M m3) % dead storage Comment 565.2 m (561.4) 0 current dam 10.410.03.6% Current dam. Aqualinc 2013 indicates the current dam (10 M m3 of usable storage) with run of river takes can irrigate 6,500 ha above Ophir but there are irrigation restrictions. 570.6 m (566.8) Low 5.4 m20.619.07.9% Low raise to give 19M m3 of usable storage which Aqualinc 2013 indicates is sufficient with run of river takes to fully irrigate 7,500 ha above Ophir 580.4 m (576.6) Mid 15.2 m51.650.03.2% Mid raise to give 50M m3 of usable storage which Aqualinc 2013 indicates is sufficient with run of river takes to fully irrigate 12,000 ha above Ophir 589.7 m (585.9) 24.5 m101.6100.01.6% High raise to give 100M m3 of usable storage which Aqualinc 2013 indicates is sufficient with run of river takes to fully irrigate 21,000 ha above Ophir. Requires a minimal structure at Shamrock Gully. 592.2 m (588.4) High 27.0 m119.0114.14.1% 27 m raise and keeping dead storage to roughly the same % as current. Will give 114M m3 of usable storage which will allow more area to be irrigated. Will require a more significant structure at Shamrock Gully.
 with run of river takes can irrigate 6,500 ha above Ophir but there are irrigation restrictions m (566.8) Low 5.4 m % Low raise to give 19M m3 of usable storage which Aqualinc 2013 indicates is sufficient with run of river takes to fully irrigate 7,500 ha above Ophir m (576.6) Mid 15.2 m % Mid raise to give 50M m3 of usable storage which Aqualinc 2013 indicates is sufficient with run of river takes to fully irrigate 12,000 ha above Ophir m (585.9) 24.5 m % High raise to give 100M m3 of usable storage which Aqualinc 2013 indicates is sufficient with run of river takes to fully irrigate 21,000 ha above Ophir. Requires a minimal structure at Shamrock Gully m (588.4) High 27.0 m % 27 m raise and keeping dead storage to roughly the same % as current. Will give 114M m3 of usable storage which will allow more area to be irrigated. Will require a more significant structure at Shamrock Gully..")
7
Falls Dam Update Ability to refill. Simplistic reservoir model developed of Falls Dam using the Raineffects dam inflow series. Assessed if a live storage of 100 M m 3 could be refilled under various minimum flow regimes and assuming that the reservoir was empty on the 1 st of May each year. The reservoir has a high ability to refill, but is sensitive to the minimum flow regime (particularly winter minimum flows). Significant refilling occurs over the irrigation season. Based on the Raineffects dam inflow time-series, 100 M m 3 can be reliably harvested annually (1 May to following 30 April) at the Falls Dam site.
. Significant refilling occurs over the irrigation season. Based on the Raineffects dam inflow time-series, 100 M m 3 can be reliably harvested annually (1 May to following 30 April) at the Falls Dam site..")
8
Falls Dam Update Scenario 1: Minimum Flow of 500 L/s below dam all year round, dam emptied 1 May each year.

9
Falls Dam Update Scenario 2: Minimum Flow of 1,370 L/s below dam all year round, dam emptied 1 May each year.

10
Falls Dam Update

14
14

15
15

16
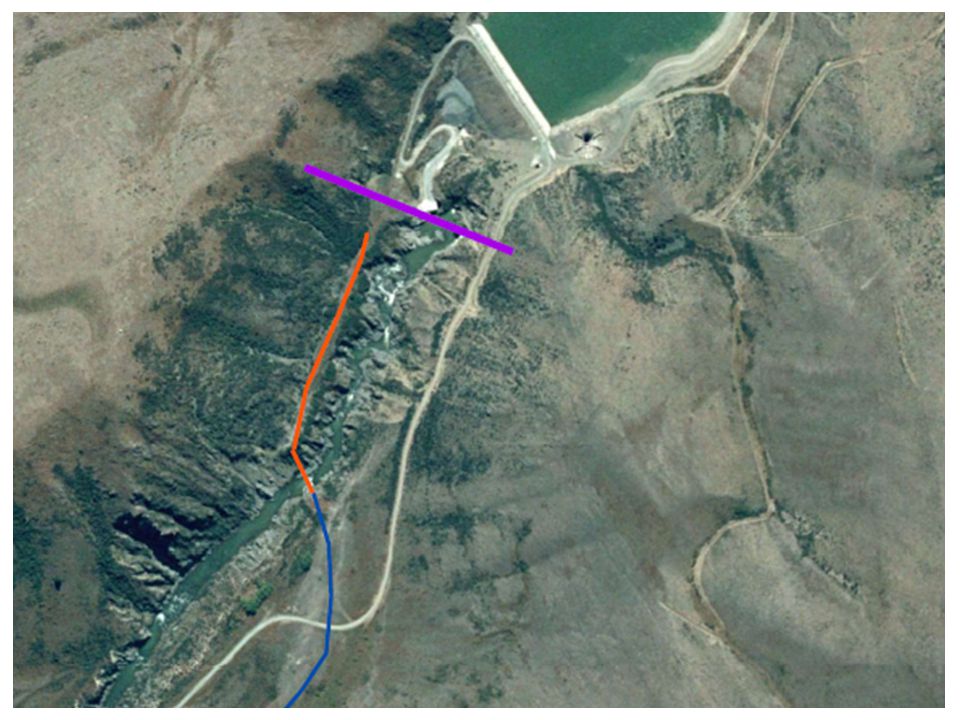
High Race Alignment Key consideration when developing Golder alignment: Keeping the race as high as possible to maximise piped gravity distribution options. Utilise existing infrastructure, particularly river intakes and existing large races. Identify areas that warrant special attention, i.e. river crossing and steep terrain. Tinkers Diggings (Matakanui area) and Drybred Diggings are difficult.
 and Drybred Diggings are difficult..")
17
High Race Alignment Feed directly from Dam. Higher than both Aqualinc and MOW alignments. Similar average slope (1.5m/km) to Aqualinc’s proposed alignment. Longer: ≈ 72.1km; Aqualinc ≈ 59.9km; MWD ≈ 56.8 km. 56.2 km new race, 9.3km upgraded race, 6.6 km siphons. Tinkers Diggings (Matakanui area) and Drybred Diggings areas are difficult and require field verification.
 to Aqualinc’s proposed alignment. Longer: ≈ 72.1km; Aqualinc ≈ 59.9km; MWD ≈ 56.8 km km new race, 9.3km upgraded race, 6.6 km siphons. Tinkers Diggings (Matakanui area) and Drybred Diggings areas are difficult and require field verification..")
18
High Race Alignment

20
Advantages: 1.Higher: approx. 12,000 ha > 40 m below the race and potentially supplied with pressurised water – piped supply. 2.Significantly less irrigable area above the race. 3.Elevation of the end of the race coincides with the MWD alignment, facilitates Matakanui Extension. 4.Uses Matakanui Race allowing the existing Thompson Gorge intake to be used. Existing small storages off the Matakanui Race in the Tinkers Diggings (Matakanui) which would be incorporated to provide scheme buffer storage. 5.Minimised Siphon length at Thomsons Gorge and Lauder Creek. 6.Coincides with a higher race from Lauder Creek, can feed OIS Lauder Race.
 which would be incorporated to provide scheme buffer storage. 5.Minimised Siphon length at Thomsons Gorge and Lauder Creek. 6.Coincides with a higher race from Lauder Creek, can feed OIS Lauder Race..")
21
High Race Alignment Advantages: 7.Traverses through the Drybred diggings reducing the length of race between Lauder and Thomsons creeks 8.Crosses Dunstan Creek upstream of OIS and Dunstan/Downs intake can feed into the existing OIS Dunstan and Dunstan/Downs race. 9.Traverses through the Beattie Road saddle which is consistent with the alignment preferred by the Downs farmers. 10.Provides gravity water supply to much of the Greenfields area. 11.Allows water to be potentially supplied up Hawkdun Run Road and to the Johnsons property thereby providing the landowners most affected by the raising of Falls Dam with some irrigation water. 12.Does not require the construction of a large intake above Loop Road.

22
High Race Alignment Disadvantages: 1.Is longer: Golder ≈ 72.1km; Aqualinc ≈ 59.9km; MWD ≈ 56.8 km. 2.Longer siphon lengths under Dunstan Creek and Manuherikia River. 3.Additional siphon required on Greenfields property. 4.Slightly reduced generation potential as Hydro station discharges into race not river. 5.Requires bridge/viaduct over Manuherikia river immediately below dam. Note bridge required for construction of Dam. 6.Is above the OIS intakes on both Lauder (only slightly above) and Dunstan creeks so difficult to feed particularly Dunstan Creek water into the high race.
 and Dunstan creeks so difficult to feed particularly Dunstan Creek water into the high race..")
23
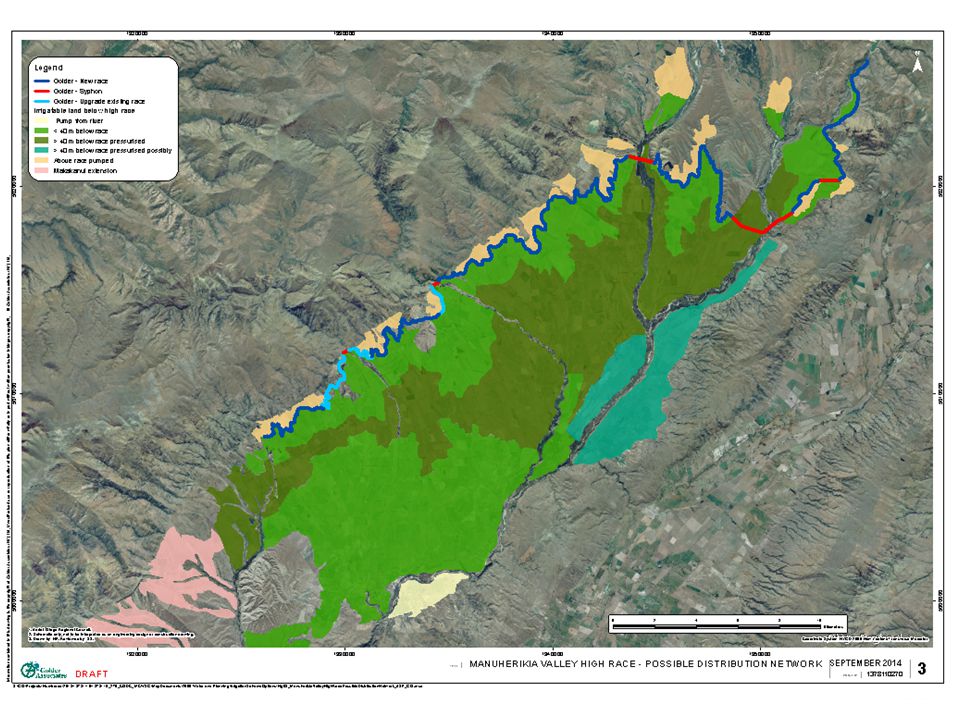
Upper Manuherikia Irrigable land above Ophir ≈ 29,500 ha (excl. Matakanui Extension) ≈ 2,000 above races and requires pumping ≈ 12,850 ha > 40 m below races potentially pressurized (incl. Blackstone) ≈ 14,650 ha 8,000 ha)) Hydrolgical model indicates: Low raise 19M m 3 life storage + takes from tributaries allows full irrigation of 7,500 ha above Ophir plus MIS and Galloway. Mid raise 50M m 3 life storage + takes from tributaries allows full irrigation of 12,000 ha above Ophir plus MIS and Galloway. High raise 100M m 3 life storage + takes from tributaries allows full irrigation of 21,000 ha above Ophir plus MIS and Galloway.
 ≈ 2,000 above races and requires pumping ≈ 12,850 ha > 40 m below races potentially pressurized (incl. Blackstone) ≈ 14,650 ha 8,000 ha)) Hydrolgical model indicates: Low raise 19M m 3 life storage + takes from tributaries allows full irrigation of 7,500 ha above Ophir plus MIS and Galloway. Mid raise 50M m 3 life storage + takes from tributaries allows full irrigation of 12,000 ha above Ophir plus MIS and Galloway. High raise 100M m 3 life storage + takes from tributaries allows full irrigation of 21,000 ha above Ophir plus MIS and Galloway..")
24
Upper Manuherikia Blacks Flat ≈400 ha pump from river OIS Main Race ≈8,600 ha 40 m below current Blackstone race potentially pressurised. Blackstone ≈1,650 ha below 480m contour potentially pressurised. Greenfields ≈1,150 ha below race (250 ha >40m), 300 ha above race Downs ≈2,650 ha below race (1,950 ha >40m), 200 ha above race. Dunstan Lauder ≈5,500 ha below race (3,700 ha >40m), 1,000 ha above race Lauder Thomsons ≈4,650 ha below race (3,000 ha >40m), 200 ha above race. Thomsons south ≈ 2,750 ha below race (1,700 ha >40m), 200 ha above race.
, 300 ha above race Downs ≈2,650 ha below race (1,950 ha >40m), 200 ha above race. Dunstan Lauder ≈5,500 ha below race (3,700 ha >40m), 1,000 ha above race Lauder Thomsons ≈4,650 ha below race (3,000 ha >40m), 200 ha above race. Thomsons south ≈ 2,750 ha below race (1,700 ha >40m), 200 ha above race..")
25
Upper Manuherikia An indicative piped Secondary Distribution Network has been developed. The network focuses on supplying piped water to those areas >40 m below the proposed high race. Piped networks simplify operations, reduce losses and the need for buffer storage, encourage development of spray based irrigation systems on-farm. The piped network follows existing road corridors where possible.

26
High Race Alignment

27
Lower Manuherikia Irrigable land below Ophir ≈ 5,000 ha (excl. Matakanui Extension) ≈ 4,050 ha associated with MIS (1,500 ha > 40 m below Main Race including 700 ha on Dunstan Flats) ≈ 950 ha associated with Galloway (pumped from river and below top race) Currently ≈ 2,700 ha is irrigated in the Lower Manuherikia. Both MIS and Galloway have large allocations. Hydrological model - sufficient flow in Lower Manuherikia to irrigate up to 4,200 ha (optimistic irrigation expansion). Irrigation water – lower tributary inflows, un-harvested upper tributary flows and return water from upstream irrigation.
 ≈ 4,050 ha associated with MIS (1,500 ha > 40 m below Main Race including 700 ha on Dunstan Flats) ≈ 950 ha associated with Galloway (pumped from river and below top race) Currently ≈ 2,700 ha is irrigated in the Lower Manuherikia. Both MIS and Galloway have large allocations. Hydrological model - sufficient flow in Lower Manuherikia to irrigate up to 4,200 ha (optimistic irrigation expansion). Irrigation water – lower tributary inflows, un-harvested upper tributary flows and return water from upstream irrigation..")
28
Lower Manuherikia MIS command area ≈ 5,200 ha, ≈ 4,050 ha irrigable and ≈2,200ha currently irrigated, future ≈ 3,200ha spray irrigated. Dunstan Flats ≈ 700 ha irrigable and ≈ 300ha currently irrigated, future 500 ha spray irrigated via pressurised piped supply. Alexandra Orchards and lifestyle blocks etc ≈ 400 ha irrigated many with buffer storage ponds, significant expansion not expected. McArthur Ridge ≈ 200 ha irrigated for viticulture (pumped from main race) significant expansion not expected. Larger properties north of Springvale, ≈ 1,300 ha currently irrigated, ≈ 800 ha > 40 m below main race. Future 2,100 ha spray irrigated. An indicative piped Secondary Distribution Network developed to supply piped water to Dunstan Flats and the 800 ha >40 m below the MIS Main Race.
 significant expansion not expected. Larger properties north of Springvale, ≈ 1,300 ha currently irrigated, ≈ 800 ha > 40 m below main race. Future 2,100 ha spray irrigated. An indicative piped Secondary Distribution Network developed to supply piped water to Dunstan Flats and the 800 ha >40 m below the MIS Main Race..")
29
Lower Manuherikia Galloway command area ≈ 800 ha. ≈ 950 ha irrigable below current upper race plus additional irrigable area above upper race. ≈ 520 ha currently irrigated (≈ 70 irrigators), Significant expansion not expected. Future 550 ha spray irrigated. Currently three water sources - if all spray could potentially be supplied from either Lower Manuherikia or Lower Manor (particularly if Hopes Creek Dam goes ahead) An indicative Piped Distribution Network has been developed to supply pressurised water to areas below the current upper race.
, Significant expansion not expected. Future 550 ha spray irrigated. Currently three water sources - if all spray could potentially be supplied from either Lower Manuherikia or Lower Manor (particularly if Hopes Creek Dam goes ahead) An indicative Piped Distribution Network has been developed to supply pressurised water to areas below the current upper race..")
30
High Race Alignment

31
Hydrological Model Scenarios Two initial model scenarios are proposed to envelop the likely optimum flow regime. 1.Current regime – based on existing minimum flows and current allocation levels. Will maximise abstraction and the potentially irrigable area. 2.Proposed regime 1 – minimum flows on all major tributaries, catchment primary allocation of 3,200 L/s as per ORC Water Plan, secondary allocation at higher minimum flow to accommodate current allocation and uses guidance provide in the National Policy Statement for Freshwater Management 2011 and the proposed National Environmental Standard (NES) for ecological flows. This regime has a more environmental focus and is expected to reduce abstraction and limit the potentially irrigable area.
 for ecological flows. This regime has a more environmental focus and is expected to reduce abstraction and limit the potentially irrigable area..")
32
Hydrological Model Scenarios The current allocation levels used in the proposed regimes are based on our consent review which has been checked and confirmed by the Otago Regional Council consenting staff.

33
Hydrological Model Scenarios Sub catchment allocation zone Location of minimum flow site Primary Allocation criteriaSecondary Allocation criteria Other environmental flow requirements Minimum or residual flowAllocation limit Minimum or residual flow Allocation limit Above Falls Dam Downstream of Dam As required on tributaries by Mt Ida Race takes. Mt Ida Race takes. 1.500 L/s Residual flow below dam as per current consents. Unlimited to allow Falls Dam to harvest inflows. Nil Nil Nil 2.1,370 L/s being natural 7DMALF of dam inflows Nil Flushing flow of 3x median dam inflow released for 24 hours when flow below dam has been less than 3x median dam inflow for more 30 consecutive days. Dunstan Creek At Gorge 1.Nil as per current consents. Consented consumptive primary take 1,570 L/s. Nil 2.620 L/s being 7DMALF 1,000 L/s being 90% reliable water Aqualinc 2013. 1,620 L/s being Primary min flow plus primary allocation limit. 570 L/s being unreliable part of current consented take. Lauder Creek At Cattle Yards (recorder may need to be re- established) 1.Nil as per current consents. Consented consumptive primary take 1,503.04 L/s. Nil 2.230 L/s being 7DMALF 240 L/s being 90 % reliable water Aqualinc 2013. 470 L/s being Primary min flow plus primary allocation limit. 1,263.04 L/s being unreliable part of current consented take.
 1.Nil as per current consents. Consented consumptive primary take 1, L/s. Nil L/s being 7DMALF 240 L/s being 90 % reliable water Aqualinc L/s being Primary min flow plus primary allocation limit. 1, L/s being unreliable part of current consented take..")
34
Hydrological Model Scenarios Sub catchment allocation zone Location of minimum flow site Primary Allocation criteriaSecondary Allocation criteria Other environmental flow requirements Minimum or residual flowAllocation limit Minimum or residual flow Allocation limit Ida Burn above Mt Ida Dam Below proposed Mt Ida Dam 1.7 L/s Residual flow as per DHA 2006. Unlimited to allow Mt Ida Dam to harvest inflows. Nil Flushing not considered at this stage as flows are known to disappear in to the gravels downstream of the proposed dam. For subsequent scenarios active management of flows may be required for sensitive fish species in lower Ida Burn. 2.Residual flow of natural 7DMALF at Dam site – to be calculated (7 day low flow with 10 year return period = 62 L/s from Raineffects 2005). Ida Burn (Including Pool Burn) At Cobb Cottage Nil as per current consents. The hydrological model does not consider the Ida Valley and uses measured flows from the Ida Burn at Cobb Cottage which includes the effect of upstream irrigation and operation of the Poolburn and Mannorburn reservoirs. In future may need to consider Ida Valley irrigation and separate Pool Burn from the Ida Burn. Allocation from the Pool Burn is expected to be very high, and may need to be reduced in subsequent scenarios. Flushing from the Poolburn dam is not considered. Thomsons Creek At diversion weir (recorder may need to re- established) 1.Nil as per current consents. Consented consumptive primary take 1,562.09 L/s. Nil 2.170 L/s being 7DMALF 180 L/s being 90 % reliable water Aqualinc 2013. 350 L/s being Primary minimum flow plus primary allocation limit. 1,382.09 L/s being unreliable part of current consented take.
. Ida Burn (Including Pool Burn) At Cobb Cottage Nil as per current consents. The hydrological model does not consider the Ida Valley and uses measured flows from the Ida Burn at Cobb Cottage which includes the effect of upstream irrigation and operation of the Poolburn and Mannorburn reservoirs. In future may need to consider Ida Valley irrigation and separate Pool Burn from the Ida Burn. Allocation from the Pool Burn is expected to be very high, and may need to be reduced in subsequent scenarios. Flushing from the Poolburn dam is not considered. Thomsons Creek At diversion weir (recorder may need to re- established) 1.Nil as per current consents. Consented consumptive primary take 1, L/s. Nil L/s being 7DMALF 180 L/s being 90 % reliable water Aqualinc L/s being Primary minimum flow plus primary allocation limit. 1, L/s being unreliable part of current consented take..")
35
Hydrological Model Scenarios Sub catchment allocation zone Location of minimum flow site Primary Allocation criteriaSecondary Allocation criteria Other environmental flow requirements Minimum or residual flow Allocation limit Minimum or residual flow Allocation limit Manuherikia Upper At Ophir 820 L/s as per ORC plan 1.Consented consumptive primary take 8,029.08 L/s (excluding takes associated with Mt Ida Race, Falls Dam and Poolburn/Upper Manorburn reservoirs). 820 L/s as per ORC plan. Consented consumptive secondary take 123.60 L/s (excluding takes associated with Mt Ida Race and Falls Dam). Nil 2.2,815 L/s as per ORC plan (3,200 L/s) scaled relative to flow contribution (Aqualinc 2012). 6,450 L/s being Primary minimum flow plus 2 times primary allocation limit. 5,337.68 being consented consumptive take less primary allocation in ORC plan. Chatto Creek At Manuherikia Confluence (recorder may need to re- established) 1.Nil as per current consents. Consented consumptive primary take 1,432 L/s. Nil 2.Natural 7DMALF yet to be calculated 90 % reliable water - to be calculated Primary minimum flow plus primary allocation limit - to be calculated. Unreliable part of 1,432 consented take – to be calculated. Manor Burn Below lower Manorburn Dam Nil Consented consumptive primary take 655.63 L/s (excluding takes associated with Upper Manorburn reservoir). Nil Manuherikia Lower At Campground Flow that equates to 820 L/s at Ophir yet to be calculated expected to be in the order of 1,000 L/s. 1.Consented consumptive primary take 4,230.06 L/s NilNil. Nil 2.345 L/s as per ORC plan (3,200 L/s) scaled relative to flow contribution (Aqualinc 2012). Approx. 1,345 L/s being Primary minimum flow plus primary allocation limit - to be calculated. 3,885.06 L/s being consented consumptive take less primary allocation in ORC plan
. Nil 2.2,815 L/s as per ORC plan (3,200 L/s) scaled relative to flow contribution (Aqualinc 2012). 6,450 L/s being Primary minimum flow plus 2 times primary allocation limit. 5, being consented consumptive take less primary allocation in ORC plan. Chatto Creek At Manuherikia Confluence (recorder may need to re- established) 1.Nil as per current consents. Consented consumptive primary take 1,432 L/s. Nil 2.Natural 7DMALF yet to be calculated 90 % reliable water - to be calculated Primary minimum flow plus primary allocation limit - to be calculated. Unreliable part of 1,432 consented take – to be calculated. Manor Burn Below lower Manorburn Dam Nil Consented consumptive primary take L/s (excluding takes associated with Upper Manorburn reservoir). Nil Manuherikia Lower At Campground Flow that equates to 820 L/s at Ophir yet to be calculated expected to be in the order of 1,000 L/s. 1.Consented consumptive primary take 4, L/s NilNil. Nil L/s as per ORC plan (3,200 L/s) scaled relative to flow contribution (Aqualinc 2012). Approx. 1,345 L/s being Primary minimum flow plus primary allocation limit - to be calculated. 3, L/s being consented consumptive take less primary allocation in ORC plan.")
36
Hydrological Model Scenarios Sub catchment allocation zone Location of minimum flow site Primary Allocation criteriaSecondary Allocation criteria Other environmental flow requirements Minimum or residual flow Allocation limit Minimum or residual flow Allocation limit Below Campground covers the main stem of the Manuherikia River and all tributaries below the Campground monitoring site at Alexandra, and Waikerikeri Creek. Nil Consented consumptive primary take 194.21 L/s (excluding Dairy Creek take from lake Dunstan.) Nil Groundwater takes which are strongly hydraulically connected to a surface water resource (i.e., stream depleting groundwater takes) are to be managed as part of the relevant surface water block. Other groundwater takes which are not hydraulically connected to a surface water resource (i.e., non steam depleting groundwater takes) are to be managed through the four groundwater allocation zones outlined in ORC’s 2012 Alexandra Groundwater Basin Allocation Study.
 Nil Groundwater takes which are strongly hydraulically connected to a surface water resource (i.e., stream depleting groundwater takes) are to be managed as part of the relevant surface water block. Other groundwater takes which are not hydraulically connected to a surface water resource (i.e., non steam depleting groundwater takes) are to be managed through the four groundwater allocation zones outlined in ORC’s 2012 Alexandra Groundwater Basin Allocation Study..")
37
Hydrological Model Scenarios Irrigation demand to be determined by Aqualinc to represent fully pasture production throughout the irrigated area. Intake efficiency: assume run of river intakes harvest 80% of available flow above the minimum up to the maximum allocation. Irrigation efficiency: 10% distribution losses (from open races with buffer storage to significantly reduce by-wash). Spray - 90 % on farm efficiency. Flood – 40 % on individual paddocks, with reused downstream overall efficiency of 60%.
. Spray - 90 % on farm efficiency. Flood – 40 % on individual paddocks, with reused downstream overall efficiency of 60%..")
38
Hydrological Model Scenarios Dam Variables: Use updated stage storage curve for Falls Dam and model both total and live storage. Priority for allocation from dam. 1.Minimum flows 2.Other Environmental flows (i.e. Flushing Flows). 3.Irrigation Demand. Determine irrigable area for the three scenarios (low 19 M m 3 live storage, mid 50 M m 3 live storage and high 114 M m 3 live storage raises) based on achieving full production 9 years out of 10, i.e. irrigation restrictions and dam empty 1 year in 10.
. 3.Irrigation Demand. Determine irrigable area for the three scenarios (low 19 M m 3 live storage, mid 50 M m 3 live storage and high 114 M m 3 live storage raises) based on achieving full production 9 years out of 10, i.e. irrigation restrictions and dam empty 1 year in 10..")
39
Hydrological Model Scenarios Low Raise 19 M m 3 live storage – Irrigation area priorities: 1.Galloway 550 ha (50% spray, 50% flood), all supplied from the Lower Manuherikia River above Manor Burn confluence. 2.Private irrigators (Robinson and Shaky Bridge Enterprises) 100 ha spray irrigated, supplied from the Lower Manuherikia above Manor Burn confluence. 3.MIS 3,200 ha irrigated (80% spray, 20% flood), all supplied from the Lower Manuherikia River above Chatto Creek confluence. 4.Maximise use of run of river takes from tributaries above Ophir to irrigate a further ≈3,000 ha (60% spray, 40% flood). 5.Private irrigators (Blacks Flat and Thurlow) 340 ha spray irrigated from mid Manuherikia River (above Thomson Creek confluence). 6.OIS Main Race – 3,500 ha spray irrigated from upper Manuherikia River (above Dunstan Creek confluence) 7.Blackstone – 660 ha spray irrigated from upper Manuherikia River (above Dunstan Creek confluence) 8.Increase/Decrease OIS Main Race and Blackstone irrigation as required.
 100 ha spray irrigated, supplied from the Lower Manuherikia above Manor Burn confluence. 3.MIS 3,200 ha irrigated (80% spray, 20% flood), all supplied from the Lower Manuherikia River above Chatto Creek confluence. 4.Maximise use of run of river takes from tributaries above Ophir to irrigate a further ≈3,000 ha (60% spray, 40% flood). 5.Private irrigators (Blacks Flat and Thurlow) 340 ha spray irrigated from mid Manuherikia River (above Thomson Creek confluence). 6.OIS Main Race – 3,500 ha spray irrigated from upper Manuherikia River (above Dunstan Creek confluence) 7.Blackstone – 660 ha spray irrigated from upper Manuherikia River (above Dunstan Creek confluence) 8.Increase/Decrease OIS Main Race and Blackstone irrigation as required..")
40
Hydrological Model Scenarios Mid Raise 50 M m 3 live storage – Irrigation area priorities: 1.Below Ophir as per Low Raise 19 M m 3 live storage scenario. 2.Maximise use of run of river takes from tributaries above Ophir (excluding Dunstan and Lauder (discussed below) to irrigate a further ≈650 ha (60% spray, 40% flood). 3.Private irrigators (Blacks Flat and Thurlow) 350 ha spray irrigated from mid Manuherikia River (above Thomson Creek confluence). 4.OIS Main Race – 3,700 ha spray irrigated from upper Manuherikia River (above Dunstan Creek confluence) 5.Blackstone – 1,000 ha spray irrigated from upper Manuherikia River (above Dunstan Creek confluence) 6.Greenfields – 1,000 ha of new spray irrigation from high race directly from Falls Dam 7.Dunstan and Downs - Maximise use of run of river take from Dunstan supplemented with Falls Dam water via high race directly from Falls Dam allowing 2,200 ha to be fully spray irrigated on the Downs and 2,300 ha to be irrigated (80% spray, 20% flood) between Dunstan and Lauder Creek. 8.Lauder - Maximise use of run of river take from Lauder supplemented with Falls Dam water via high race directly from Falls Dam allowing 800 ha to be irrigated south of Lauder Creek (60% spray, 40% flood). 9.Increase/Decrease Dunstan to Lauder Creek irrigation as required.
 to irrigate a further ≈650 ha (60% spray, 40% flood). 3.Private irrigators (Blacks Flat and Thurlow) 350 ha spray irrigated from mid Manuherikia River (above Thomson Creek confluence). 4.OIS Main Race – 3,700 ha spray irrigated from upper Manuherikia River (above Dunstan Creek confluence) 5.Blackstone – 1,000 ha spray irrigated from upper Manuherikia River (above Dunstan Creek confluence) 6.Greenfields – 1,000 ha of new spray irrigation from high race directly from Falls Dam 7.Dunstan and Downs - Maximise use of run of river take from Dunstan supplemented with Falls Dam water via high race directly from Falls Dam allowing 2,200 ha to be fully spray irrigated on the Downs and 2,300 ha to be irrigated (80% spray, 20% flood) between Dunstan and Lauder Creek. 8.Lauder - Maximise use of run of river take from Lauder supplemented with Falls Dam water via high race directly from Falls Dam allowing 800 ha to be irrigated south of Lauder Creek (60% spray, 40% flood). 9.Increase/Decrease Dunstan to Lauder Creek irrigation as required..")
41
Hydrological Model Scenarios High Raise 114 M m 3 live storage – Irrigation area priorities: 1.Below Ophir as per Low Raise 19 M m 3 live storage scenario. 2.Maximise use of run of river takes from tributaries above Ophir (excluding Dunstan, Lauder and Thomsons (discussed below) to irrigate a further ≈350 ha (60% spray, 40% flood). 3.Private irrigators (Blacks Flat and Thurlow) 400 ha spray irrigated from mid Manuherikia River (above Thomson Creek confluence). 4.OIS Main Race – 6,000 ha spray irrigated from upper Manuherikia River (above Dunstan Creek confluence) 5.Blackstone – 1,200 ha spray irrigated from upper Manuherikia River (above Dunstan Creek confluence) 6.Greenfields – 1,200 ha of new spray irrigation from high race directly from Falls Dam 7.Dunstan and Downs - Maximise run of river take from Dunstan Creek supplemented with Falls Dam water via high race allowing 2,400 ha to be fully spray irrigated on the Downs and 4,200 ha to be irrigated (80% spray, 20% flood) between Dunstan and Lauder Creek. 8.Lauder - Maximise run of river take from Lauder Creek supplemented with Falls Dam water via high race allowing 3,200 ha to be irrigated south of Lauder Creek (80% spray, 20% flood). 9.Thomsons Matakanui - Maximise run of river take from Thomsons and via Country Race supplemented with Falls Dam water via high race allowing 3,400 ha to be irrigated south of Thomsons Creek (80% spray, 20% flood). 10.Increase/Decrease OIS Main Race and south of Thomsons Creek irrigation as required.
 to irrigate a further ≈350 ha (60% spray, 40% flood). 3.Private irrigators (Blacks Flat and Thurlow) 400 ha spray irrigated from mid Manuherikia River (above Thomson Creek confluence). 4.OIS Main Race – 6,000 ha spray irrigated from upper Manuherikia River (above Dunstan Creek confluence) 5.Blackstone – 1,200 ha spray irrigated from upper Manuherikia River (above Dunstan Creek confluence) 6.Greenfields – 1,200 ha of new spray irrigation from high race directly from Falls Dam 7.Dunstan and Downs - Maximise run of river take from Dunstan Creek supplemented with Falls Dam water via high race allowing 2,400 ha to be fully spray irrigated on the Downs and 4,200 ha to be irrigated (80% spray, 20% flood) between Dunstan and Lauder Creek. 8.Lauder - Maximise run of river take from Lauder Creek supplemented with Falls Dam water via high race allowing 3,200 ha to be irrigated south of Lauder Creek (80% spray, 20% flood). 9.Thomsons Matakanui - Maximise run of river take from Thomsons and via Country Race supplemented with Falls Dam water via high race allowing 3,400 ha to be irrigated south of Thomsons Creek (80% spray, 20% flood). 10.Increase/Decrease OIS Main Race and south of Thomsons Creek irrigation as required..")
Similar presentations


>")


 Conditions on the Colorado River Urban Water Institute’s 21 st Annual Conference August 14, 2014.>")
 Taylor Dixon, Hydrologist February 12, 2014.>")


 for the Orange-Fish-Sundays Water Transfer Scheme 18 th October.>")

