Download presentation
Presentation is loading. Please wait.

1
A View from Wall Street Independent Petroleum Association of America Private Capital Conference April 19, 2004

2
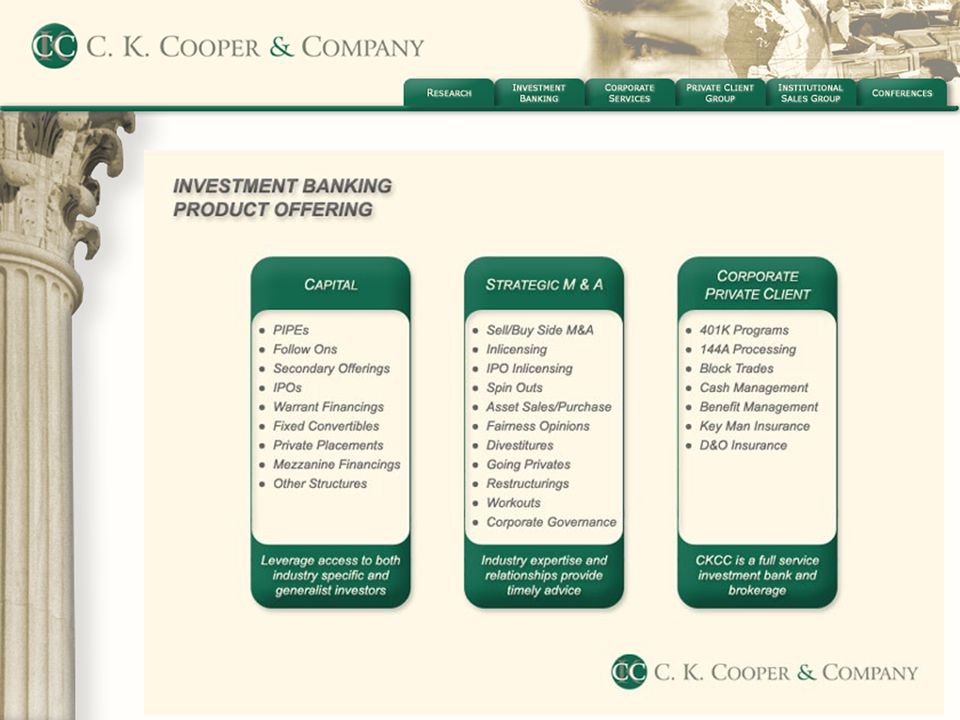
Background Formed in 1981 Oil & Gas Focus Since 1996 Research Focus Full Service Investment Bank

5
Equity Research Focus Exploration & Production Market Capitalization of >$500m Focus on Core Research Thesis

6
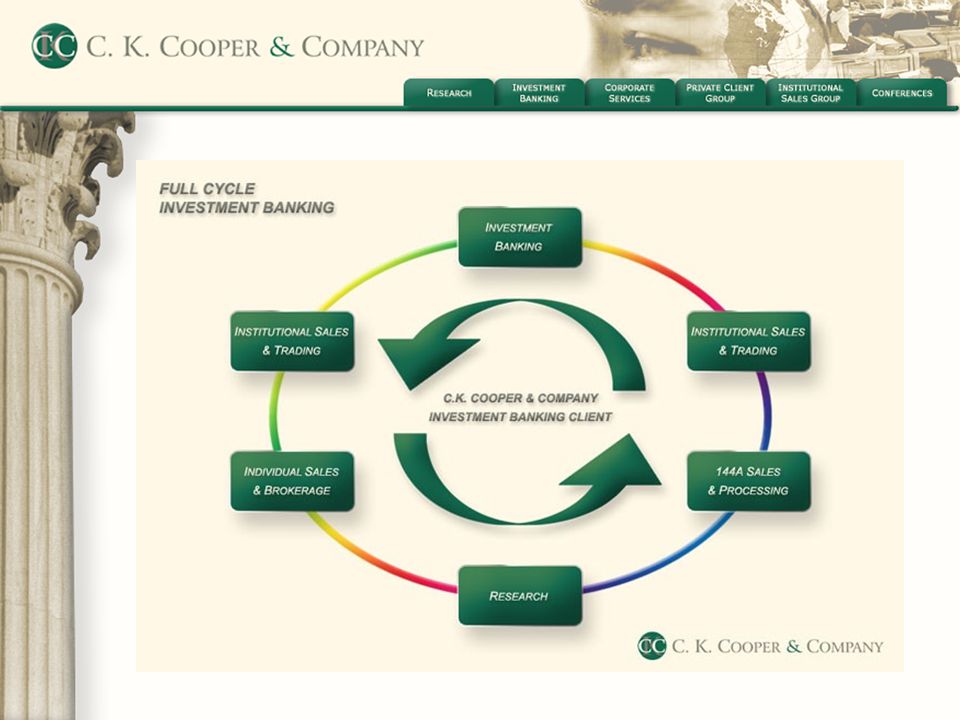
Maintain Growth Rates Further Develop Niche Sale/Exit at Premium Acquire Assets/ Companies SMALL/MID CAP BUSINESS CYCLE Niche Business Strategy Sale/Exit at Premium Development of Value Recognition of Value MICRO-CAP BUSINESS CYCLE Selective Selling Accumulate Positions Identify Investment Opportunity Management Team Exits and Starts Over Exit Strategy = Above Average Returns

7
Review of 2003 Stock Market Performance Commodity Prices Drilling Rig Count Acquisition/Merger Market Share Price Performance

8
Commodity Prices

9
Drilling Rig Count

10
Price Paid per Mcfe

11
Peer Group Performance & Index

12
2004 Summary Outlook Larger Market Exposure Solid Fundamental Outlook Increasing Prices for Acquisitions Ample Access to Capital Niche Value = Success

13
Capital Formation - Private Evolution of this Aspect of Capital Markets Capital Growth for all size of E&P issues Relative Quick Execution –5 to 45 Days

14
Private Placement(s)
")
15
Typical Deal Terms Common Stock Transactions –Discount to Market Price 10 – 20% Discount –Warrant Coverage 0 – 100% Coverage Varying Exercise Price & Term

16
Typical Deal Terms Preferred Stock –Typical Premium to Market 5 – 25% Multiple Options – Bells & Whistles –Warrant(s) sometimes included
 sometimes included")
17
Market Evolution

18
Breakdown of 2003/04 Transactions Transactions NYSE – Common = 2$73.6 million NYSE – Non – Common = 1$15.0 million AMEX – Common = 9$101.7 million Amex – Non-Common = 4$37.0 million

19
Breakdown of 2003/04 Transactions Transactions NASDAQ/NMS – Common = 8$95.8 million NASDAQ/NMS – Non-Common = 8$88.7 million NASDAQ/Small-Cap – Common = 5$37.8 million NASDAQ/Small-Cap – Non-Common = 7$59.4 million

20
Breakdown of 2003/04 Transactions Transactions OTCBB – Common = 50$322.0 million OTCBB – Non-Common = 16$149.0 million

21
Quality vs. Size

22
Visible Trends Access to Capital across the Spectrum Smaller Companies – Smaller Deals Continue evolution of Business Cycles – Fewer Issues at Higher Tiers

23
Use of Proceeds

24
Visible Trends Investors Desire Upside Development Restructuring Balance Sheet in an Attractive Interest Rate Market Acquisitions @ Higher Price Matrix’s General Corporate Purposes – (Large Degree of “Story”)
")
25
Conclusion Ample Capital in the Public Markets through Private Placements Use of Proceeds is not as Critical as in early 2003 Quality Issuer = Terms & Size

Similar presentations


 Optimal Dividend Policy Conflicting Theories Other Dividend Policy Issues Residual Dividend Theory Stable.>")
 and March 20 (OCC)>")
 establishes a portfolio of securities, then issues shares to the public backed by the underlying securities.>")
. Industry Overview 2 Gold mining is capital intensive Capital is very expensive for small exploration and production.>")


 Closing Price on 12/7: 25.31 DCF Upside: 24.9%>")


