Download presentation
Presentation is loading. Please wait.

1
Cellular Respiration: Harvesting Chemical Energy
Chapter 9 Cellular Respiration: Harvesting Chemical Energy Lectures prepared by Dr. Jorge L. Alonso Florida International University

2
Photosynthesis and Respiration
Figure 9.1 How do these leaves power the work of life for the giant panda?

3
Theme 4: Organisms interact with their environments, exchanging matter and energy
Sunlight Ecosystem Photosynthesis Cycling of chemical nutrients Heat Chemical energy Concept 9.1: Catabolic pathways yield energy by oxidizing organic fuels Figure 1.5 Nutrient cycling and energy flow in an ecosystem Respiration Heat

4
Photosynthesis and Respiration
Light energy ECOSYSTEM Photosynthesis Photosynthesis in chloroplasts CO2 + H2O C6H12O6 + O2 Cellular respiration in mitochondria Respiration Figure 9.2 Energy flow and chemical recycling in ecosystems ATP ATP powers most cellular work Heat energy

6
Catabolic Pathways and Production of ATP
Fermentation is a partial degradation of sugars that occurs without O2 (anaerobic) to produce a little energy (ATP) and ethanol (or lactate). Aerobic Respiration is a more complete degradation of sugars that occurs with O2 and yields much more energy (ATP) and CO2.
 to produce a little energy (ATP) and ethanol (or lactate). Aerobic Respiration is a more complete degradation of sugars that occurs with O2 and yields much more energy (ATP) and CO2.")
7
Fermentation is a partial degradation of sugars that occurs without O2 (anaerobic) to produce a little energy (ATP) and ethanol (or lactate). Lactic Acid Fermentation: in animal cells, in the absence of sufficient oxygen, enzymes facilitate production of lactic acid Alcoholic Fermentation: in Yeast cells, enzymes facilitate production of ethanol.

8
Other types of Fermentation

9
C6H12O6 + 6 O2 6 CO2 + 6 H2O + Energy (36 ATP + heat)
Cellular Respiration Cellular respiration includes both aerobic and anaerobic respiration but is often used to refer to aerobic respiration Although carbohydrates, fats, and proteins are all consumed as fuel, it is helpful to trace cellular respiration with the sugar glucose: C6H12O6 + 6 O2 6 CO2 + 6 H2O + Energy (36 ATP + heat) Copyright © 2008 Pearson Education, Inc., publishing as Pearson Benjamin Cummings
 Copyright © 2008 Pearson Education, Inc., publishing as Pearson Benjamin Cummings.")
10
Cellular Respiration C6H12O6 It includes both aerobic and anaerobic components, but whole process is refered to as aerobic respiration C6H12O6 + 6 O2 6 CO2 + 6 H2O + Energy (ATP + heat) The whole process is composed of three major stages 2 2 2 4 2 Oxidative Phosphorylation 6 Glycolysis Citric Acid (Krebs) Cycle Oxidative Phosphorylation 36 6
 The whole process is composed of three major stages Oxidative Phosphorylation. 6. Glycolysis. Citric Acid (Krebs) Cycle. Oxidative Phosphorylation")
11
Redox Reactions: Oxidation and Reduction
Chemical reactions in which electrons are transferred between the reactants and release energy e- Energy Oxidation: substance loses electrons, or is oxidized Reduction: substance gains electrons, or is reduced (the amount of positive charge is reduced) Na Na e- Reducing agent Cl e- Cl- Oxidizing agent
 Na Na+ + e- Reducing agent. Cl + e- Cl- Oxidizing agent.")
12
Carbon: has e- further away
In redox reactions involving covalent (organic) compounds the electrons are not transferred to produce ions, but a change occurs in the way in which electron are shared in the covalent bonds (1) oxidation: e- pulled further away, (2) reduction: e- shared closer). becomes oxidized + + + becomes reduced 2- 4+ 2- 2- + 4- + + + Figure 9.3 Methane combustion as an energy-yielding redox reaction Oxygen: has e- further away + Carbon: has e- further away Oxygen: has e- closer Carbon: has e- closer
 compounds the electrons are not transferred to produce ions, but a change occurs in the way in which electron are shared in the covalent bonds (1) oxidation: e- pulled further away, (2) reduction: e- shared closer). becomes oxidized becomes reduced Figure 9.3 Methane combustion as an energy-yielding redox reaction. Oxygen: has e- further away. + Carbon: has e- further away. Oxygen: has e- closer. Carbon: has e- closer.")
13
Carbohydrate (reduced)
How is the energy found in the bonding electrons of Glucose harvested to make ATP during Cellular Respiration? e- Energy How are these electrons transferred to oxygen? Electrons from organic compounds are usually first transferred to NAD+, an electron-acceptor coenzyme found in cells Electrons are carried in the form of high energy hydride ions: H- or H:- Each NADH (the reduced form of NAD+) represents stored energy that is tapped to synthesize ATP Carbohydrate (reduced) (oxidized) (oxidized) (reduced)
 represents stored energy that is tapped to synthesize ATP. Carbohydrate (reduced) (oxidized) (oxidized) (reduced)")
14
Carbohydrate (reduced)
Nicotinamide Adenine Diphosphate (NAD+ NADH) H H 2 e– + 2 H+ 2 e– + H+ Carbohydrate (reduced) NADH H+ Dehydrogenase Reduction of NAD+ NAD+ + 2[H] + H+ Oxidation of NADH Nicotinamide (reduced form) Nicotinamide (oxidized form) Figure 9.4 NAD+ as an electron shuttle
 H. H. 2 e– + 2 H+ 2 e– + H+ Carbohydrate (reduced) NADH. H+ Dehydrogenase. Reduction of NAD+ NAD+ + 2[H] + H+ Oxidation of NADH. Nicotinamide. (reduced form) Nicotinamide. (oxidized form) Figure 9.4 NAD+ as an electron shuttle.")
15
How are electrons and their energy harvested from Glucose?
C6H12O6 NADH and FADH2 gather electrons (H-) at different stages of respiration and passes them to the electron transport chain. The electron transport chain passes energetic electrons to O2 in a series of enzymatically controlled steps (instead of one explosive reaction) O2 pulls electrons (H-) down the chain in an energy-yielding tumble and H2O is produced. The energy yielded is used to regenerate ATP (oxidative phosphorylation) 2 2 2 fc 4 2 Oxidative Phosphorylation 6 36 6
 at different stages of respiration and passes them to the electron transport chain. The electron transport chain passes energetic electrons to O2 in a series of enzymatically controlled steps (instead of one explosive reaction) O2 pulls electrons (H-) down the chain in an energy-yielding tumble and H2O is produced. The energy yielded is used to regenerate ATP (oxidative phosphorylation) fc Oxidative Phosphorylation")
16
The electron transport chain passes energetic electrons to O2 in a series of enzymatically controlled steps (instead of one explosive reaction) H2 + 1/2 O2 2 H + 1/2 O2 (from glucose via NADH) Controlled release of energy for synthesis of ATP 2 H e– ATP Explosive release of heat and light energy ATP Electron transport chain Free energy, G Free energy, G ATP Figure 9.5 An introduction to electron transport chains 2 e– 1/2 O2 2 H+ H2O H2O (a) Uncontrolled reaction (b) Cellular respiration
 Controlled. release of. energy for. synthesis of. ATP. 2 H+ + 2 e– ATP. Explosive. release of. heat and light. energy. ATP. Electron transport. chain. Free energy, G. Free energy, G. ATP. Figure 9.5 An introduction to electron transport chains. 2 e– 1/2 O2. 2 H+ H2O. H2O. (a) Uncontrolled reaction. (b) Cellular respiration.")
17
The Stages of Cellular Respiration:
Glycolysis (breaks down glucose into two molecules of pyruvate), some ATP and NADH produced The Citric Acid (Krebs) Cycle (breaks down pyruvate into CO2), producing some ATP, NADH and FADH2 Electrons carried via NADH The Stages of Cellular Respiration: Glycolysis Glucose Pyruvate Figure 9.6 An overview of cellular respiration Cytosol ATP Substrate-level phosphorylation
, some ATP and NADH produced. The Citric Acid (Krebs) Cycle (breaks down pyruvate into CO2), producing some ATP, NADH and FADH2. Electrons. carried. via NADH. The Stages of Cellular Respiration: Glycolysis. Glucose. Pyruvate. Figure 9.6 An overview of cellular respiration. Cytosol. ATP. Substrate-level. phosphorylation.")
18
The Stages of Cellular Respiration:
Glycolysis (breaks down glucose into two molecules of pyruvate), some ATP and NADH produced The Citric Acid (Krebs) Cycle (breaks down pyruvate into CO2), producing some ATP, NADH and FADH2 Oxidative Phosphorylation (uses H2O to oxidize the NADH & FADH2 produced in previous steps, producing O2 and lots of ATP) Electrons carried via NADH Electrons carried via NADH and FADH2 The Stages of Cellular Respiration: Glycolysis Citric acid cycle Glucose Pyruvate Figure 9.6 An overview of cellular respiration Mitochondrion Cytosol ATP ATP Substrate-level phosphorylation Substrate-level phosphorylation
, some ATP and NADH produced. The Citric Acid (Krebs) Cycle (breaks down pyruvate into CO2), producing some ATP, NADH and FADH2. Oxidative Phosphorylation (uses H2O to oxidize the NADH & FADH2 produced in previous steps, producing O2 and lots of ATP) Electrons. carried. via NADH. Electrons carried. via NADH and. FADH2. The Stages of Cellular Respiration: Glycolysis. Citric. acid. cycle. Glucose. Pyruvate. Figure 9.6 An overview of cellular respiration. Mitochondrion. Cytosol. ATP. ATP. Substrate-level. phosphorylation. Substrate-level. phosphorylation.")
19
The Stages of Cellular Respiration:
Glycolysis (breaks down glucose into two molecules of pyruvate), some ATP and NADH produced The Citric Acid (Krebs) Cycle (breaks down pyruvate into CO2), producing some ATP, NADH and FADH2 Oxidative Phosphorylation (uses H2O to oxidize the NADH & FADH2 produced in previous steps, producing O2 and lots of ATP) Electrons carried via NADH Electrons carried via NADH and FADH2 The Stages of Cellular Respiration: Oxidative phosphorylation: (1) Electron transport and (2) chemiosmosis Glycolysis Citric acid cycle Glucose Pyruvate Figure 9.6 An overview of cellular respiration Mitochondrion Cytosol ATP ATP ATP Substrate-level phosphorylation Substrate-level phosphorylation Oxidative phosphorylation
, some ATP and NADH produced. The Citric Acid (Krebs) Cycle (breaks down pyruvate into CO2), producing some ATP, NADH and FADH2. Oxidative Phosphorylation (uses H2O to oxidize the NADH & FADH2 produced in previous steps, producing O2 and lots of ATP) Electrons. carried. via NADH. Electrons carried. via NADH and. FADH2. The Stages of Cellular Respiration: Oxidative. phosphorylation: (1) Electron transport and. (2) chemiosmosis. Glycolysis. Citric. acid. cycle. Glucose. Pyruvate. Figure 9.6 An overview of cellular respiration. Mitochondrion. Cytosol. ATP. ATP. ATP. Substrate-level. phosphorylation. Substrate-level. phosphorylation. Oxidative. phosphorylation.")
20
About 10% of ATP is formed in glycolysis and the citric acid cycle by substrate-level phosphorylation Enzyme Substrate-Phosphorylated + ADP Product-unPhosphorylated + ATP Enzyme Figure 9.7 Substrate-level phosphorylation Enzyme ADP P Substrate + ATP Product

21
BioFlix: Cellular Respiration
The process that generates most of the ATP is called oxidative phosphorylation because it is powered by redox reactions BioFlix: Cellular Respiration H+ H+ H+ H+ Protein complex of electron carriers Cyt c V Q ATP synthase Figure 9.16 Chemiosmosis couples the electron transport chain to ATP synthesis 2 H+ + 1/2O2 H2O FADH2 FAD NADH NAD+ ADP + P ATP i (carrying electrons from food) H+ 1 Electron transport chain 2 Chemiosmosis This process accounts for almost 90% of the ATP generated by respiration
 H+ 1. Electron transport chain. 2. Chemiosmosis. This process accounts for almost 90% of the ATP generated by respiration.")
22
Concept 9.2: Glycolysis harvests chemical energy by oxidizing glucose to pyruvate
Glycolysis (“splitting of sugar”) breaks down glucose into two molecules of pyruvate Glycolysis has two major phases: (1)Energy investment phase (2)Energy payoff phase + Glucose 2 Pyruvates Figure 9.8 The energy input and output of glycolysis
 breaks down glucose into two molecules of pyruvate. Glycolysis has two major phases: (1)Energy investment phase. (2)Energy payoff phase. + Glucose. 2 Pyruvates. Figure 9.8 The energy input and output of glycolysis.")
23
Glucose ATP 1 Hexokinase ADP Glucose-6-phosphate
Figure 9.9 A closer look at glycolysis Glucose-6-phosphate

24
Glucose-6-phosphate 2 Phosphogluco- isomerase Fructose-6-phosphate
ATP 1 Hexokinase ADP Glucose-6-phosphate Glucose-6-phosphate 2 Phosphoglucoisomerase 2 Phosphogluco- isomerase Fructose-6-phosphate Figure 9.9 A closer look at glycolysis Fructose-6-phosphate

25
Fructose- 1, 6-bisphosphate
Glucose ATP 1 1 Hexokinase ADP Fructose-6-phosphate Glucose-6-phosphate 2 2 Phosphoglucoisomerase ATP 3 Phosphofructo- kinase Fructose-6-phosphate ATP 3 3 ADP Phosphofructokinase ADP Figure 9.9 A closer look at glycolysis Fructose- 1, 6-bisphosphate Fructose- 1, 6-bisphosphate

26
Aldolase Isomerase Fructose- 1, 6-bisphosphate 4 5 Dihydroxyacetone
Glucose ATP 1 Hexokinase ADP Glucose-6-phosphate 2 Phosphoglucoisomerase Fructose- 1, 6-bisphosphate 4 Fructose-6-phosphate Aldolase ATP 3 Phosphofructokinase ADP Figure 9.9 A closer look at glycolysis 5 Isomerase Fructose- 1, 6-bisphosphate 4 Aldolase 5 Isomerase Dihydroxyacetone phosphate Glyceraldehyde- 3-phosphate Dihydroxyacetone phosphate Glyceraldehyde- 3-phosphate

27
Glyceraldehyde- 3-phosphate
2 NAD+ 6 Triose phosphate dehydrogenase 2 NADH 2 P i + 2 H+ 2 2 1, 3-Bisphosphoglycerate Glyceraldehyde- 3-phosphate 2 NAD+ 6 Triose phosphate dehydrogenase 2 P 2 NADH i + 2 H+ Figure 9.9 A closer look at glycolysis 2 1, 3-Bisphosphoglycerate

28
2 2 ADP 2 ATP 2 3-Phosphoglycerate 1, 3-Bisphosphoglycerate 7
2 NAD+ 6 Triose phosphate dehydrogenase 2 NADH 2 P i + 2 H+ 2 1, 3-Bisphosphoglycerate 2 ADP 7 Phosphoglycerokinase 2 ATP 2 1, 3-Bisphosphoglycerate 2 ADP 2 3-Phosphoglycerate 7 Phosphoglycero- kinase 2 ATP Figure 9.9 A closer look at glycolysis 2 3-Phosphoglycerate

29
2 3-Phosphoglycerate 8 Phosphoglycero- mutase 2 2-Phosphoglycerate
2 NAD+ 6 Triose phosphate dehydrogenase 2 NADH 2 P i + 2 H+ 2 1, 3-Bisphosphoglycerate 2 ADP 7 Phosphoglycerokinase 2 ATP 2 3-Phosphoglycerate 2 3-Phosphoglycerate 8 Phosphoglyceromutase 8 Phosphoglycero- mutase 2 2-Phosphoglycerate Figure 9.9 A closer look at glycolysis 2 2-Phosphoglycerate

30
2 2-Phosphoglycerate Enolase 2 H2O 2 Phosphoenolpyruvate 9
2 NAD+ 6 Triose phosphate dehydrogenase 2 NADH 2 P i + 2 H+ 2 1, 3-Bisphosphoglycerate 2 ADP 7 Phosphoglycerokinase 2 ATP 2 2-Phosphoglycerate 2 3-Phosphoglycerate 8 Phosphoglyceromutase 9 Enolase 2 H2O 2 2-Phosphoglycerate 9 Enolase Figure 9.9 A closer look at glycolysis 2 H2O 2 Phosphoenolpyruvate 2 Phosphoenolpyruvate

31
2 Phosphoenolpyruvate 2 ADP 10 Pyruvate kinase 2 ATP 2 Pyruvate
2 NAD+ 6 Triose phosphate dehydrogenase 2 NADH 2 P i + 2 H+ 2 1, 3-Bisphosphoglycerate 2 ADP 7 Phosphoglycerokinase 2 ATP 2 Phosphoenolpyruvate 2 ADP 2 3-Phosphoglycerate 8 10 Phosphoglyceromutase Pyruvate kinase 2 ATP 2 2-Phosphoglycerate 9 Enolase 2 H2O Figure 9.9 A closer look at glycolysis 2 Phosphoenolpyruvate 2 ADP 10 Pyruvate kinase 2 ATP 2 Pyruvate 2 Pyruvate

32
Concept 9.3: The Citric Acid (Krebs) Cycle completes the energy-yielding oxidation of organic molecules C6H12O6 2 2 2 In the presence of O2, pyruvate enters the mitochondrion Before the citric acid cycle can begin, pyruvate must be converted to acetyl CoA, which links the cycle to glycolysis 4 2 Oxidative Phosphorylation 6 36 6

33
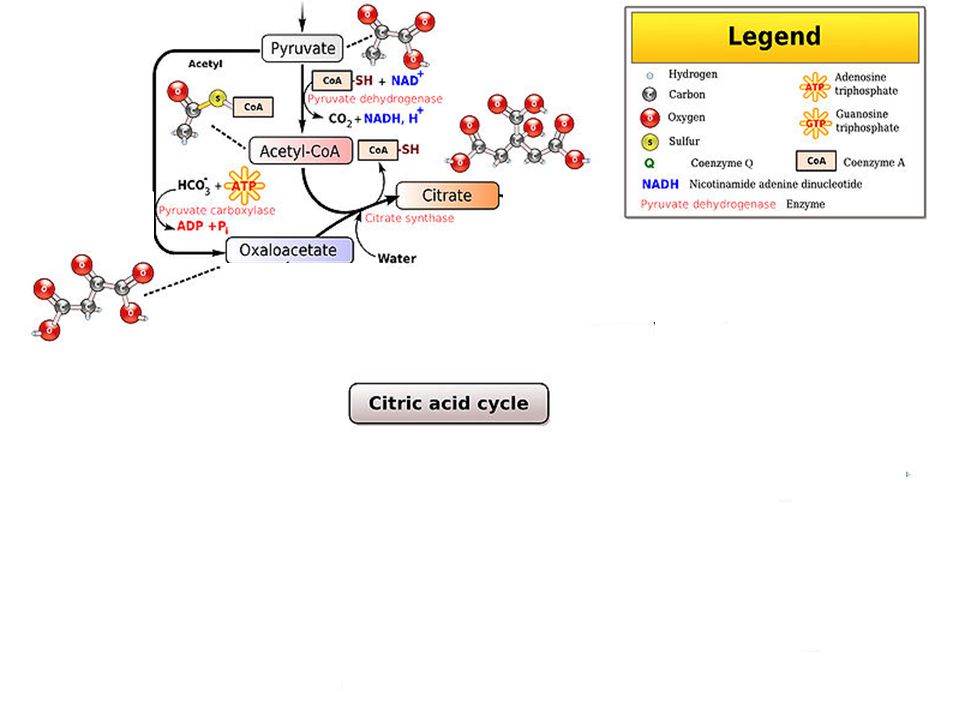
The junction between glycolysis & the citric acid cycle: Conversion of pyruvate to acetyl CoA
In the presence of O2, pyruvate enters the mitochondrion, at the cost of an ATP for transport of each pyruvate molecule Before the citric acid cycle can begin, pyruvate must be converted to acetyl CoA, which links the cycle to glycolysis CYTOSOL MITOCHONDRION NAD+ NADH + H+ 2 Figure 9.10 Conversion of pyruvate to acetyl CoA, the junction between glycolysis and the citric acid cycle 1 3 Acetyl CoA Pyruvate Coenzyme A CO2 Transport protein

34
The junction between glycolysis & the citric acid cycle: Conversion of pyruvate to acetyl CoA
Enzymes of Glycolysis juction to CAC: Citrate synthase Pyruvate carboxylase

35
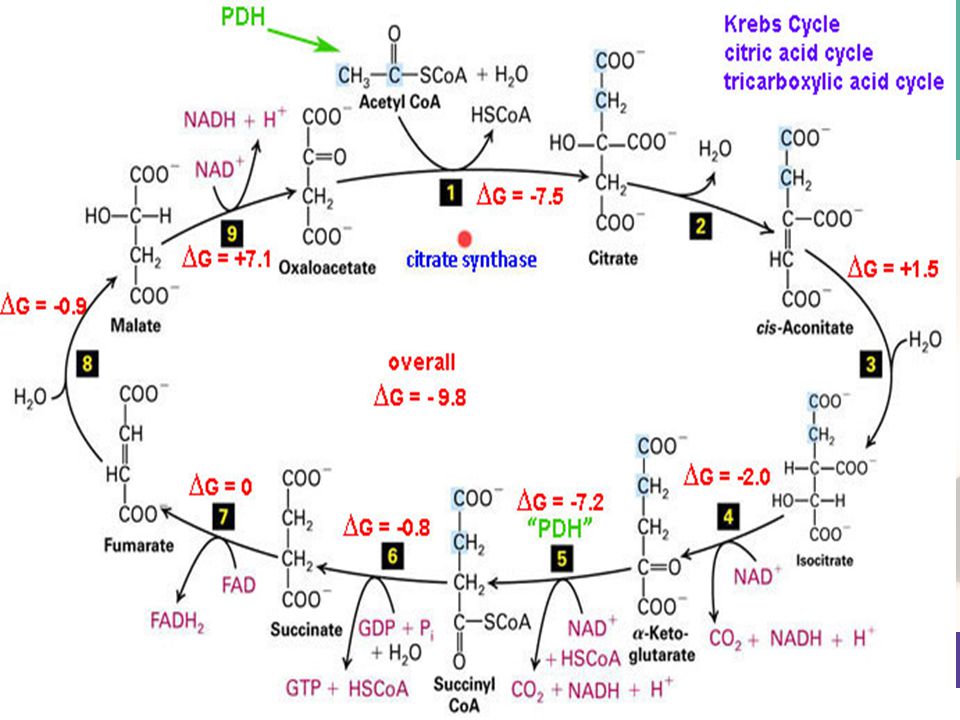
The Citric Acid (Krebs) Cycle
Pyruvate CO2 NAD+ CoA The CAC takes place within the mitochondrial matrix The cycle oxidizes organic fuel derived from pyruvate, generating 1 ATP, 3 NADH, and 1 FADH2 per turn NADH + H+ Acetyl CoA CoA CoA Citric acid cycle Figure 9.11 An overview of the citric acid cycle 2 CO2 FADH2 3 NAD+ FAD 3 NADH + 3 H+ ADP + P i ATP

36
The Citric Acid (Krebs) Cycle
Acetyl CoA CoA—SH In the first of eight steps in the CAC, the acetyl group of acetyl CoA joins the cycle by combining with oxaloacetate, forming citrate. Each step is catalyzed by a specific enzyme The next seven steps decompose the citrate back to oxaloacetate, making the process a cycle 1 Oxaloacetate Citrate Citric Acid Cycle Enzymes of CAC: Citrate synthase Figure 9.12 A closer look at the citric acid cycle

37
The Citric Acid (Krebs) Cycle Citric Acid Cycle Enzymes of CAC:
Acetyl CoA CoA—SH 1 H2O Oxaloacetate 2 Citrate Isocitrate Citric Acid Cycle Enzymes of CAC: Citrate synthase Aconitase Figure 9.12 A closer look at the citric acid cycle

38
The Citric Acid (Krebs) Cycle
Acetyl CoA CoA—SH The NADH and FADH2 produced by the cycle relay electrons extracted from food to the electron transport chain 1 H2O Oxaloacetate 2 Citrate Isocitrate NAD+ Citric Acid Cycle NADH 3 + H+ Enzymes of CAC: CO2 Citrate synthase Aconitase Isocirate dehydrogenase -Keto- glutarate Figure 9.12 A closer look at the citric acid cycle

39
The Citric Acid (Krebs) Cycle Citric Acid Cycle Enzymes of CAC:
Acetyl CoA CoA—SH 1 H2O Oxaloacetate 2 Citrate Isocitrate NAD+ Citric Acid Cycle NADH 3 + H+ Enzymes of CAC: CO2 Citrate synthase Aconitase Isocirate dehydrogenase ά-ketoglutarate dehydrogenase CoA—SH -Keto- glutarate Figure 9.12 A closer look at the citric acid cycle 4 CO2 NAD+ NADH Succinyl CoA + H+

40
The Citric Acid (Krebs) Cycle Citric Acid Cycle Enzymes of CAC:
Acetyl CoA CoA—SH 1 H2O Oxaloacetate 2 Citrate Isocitrate NAD+ Citric Acid Cycle NADH 3 + H+ Enzymes of CAC: CO2 Citrate synthase Aconitase Isocirate dehydrogenase ά-ketoglutarate dehydrogenase Succinyl-CoA synthetase CoA—SH -Keto- glutarate Figure 9.12 A closer look at the citric acid cycle 4 CoA—SH 5 CO2 NAD+ Succinate P NADH i GTP GDP Succinyl CoA + H+ ADP ATP

41
The Citric Acid (Krebs) Cycle Citric Acid Cycle Enzymes of CAC:
Acetyl CoA CoA—SH 1 H2O Oxaloacetate 2 Citrate Isocitrate NAD+ Citric Acid Cycle NADH 3 + H+ Enzymes of CAC: CO2 Fumarate Citrate synthase Aconitase Isocirate dehydrogenase ά-ketoglutarate dehydrogenase Succinyl-CoA synthetase Succinate dehydrogenase CoA—SH -Keto- glutarate Figure 9.12 A closer look at the citric acid cycle 6 4 CoA—SH FADH2 5 CO2 NAD+ FAD Succinate P NADH i GTP GDP Succinyl CoA + H+ ADP ATP

42
The Citric Acid (Krebs) Cycle Citric Acid Cycle Enzymes of CAC:
Acetyl CoA CoA—SH 1 H2O Oxaloacetate 2 Malate Citrate Isocitrate NAD+ Citric Acid Cycle NADH 3 7 + H+ H2O Enzymes of CAC: CO2 Fumarate Citrate synthase Aconitase Isocirate dehydrogenase ά-ketoglutarate dehydrogenase Succinyl-CoA synthetase Succinate dehydrogenase Fumarase CoA—SH -Keto- glutarate Figure 9.12 A closer look at the citric acid cycle 6 4 CoA—SH FADH2 5 CO2 NAD+ FAD Succinate P P NADH i GTP GDP Succinyl CoA + H+ ADP ATP

43
The Citric Acid (Krebs) Cycle Citric Acid Cycle Enzymes of CAC:
Acetyl CoA CoA—SH NADH +H+ 1 H2O NAD+ 8 Oxaloacetate 2 Malate Citrate Isocitrate NAD+ Citric Acid Cycle NADH 3 7 + H+ H2O Enzymes of CAC: CO2 Fumarate Citrate synthase Aconitase Isocirate dehydrogenase ά-ketoglutarate dehydrogenase Succinyl-CoA synthetase Succinate dehydrogenase Fumarase Malate dehydrogenase CoA—SH -Keto- glutarate Figure 9.12 A closer look at the citric acid cycle 4 6 CoA—SH FADH2 5 CO2 NAD+ FAD Succinate P NADH i GTP GDP Succinyl CoA + H+ ADP ATP

46
Concept 9.4: During oxidative phosphorylation, chemiosmosis couples electron transport to ATP synthesis C6H12O6 2 2 2 Following glycolysis and the citric acid cycle, NADH and FADH2 account for most of the energy extracted from food These two electron carriers donate electrons to the electron transport chain, which powers ATP synthesis via oxidative phosphorylation For the Cell Biology Video ATP Synthase 3D Structure — Side View, go to Animation and Video Files. For the Cell Biology Video ATP Synthase 3D Structure — Top View, go to Animation and Video Files. 4 2 Oxidative Phosphorylation 6 36 6

47
Oxidative Phosphorylation
The Enzymes for Oxidative Phosphorylation are located in the inner membrane of the cristae in the mitochondrion. Most of the chain’s components are proteins, which exist in multiprotein complexes Oxidative Phosphorylation is composed of two separate processes: Electron Transport Chain, which uses the energy in electrons to pump H+ ions from the matrix to the intermembrane space. {ETC 1} Chemosmosis, which uses the osmotic pressure from now concentrated H+ ions to energize ATP {ChmOsmo} Inter- membrane space Glycolysis Krebs Cycle Mitochondiral Matrix

48
The Pathway of Electron Transport
NADH Electrons are transferred from NADH or FADH2 to the electron transport chain Electrons are passed through a number of proteins including cytochromes (each with an iron atom) to O2 The carriers alternate reduced and oxidized states as they accept and donate electrons Electrons drop in free energy as they go down the chain and are finally passed to O2, forming H2O The electron transport chain generates no ATP 50 2 e– NAD+ FADH2 2 e– FAD Multiprotein complexes 40 FMN FAD Fe•S Fe•S Q Cyt b Fe•S 30 Cyt c1 IV Free energy (G) relative to O2 (kcal/mol) Cyt c Cyt a Cyt a3 20 2 e– 10 (from NADH or FADH2) 2 H+ + 1/2 O2 H2O
 to O2. The carriers alternate reduced and oxidized states as they accept and donate electrons. Electrons drop in free energy as they go down the chain and are finally passed to O2, forming H2O. The electron transport chain generates no ATP e– NAD+ FADH2. 2. e– FAD. Multiprotein. complexes. 40. FMN. FAD. Fe•S. Fe•S. Q. Cyt b. Fe•S. 30. Cyt c1. IV. Free energy (G) relative to O2 (kcal/mol) Cyt c. Cyt a. Cyt a e– 10. (from NADH. or FADH2) 2 H+ + 1/2. O2. H2O.")
49
The Pathway of Electron Transport
Electron transfer in the electron transport chain causes proteins to pump H+ from the mitochondrial matrix to the intermembrane space H+ then moves back across the membrane, passing through channels in ATP synthase ATP synthase uses the exergonic flow of H+ to drive phosphorylation of ATP This is an example of chemiosmosis, the use of energy in a H+ gradient to drive cellular work Inter- membrane space Figure 9.13 Free-energy change during electron transport Mitochondiral Matrix

50
ATP synthase, a molecular mill
INTERMEMBRANE SPACE The energy stored in a H+ gradient across a membrane couples the redox reactions of the electron transport chain to ATP synthesis The H+ gradient is referred to as a proton-motive force, emphasizing its capacity to do work H+ Stator Rotor Internal rod Figure 9.14 ATP synthase, a molecular mill Cata- lytic knob ADP + P ATP i MITOCHONDRIAL MATRIX

51
Number of photons detected (103)
Fig. 9-15 EXPERIMENT Magnetic bead Electromagnet Internal rod Sample Catalytic knob Nickel plate RESULTS Rotation in one direction Rotation in opposite direction No rotation Figure 9.15 Is the rotation of the internal rod in ATP synthase responsible for ATP synthesis? 30 Number of photons detected (103) 25 20 Sequential trials
 Sequential trials.")
52
EXPERIMENT Magnetic bead Electromagnet Internal rod Sample Catalytic
Fig. 9-15a EXPERIMENT Magnetic bead Electromagnet Internal rod Sample Figure 9.15 Is the rotation of the internal rod in ATP synthase responsible for ATP synthesis? Catalytic knob Nickel plate

53
RESULTS Rotation in one direction Rotation in opposite direction
Fig. 9-15b RESULTS Rotation in one direction Rotation in opposite direction No rotation 30 Number of photons detected (x 103) 25 Figure 9.15 Is the rotation of the internal rod in ATP synthase responsible for ATP synthesis? 20 Sequential trials
 25. Figure 9.15 Is the rotation of the internal rod in ATP synthase responsible for ATP synthesis 20. Sequential trials.")
54
Electron transport chain 2 Chemiosmosis
Fig. 9-16 H+ H+ H+ H+ Protein complex of electron carriers Cyt c V Q ATP synthase 2 H+ + 1/2O2 H2O FADH2 FAD NADH NAD+ Figure 9.16 Chemiosmosis couples the electron transport chain to ATP synthesis ADP + P ATP i (carrying electrons from food) H+ 1 Electron transport chain 2 Chemiosmosis Oxidative phosphorylation
 H+ 1. Electron transport chain. 2. Chemiosmosis. Oxidative phosphorylation.")
55
ATP Production by Cellular Respiration
During cellular respiration, most energy flows in this sequence: glucose NADH electron transport chain proton-motive force ATP About 40% of the energy in a glucose molecule is transferred to ATP during cellular respiration, making about 38 ATP

56
Concept 9.5: Fermentation and anaerobic respiration enable cells to produce ATP without the use of oxygen C6H12O6 2 2 2 Most cellular respiration requires O2 to produce ATP Glycolysis can produce ATP with or without O2 (in aerobic or anaerobic conditions) In the absence of O2, glycolysis couples with fermentation or anaerobic respiration to produce ATP 4 2 Oxidative Phosphorylation 6 36 6
 In the absence of O2, glycolysis couples with fermentation or anaerobic respiration to produce ATP Oxidative Phosphorylation")
57
Anaerobic respiration uses an electron transport chain with an electron acceptor other than O2, for example sulfate Fermentation uses phosphorylation instead of an electron transport chain to generate ATP Copyright © 2008 Pearson Education, Inc., publishing as Pearson Benjamin Cummings

58
Animation: Fermentation Overview
Types of Fermentation Animation: Fermentation Overview 2 ADP + 2 Pi 2 ATP Fermentation consists of glycolysis plus reactions that regenerate NAD+, which can be reused by glycolysis Two common types are alcohol fermentation and lactic acid fermentation Glucose Glycolysis 2 Pyruvate 2 NAD+ 2 NADH 2 CO2 + 2 H+ In alcohol fermentation, pyruvate is converted to ethanol in two steps, with the first releasing CO2 Alcohol fermentation by yeast is used in brewing, winemaking, and baking 2 Ethanol 2 Acetaldehyde (a) Alcohol fermentation 2 ADP + 2 Pi 2 ATP In lactic acid fermentation, pyruvate is reduced to NADH, forming lactate as an end product, with no release of CO2 Lactic acid fermentation by some fungi and bacteria is used to make cheese and yogurt Human muscle cells use lactic acid fermentation to generate ATP when O2 is scarce Figure 9.18 Fermentation Glucose Glycolysis 2 NAD+ 2 NADH + 2 H+ 2 Pyruvate 2 Lactate (b) Lactic acid fermentation
 Alcohol fermentation. 2 ADP + 2. Pi. 2 ATP. In lactic acid fermentation, pyruvate is reduced to NADH, forming lactate as an end product, with no release of CO2. Lactic acid fermentation by some fungi and bacteria is used to make cheese and yogurt. Human muscle cells use lactic acid fermentation to generate ATP when O2 is scarce. Figure 9.18 Fermentation. Glucose. Glycolysis. 2 NAD+ 2 NADH. + 2 H+ 2 Pyruvate. 2 Lactate. (b) Lactic acid fermentation.")
59
Fermentation and Aerobic Respiration Compared
C6H12O6 Both processes use glycolysis to oxidize glucose and other organic fuels to pyruvate The processes have different final electron acceptors: an organic molecule (such as pyruvate or acetaldehyde) in fermentation and O2 in cellular respiration Cellular respiration produces 38 ATP per glucose molecule; fermentation produces 2 ATP per glucose molecule 2 2 2 Figure 9.18 Fermentation 4 2 Oxidative Phosphorylation 6 36 6
 in fermentation and O2 in cellular respiration. Cellular respiration produces 38 ATP per glucose molecule; fermentation produces 2 ATP per glucose molecule Figure 9.18 Fermentation Oxidative Phosphorylation")
60
Obligate anaerobes carry out fermentation or anaerobic respiration and cannot survive in the presence of O2 Yeast and many bacteria are facultative anaerobes, meaning that they can survive using either fermentation or cellular respiration In a facultative anaerobe, pyruvate is a fork in the metabolic road that leads to two alternative catabolic routes Copyright © 2008 Pearson Education, Inc., publishing as Pearson Benjamin Cummings

61
Ethanol or lactate Citric acid cycle
Fig. 9-19 Glucose Glycolysis CYTOSOL Pyruvate O2 present: Aerobic cellular respiration No O2 present: Fermentation MITOCHONDRION Ethanol or lactate Acetyl CoA Figure 9.19 Pyruvate as a key juncture in catabolism Citric acid cycle

62
The Evolutionary Significance of Glycolysis
Glycolysis occurs in nearly all organisms Glycolysis probably evolved in ancient prokaryotes before there was oxygen in the atmosphere Copyright © 2008 Pearson Education, Inc., publishing as Pearson Benjamin Cummings

63
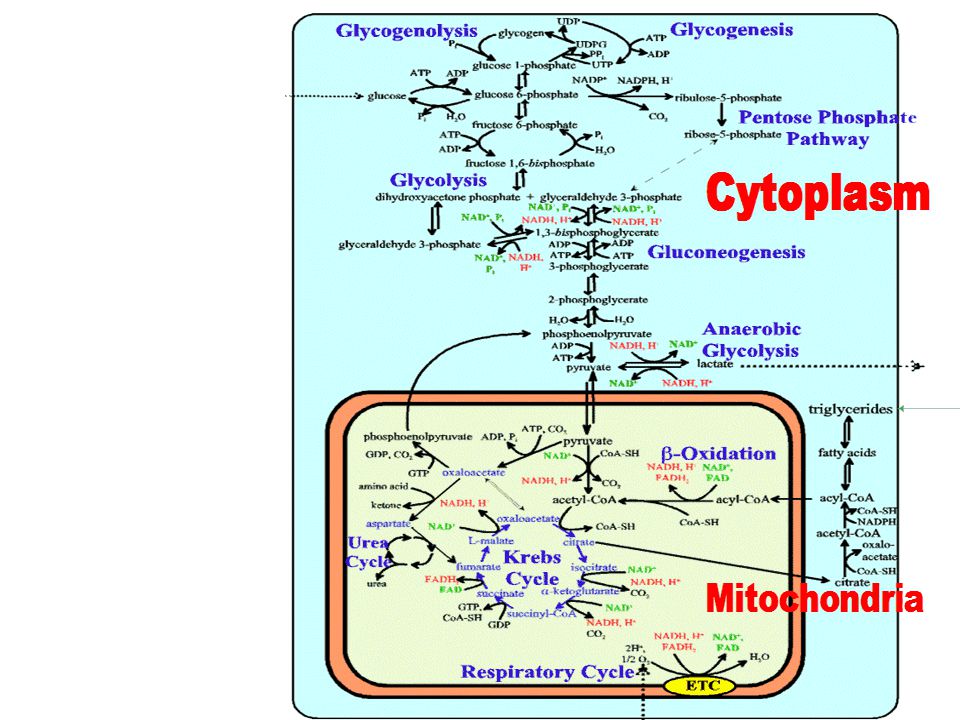
Concept 9.6: Glycolysis and the citric acid cycle connect to many other metabolic pathways
Gycolysis and the citric acid cycle are major intersections to various catabolic and anabolic pathways Although carbohydrates, fats, and proteins are all consumed as fuel, it is helpful to trace cellular respiration with the sugar glucose: Copyright © 2008 Pearson Education, Inc., publishing as Pearson Benjamin Cummings

64
The Versatility of Catabolism
Proteins Carbohydrates Fats Catabolic pathways funnel electrons from many kinds of organic molecules into cellular respiration Glycolysis accepts a wide range of carbohydrates Proteins must be digested to amino acids; amino groups can feed glycolysis or the citric acid cycle Amino acids Sugars Glycerol Fatty acids Glycolysis Glucose Glyceraldehyde-3- P NH3 Pyruvate Fats are digested to glycerol (used in glycolysis) and fatty acids (used in generating acetyl CoA) Fatty acids are broken down by beta oxidation and yield acetyl CoA An oxidized gram of fat produces more than twice as much ATP as an oxidized gram of carbohydrate Acetyl CoA Citric acid cycle Oxidative phosphorylation
 and fatty acids (used in generating acetyl CoA) Fatty acids are broken down by beta oxidation and yield acetyl CoA. An oxidized gram of fat produces more than twice as much ATP as an oxidized gram of carbohydrate. Acetyl CoA. Citric. acid. cycle. Oxidative. phosphorylation.")
65
Biosynthesis (Anabolic Pathways)
The body uses small molecules to build other substances These small molecules may come directly from food, from glycolysis, or from the citric acid cycle Copyright © 2008 Pearson Education, Inc., publishing as Pearson Benjamin Cummings

66
Regulation of Cellular Respiration via Feedback Mechanisms
Glucose AMP Glycolysis Fructose-6-phosphate Stimulates + Feedback inhibition is the most common mechanism for control If ATP concentration begins to drop, respiration speeds up; when there is plenty of ATP, respiration slows down Control of catabolism is based mainly on regulating the activity of enzymes at strategic points in the catabolic pathway Phosphofructokinase – – Fructose-1,6-bisphosphate Inhibits Inhibits Pyruvate ATP Citrate Acetyl CoA Citric acid cycle Oxidative phosphorylation

67
Fig. 9-UN5 Inputs Outputs 2 ATP Glycolysis + 2 NADH Glucose 2 Pyruvate

68
Inputs Outputs S—CoA 2 ATP C O CH3 2 Acetyl CoA 6 NADH O C COO
Fig. 9-UN6 Inputs Outputs S—CoA 2 ATP C O CH3 2 Acetyl CoA 6 NADH O C COO Citric acid cycle CH2 2 FADH2 COO 2 Oxaloacetate

69
INTER- MEMBRANE SPACE H+ ATP synthase ADP + P ATP MITO- CHONDRIAL
Fig. 9-UN7 INTER- MEMBRANE SPACE H+ ATP synthase ADP + P ATP i MITO- CHONDRIAL MATRIX H+

70
Fig. 9-UN8 across membrane pH difference Time

71
Fig. 9-UN9

73
You should now be able to:
Explain in general terms how redox reactions are involved in energy exchanges Name the three stages of cellular respiration; for each, state the region of the eukaryotic cell where it occurs and the products that result In general terms, explain the role of the electron transport chain in cellular respiration Copyright © 2008 Pearson Education, Inc., publishing as Pearson Benjamin Cummings

74
Distinguish between fermentation and anaerobic respiration
Explain where and how the respiratory electron transport chain creates a proton gradient Distinguish between fermentation and anaerobic respiration Distinguish between obligate and facultative anaerobes Copyright © 2008 Pearson Education, Inc., publishing as Pearson Benjamin Cummings

Similar presentations