Download presentation
Presentation is loading. Please wait.

1
Correlations & Causes

2
The Paper

3
What do numbers mean? Rubric is new Probably exaggerates at high and low end Course is new Standards-based assessment

4
Causal structure

5
Causation Much of science is concerned with discovering the causal structure of the world. We want to understand what causes what so we can predict, explain, and control the events around us.

6
Prediction For example, if we know that rain is caused by cool, dry air meeting warm, wet air then we can predict when and where it will rain, by tracking air currents, temperature, and moisture.

7
Prediction This is important because rain affects our ability to engage in everyday activities, like traveling or exercising. Knowledge of causation lets us make predictions, which helps us make plans

8
Explanation One way to explain something is to determine what causes it. For example, if you find out that a certain virus causes a disease among bears, then you have explained why the animals are getting sick.

9
Explanation This is important because once you know an explanation for a disease (what causes it), you can begin treating it– for example, with antiviral drugs.
, you can begin treating it– for example, with antiviral drugs.")
10
Control Finally, if we know what causes some effect, then we can control nature to our advantage. For example, if you don’t know what causes diamonds, you have to look through mines to find some.

11
Control But when we know that diamonds are caused by carbon under high pressure, high temperature conditions, we can simply re- create those conditions to grow as many diamonds as we want.

12
So the question arises: how does science discover the causal structure of the world?

13
Causation & Correlation

14
Independence In statistics, we say that two variables are independent when the value of one variable is completely unrelated to the other: P(A/ B) = P(A) P(B/ A) = P(B) B happening does not make A any more likely to happen. (If that’s true, so is the reverse.)
.")
15
Correlation Two variables A, B that are not independent are said to be correlated. A and B are positively correlated when P(A/ B) > P(A). If B happens, A is more likely to happen. A and B are negatively correlated when P(A/ B) < P(A). If B happens, A is less likely to happen.
 > P(A). If B happens, A is more likely to happen. A and B are negatively correlated when P(A/ B) < P(A). If B happens, A is less likely to happen..")
16
Causation and Correlation One thing that can lead two variables A and B to be correlated is when A causes B. For example, if having a cold causes a runny nose, then having a cold is correlated with having a runny nose: P(cold/ runny nose) > P(cold)
 > P(cold).")
17
Causation and Correlation Similarly, the number of cars on the road is correlated with the number of accidents: if there is an increase in the number of people driving, there will be an increase in the number of car accidents. This is because a larger number of cars causes a larger number of accidents.

18
Causation ≠ Correlation But causation does not imply correlation. If A and B are correlated there are several possibilities: A causes B B causes A C causes A and C causes B A and B are only accidentally correlated

19
Newspaper Reporting Newspapers frequently present observed correlations in a misleading way– a way that makes it seem as though scientists have discovered a causal relation.

20
Chocolate and Nobel Prizes In the article, “Eat more chocolate, win more Nobels?” Dr. Franz Messerli claims to have found “a surprisingly powerful correlation” between the chocolate consumption in a country and the Nobel rate.

21
Chocolate and Flavanols The theory outlined in the article is that chocolate contains flavanols; flavanols slow down age-related mental decline (though this is doubtful); and…? Well, it’s not really explained how lessened mental decline makes you more likely to win Nobels. Wouldn’t chocolate have to make you smarter and not just prevent you from being dumber?

22
B causes A Dr. Messerli, according to the article, admits that “it’s possible… that chocolate isn't making people smart, but that smart people who are more likely to win Nobels are aware of chocolate's benefits and therefore more likely to consume it.”

23
C causes A and B The article also quotes Sven Lidin, the chairman of the Nobel chemistry prize committee: “I don't think there is any direct cause and effect. The first thing I'd want to know is how chocolate consumption correlates to gross domestic product.” He seems to be suggesting that GDP causes higher chocolate consumption and more Nobel prizes.

24
The GDP Theory Chocolate is a luxury. Wealthy individuals are more likely to be able to afford it. Education is also a luxury. Poor people can’t afford to go to college for 10 years to get a PhD in chemistry. But you can’t win the Nobel prize in chemistry unless you’re a chemist.

25
The GDP Theory So we expect that the GDP or “wealth” of a country will be correlated both with chocolate eating and with Nobel prizes. Wealth causes chocolate eating & wealth causes Nobels.

26
Spurious Correlation It’s also possible that Dr. Messerli has committed the ecological fallacy, assuming that a correlation between a country’s chocolate consumption and that country’s number of Nobel prizes means that there is a correlation between individual chocolate consumption and individual Nobel-prize winning.

27
Ecological Fallacy Explanation Maybe smart people tend to avoid chocolate, because they know it can cause obesity. When they live in a country that consumes lots of chocolate they have to exercise their will power frequently. And maybe smart people + strong willpower = more Nobels. So it’s not eating chocolate but avoiding chocolate that causes Nobel prizes.

28
Correlation

29
Observation

30
Types of Scientific Studies There are two basic types of scientific studies (the stuff that gets published in scientific journals and reported in the “science” section of the newspaper): Observational studies Controlled experiments
: Observational studies Controlled experiments")
31
Observational Studies An observational study looks at data in order to determine whether two variables are correlated.

32
Case Study In science, we want to know about the effects of something (exposure to radiation, living through a certain political crisis…) or the causes of something (a disease, having certain beliefs…). A case study finds people who have the condition we want to know about (they were exposed to radiation, or they have the disease) and looks back at their histories.
 and looks back at their histories..")
33
Example Suppose I want to know why people gamble. I might find a group of gamblers and give them all a survey: When did you first have sex? Do you smoke? Did your parents divorce? When you win money, how do you spend it? Do you eat meat?

34
Problems with Case Studies Suppose I find that 27% of the gamblers I survey have divorced parents. Does that mean divorce is significant cause of gambling? No. We need to know if this is more or less than the divorce rate among non-gamblers. (In fact, it’s about the same: HK divorce rate is 20%-30%.)
.")
35
Case Control Study

36
In a case control study we find not just a group of people we’re interested in (gamblers) but also a group of people we’re not interested in (the control group, non-gamblers). The goal is to compare the histories of one group to the histories of the other group.

37
Problems with Case Control Studies Correlation is not causation! What if I discover that more gamblers smoke than non-gamblers. I still don’t know: Maybe smoking causes gambling. Maybe gambling causes smoking. Maybe poverty causes gambling & smoking. Maybe it’s just a coincidence.

38
Unreliable Histories

39
Why Do We Do Them? Case control studies can be done very easily, very fast, and with very little expense. Scientists will use them to suggest things to study more seriously, or to rule out certain hypotheses. After all, if gamblers smoke less than non- gamblers, smoking probably does not cause gambling!

40
Cohort Studies

41
Cohort studies are more reliable than case control studies. In a cohort study, you follow two groups over time. One group, the cohort, has a certain condition (for example, smokes) and the other group doesn’t. Then you see what happens and compare the results.
 and the other group doesn’t. Then you see what happens and compare the results..")
42
Cohort Studies For example, an cohort study might ask women to record how much wine they drink, and also to report if they develop breast cancer. After many years, a correlation may be found between wine consumption and cancer.

43
Advantages over Case Control Avoids recall bias. Lets us study changes over time. Useful for studying rare conditions. Lets us investigate many effects. Allows us to calculate the relative risk (the amount that a condition increases or decreases your risk of something.)
.")
44
Problems: Confounding Variables Suppose my cohort is a group of smokers. Smokers tend to have more in common with one another than just smoking: The poor smoke more than the rich. The uneducated smoke more than the educated. People who drink alcohol smoke more than people who do not.

45
Problems: Confounding Variables Anything that we discover in the cohort that is correlated with smoking will also be correlated with all the confounding variables! So if smokers get more cancer, is it because they smoke, or because they don’t have money to go to a hospital for checkups?

46
Observational Studies Importantly, observational studies can only show whether two variables A and B are correlated. They cannot show whether A causes B, or B causes A, or some third cause causes both, or if the correlation is accidental.

47
Randomized Controlled Trials

48
Controlled Experiments Suppose I believe that eating chocolate makes you smarter. Maybe I have some evidence, in the form of observational studies that show a correlation between chocolate consumption in a country and the number of Nobel prizes won by that country.

49
But there are alternative theories: Smartness causes chocolate eating Wealth causes smartness and chocolate eating Chocolate avoiding causes smartness Etc.

50
Experimental Design I can rule out these possibilities with a well-designed experiment. What I want is two groups: one group (the experimental group) that eats chocolate because I tell them to, and another group (the control group) that does not eat chocolate, because I tell them not to.
 that eats chocolate because I tell them to, and another group (the control group) that does not eat chocolate, because I tell them not to..")
51
RCT

52
Not: B causes A If the experimental group improves in intelligence over the course of the experiment, I know that this is not because higher intelligence leads to more chocolate consumption (even if that is true). In my experiment, intelligence does not cause chocolate consumption, I do. I am the experimenter and I say who eats chocolate.

53
Controlling for Additionally, if I make sure to put equal numbers of rich people in both groups, and equal numbers of middle-class people, and equal numbers of poor people, then I can make sure that improvements in the experimental group are not due to wealth: both groups have the same distribution of wealthy and non-wealthy people. This is called controlling for wealth.

55
Randomization Ideally, an experiment controls for as many variables as possible. To a large extent, this is done by randomly assigning individuals in the study to either the control group or the experimental group. This way, the members of the group are less likely to share features other than chocolate eating.

56
Benefits of Randomization Proper randomization: Minimizes experimenter bias– the experimenter can’t bias who goes into which group. Minimizes allocation bias– lowers the chance that the control group and experimental group differ in important ways.

57
Selection Bias Randomization cannot get rid of all selection bias. For example, many psychology experiments are just performed on American undergraduates by their professors. This means both groups over-represent young Westerners. (“Sampling bias”)
.")
58
Evaluating Results

59
Are We Finished? A well-designed randomized controlled trial has the ability to rule out alternative causal explanations. But suppose it does find a positive correlation between A and B, and rules out B causes A and common cause explanations for this correlation. Has it shown that A causes B?

60
Statistical Significance We say that an experimental correlation is statistically significant if it’s unlikely to be accidental. How can we tell when it’s unlikely to be accidental?

61
Null Hypothesis We give a name to the claim that there is no causal connection between the variables being studied. It is called the null hypothesis. Our goal is to reject the null hypothesis when it is false, and to accept it when it is true.

63
Rejecting the Null Hypothesis All experimental data is consistent with the null hypothesis. Any correlation can always be due entirely to chance. But sometimes the null hypothesis doesn’t fit the data very well. When the null hypothesis suggests that our actual observations are very unlikely, we reject the null hypothesis.

64
P-Values One way to characterize the significance of an observed correlation is with a p-value. The p-value is the probability that we would observe our data on the assumption that the null hypothesis is true. p = Pr(observations/ null hypothesis = true)
.")
65
P-Values Obviously lower p-values are better, that means your observed correlation is more likely to be true. In science we have an arbitrary cut-off point, 5%. We say that an experimental result with p <.05 is statistically significant.

66
Statistical Significance What does p <.05 mean? It means that the probability that our experimental results would happen if the null hypothesis is true is less than 5%. According to the null hypothesis, there is less than a 1 in 20 chance that we would obtain these results.

67
Note Importantly, p-values are not measures of how likely the null hypothesis is, given the data. They are measures of how likely the data is, given the null hypothesis. p = Pr(data/ null hypothesis = true) ≠ Pr(null hypothesis = true/ data)
 ≠ Pr(null hypothesis = true/ data).")
68
Importance Just because the results of an experiment (or observational study) are “statistically significant” does not mean the revealed correlations are important. The effect size also matters.

70
Effect Size One NAEP analysis of 100,000 American students found that science test scores for men were higher than the test scores for women, and this effect was statistically significant These results are unlikely if the null hypothesis, that gender plays no role in science scores, were true.

71
Effect Size However, the average difference between men and women on the test was just 4 points out of 300, or 1.3% of the total score. Yes, there was a real (statistically significant) difference. It was just a very, very small difference.
 difference. It was just a very, very small difference..")
72
Effect Size One way to put the point might be: “p-values tell you when to reject the null hypothesis. But they do not tell you when to care about the results.”

73
Relative Risk The easiest-to-understand method of reporting effect sizes is as a relative risk. This is how much the experimental intervention increases the probability of the experimental outcome: Pr(cure/ treatment) ÷ Pr(cure/ control group)
 ÷ Pr(cure/ control group).")
74
Relative Risk Example Suppose the probability of getting an A on a math test after eating a chocolate bar is 20%. Suppose the probability of getting an A is only 15% if you don’t eat a chocolate bar. Then eating chocolate makes you 20% ÷ 15% = 1⅓ times as likely to get an A. It increases the probability by ⅓.

75
Most Published Research is False

76
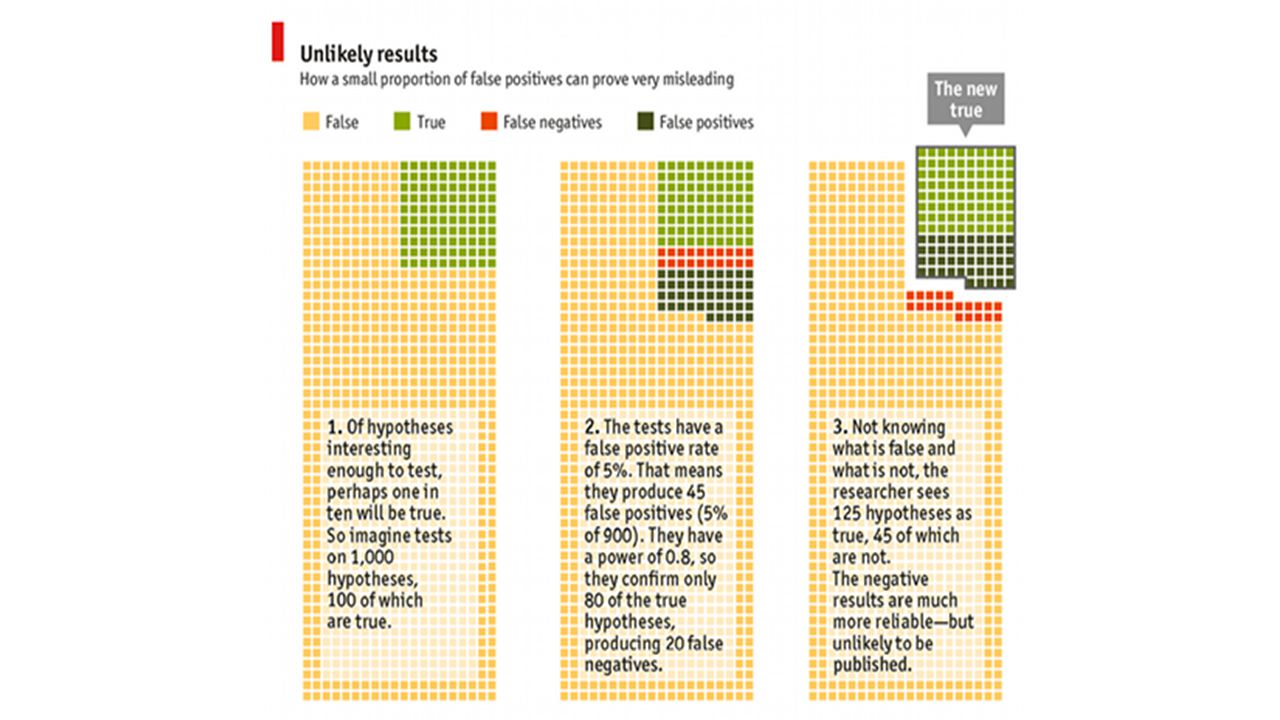
Classic Article In a classic article titled “Why Most Published Research is False,” John Ioannidis found: “Simulations show that for most study designs and settings, it is more likely for a research claim to be false than true.”

78
False Positives Why do we get 5% false positives? In science we require p <.05. If the null hypothesis is true, we would obtain these results only 1 in 20 times, or 5%. So 5% of our results involve accidental correlations. Repeating the experiment is unlikely to result in the same accident.

79
Base Rate Fallacy Essentially, scientific practice commits the base rate neglect fallacy. We want to know Pr(null hypothesis = true/ data). p-values are a measure of the likelihood: Pr(data/ null hypothesis = true). But what we want to know is proportional to the likelihood times the base rate of true null hypotheses.
. p-values are a measure of the likelihood: Pr(data/ null hypothesis = true). But what we want to know is proportional to the likelihood times the base rate of true null hypotheses..")
80
Solving the Problem Remember that p =.05 is the maximum p-value that scientific journals will accept. There’s no reason you can’t have p =.01 (one percent false positives) or p =.001 (one in 1000 false positives). How do you do that?
 or p =.001 (one in 1000 false positives). How do you do that .")
81
Lowering the p-Values Run more experiments on same variables (replication) Run bigger experiments Increase experiment size Analyze data from all prior experiments (meta-analysis) Additionally, we can use basic science to estimate prior probabilities. If basic science hasn’t found a physical basis for Qi, for instance, that’s a reason to lower our degree of belief in positive acupuncture studies.

Similar presentations


>")


