Download presentation
Presentation is loading. Please wait.

1
Anthropometry Dr.Nishan Silva (MBBS)
")
2
Anthropometry Nutritional care Body mass index Basal metabolic rate Recommended Daily allowances Physical Measurements Energy expenditure

3
The Nutrition Care Process Identifying and meeting a person’s nutrient and nutrition education needs. Five steps: 1. Assess Assessment of nutritional status 2. Analyze Analyze assessment data to determine nutrient requirements 3. Develop Develop a nutrition care plan to meet patient’s nutrient and education needs. 4. Implement: Implement care plan 5. Evaluate: Evaluate effectiveness of care plan: ongoing follow-up, reassessment, and modification of care plan.

4
Assessing Nutritional Status Historical Information Physical Examination Anthropometric Data Laboratory Analyses

5
CLINICAL ASSESSMENT Good nutritional history should be obtained General clinical examination, with special attention to organs like hair, angles of the mouth, gums, nails, skin, eyes, tongue, muscles, bones, & thyroid gland. Detection of relevant signs helps in establishing the nutritional diagnosis

6
Anthropometric Data – physical measurement of the body anthropos = humanmetric = measure Indirect assessment of body composition and development Used in Nutrition Assessment: –Measures using height and weight –Measures of body composition (fat vs. lean tissue) –Functional Measures
 –Functional Measures.")
7
W/A: combined measurement: –NO individual diagnosis but trend assessment –For growth monitoring and FU W/H indicates degree of wasting –Individual diagnosis –Community diagnosis –Sensitive to change H/A indicates linear growth retardation –not sensitive to change –slow progress –Community diagnosis Indices

8
Body Mass Index

9
Nutritional Indices in Adults The international standard for assessing body size in adults is the body mass index (BMI). BMI is computed using the following formula: BMI = Weight (kg)/ Height (m ² ) Evidence shows that high BMI (obesity level) is associated with type 2 diabetes & high risk of cardiovascular morbidity & mortality
/ Height (m ² ) Evidence shows that high BMI (obesity level) is associated with type 2 diabetes & high risk of cardiovascular morbidity & mortality.")
10
Measures Using Height and Weight BMI Body Mass Index wt (kg) ht (m) 2 or wt (lb) X 705 ht (inches) 2
 ht (m) 2 or wt (lb) X 705 ht (inches) 2")
11
International classification of BMI

12
Measurements

13
Example Height – 1.96 m (6 ft 5 in) Weight – 125 kg (276 lb; 9 st 10 lb) BMI – 32.55 kg/m 2
 Weight – 125 kg (276 lb; 9 st 10 lb) BMI – kg/m 2")
14
Still … BMI – 32.55 kg/m2

15
Run 100m in 10.8 s!!!!

16
Measures Using Height and Weight Cons: BMI can misclassify up to one out of four people. –Does not account for fat distribution –Doesn’t account for LBM - may misclassify frail/sedentary or very muscular people

17
Other anthropometric Measurements Mid-arm circumference Skin fold thickness Head circumference Hip/waist ratio Head/chest ratio

18
Measuring weight - Video

19
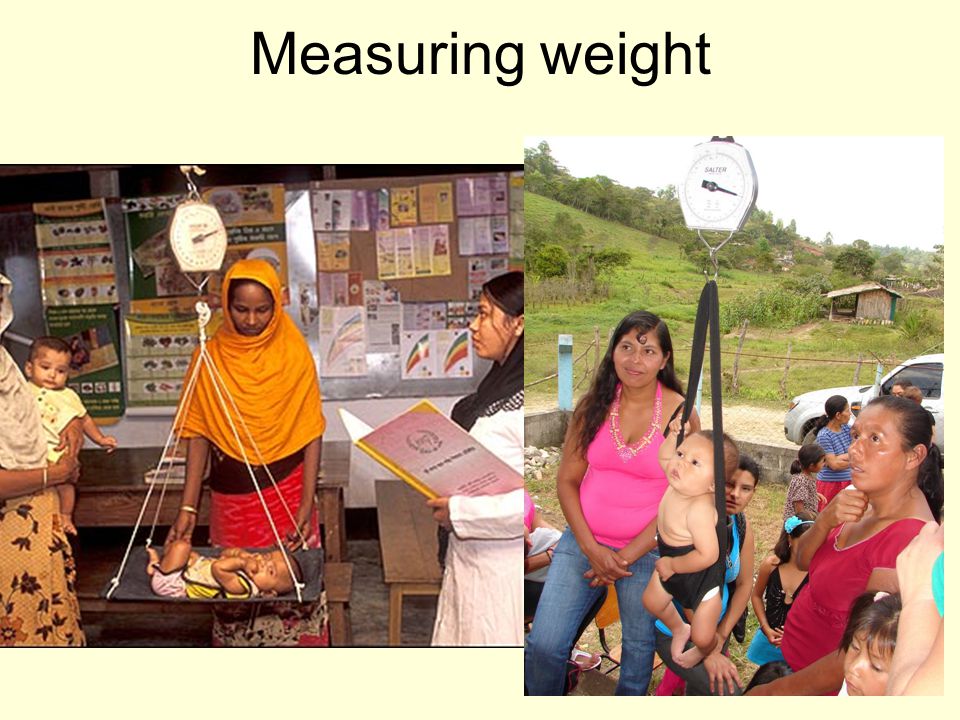
Measuring weight

21
Measuring Height - video

22
Stadiometer Infantometer

23
Measuring Length - video

24
Circumferences - video

25
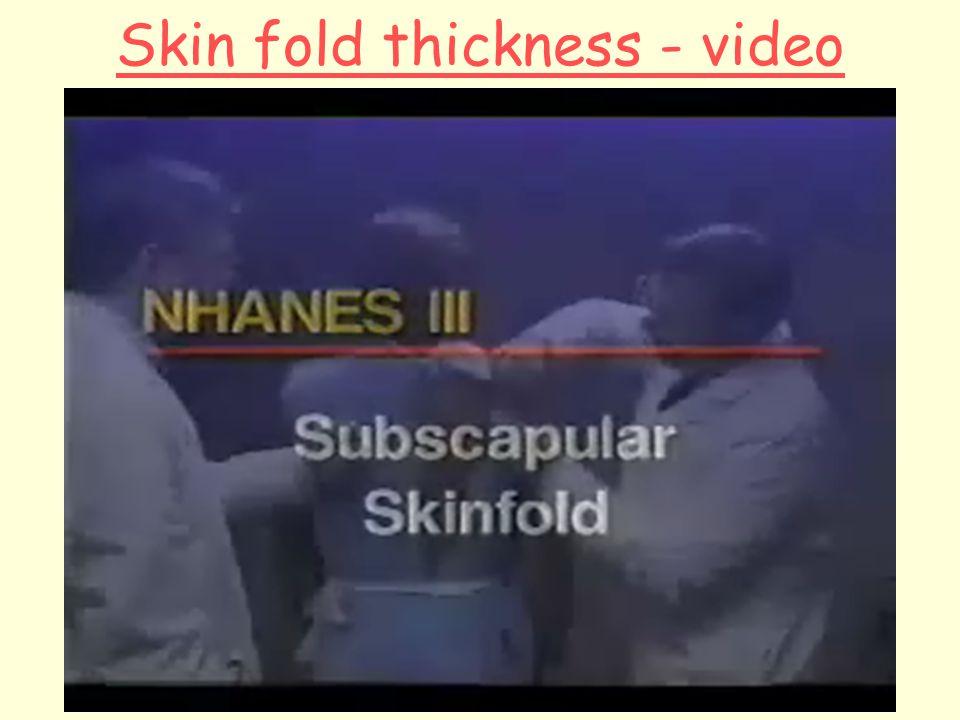
Skin fold thickness - video

27
Growth percentile charts

28
Growth charts What is normal growth? When can you call it abnormal? When does it tends to change? Drawbacks?

29
ADVANTAGES OF ANTHROPOMETRY Objective with high specificity & sensitivity Measures many variables of nutritional significance (Ht, Wt, MAC, HC, skin fold thickness, waist & hip ratio & BMI). Readings are numerical & gradable on standard growth charts Readings are reproducible. Non-expensive & need minimal training

30
Limitations of Anthropometry Inter-observers errors in measurement Limited nutritional diagnosis Problems with reference standards, i.e. local versus international standards. Arbitrary statistical cut-off levels for what considered as abnormal values.

31
Energy Expenditure Humans oxidise (metabolise) carbohydrate, protein, fat (and alcohol) to produce Energy.
 carbohydrate, protein, fat (and alcohol) to produce Energy.")
32
Energy is used to…. To maintain body functions - to breathe, to keep the heart beating, to keep the body warm and all the other functions that keep the body alive. For physical activity - for active movement - muscle contraction. For growth and repair, which require new tissues to be made

33
Measurement… Energy can be measured in either joules or calories 1 kcal = 4.184 kj The average daily energy intake in the UK is 10250kJ (2450 kcal) for men and 7030kJ (1680 kcal) for women. The energy in the diet is provided by carbohydrate,protein, fat and alcohol.

34
A gram of….. carbohydrate (starch or sugar) provides 16kJ (3.75 kcal) protein provides 17kJ (4 kcal) fat provides 37kJ (9 kcal) alcohol provides 29kJ (7 kcal)
 provides 16kJ (3.75 kcal) protein provides 17kJ (4 kcal) fat provides 37kJ (9 kcal) alcohol provides 29kJ (7 kcal).")
35
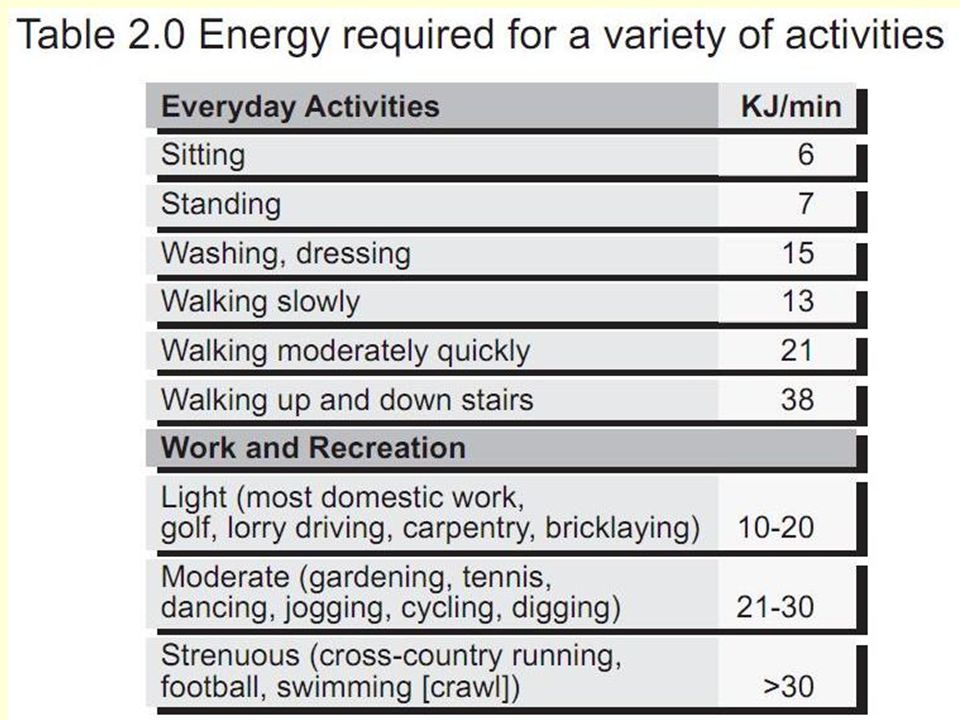
Energy Expenditure… The energy expenditure (EE) of a man or woman over a whole day is often divided into different components, which can be individually determined. These are: Basal metabolic rate (BMR), Diet induced Thermogenesis (DIT), Physical activity (PA)
, Diet induced Thermogenesis (DIT), Physical activity (PA).")
37
Calculating total energy expenditure

38
Basal Metabolic Rate (BMR) is the amount of daily energy expended by humans (and other animals) at rest.energy Rest is defined as existing in a neutrally temperate environment while in the post-absorptive state.temperateabsorptive state
 is the amount of daily energy expended by humans (and other animals) at rest.energy Rest is defined as existing in a neutrally temperate environment while in the post-absorptive state.temperateabsorptive state")
39
BMR Basal metabolism is usually by far the largest component of total caloric expenditure. Basal metabolic rate is usually expressed in terms of daily rates of energy expenditure. (kcal/day) The primary organ responsible for regulating metabolism is the hypothalamus.hypothalamus The basal metabolic rate varies between individuals.
 The primary organ responsible for regulating metabolism is the hypothalamus.hypothalamus The basal metabolic rate varies between individuals..")
40
Energy Expenditure at Rest Basal Metabolic Rate –BMR is rate of energy expenditure fasted, rested and supine conditions in thermoneutral environment –Resting metabolic rate (RMR) is rate of energy expenditure when at rest but not basal –BMR proportional to BSA, after age 20 reduces 2% & 3% per decade in women and men, respectively
 is rate of energy expenditure when at rest but not basal –BMR proportional to BSA, after age 20 reduces 2% & 3% per decade in women and men, respectively")
41
Factors effecting BMR Regular exercise – Keeps BMR elevated at rest Muscle mass – More muscles – more BMR Diet – Severe calorie restriction reduces BMR Food type – Proteins increase BMR

42
Factors effecting BMR Hormones – Thyroxine Stress – Increases BMR Age – Reduces BMR Gender – Males higher Body temperature – Elevates BMR ? What happens to BMR in an infection / inflammation?

43
Dietary reference intakes (DRI) Recommended Dietary Allowance (RDA) Adequate Intake (AI) Tolerable Upper Intake Level (UL) Estimated Average Requirement (EAR)
 Recommended Dietary Allowance (RDA) Adequate Intake (AI) Tolerable Upper Intake Level (UL) Estimated Average Requirement (EAR)")
44
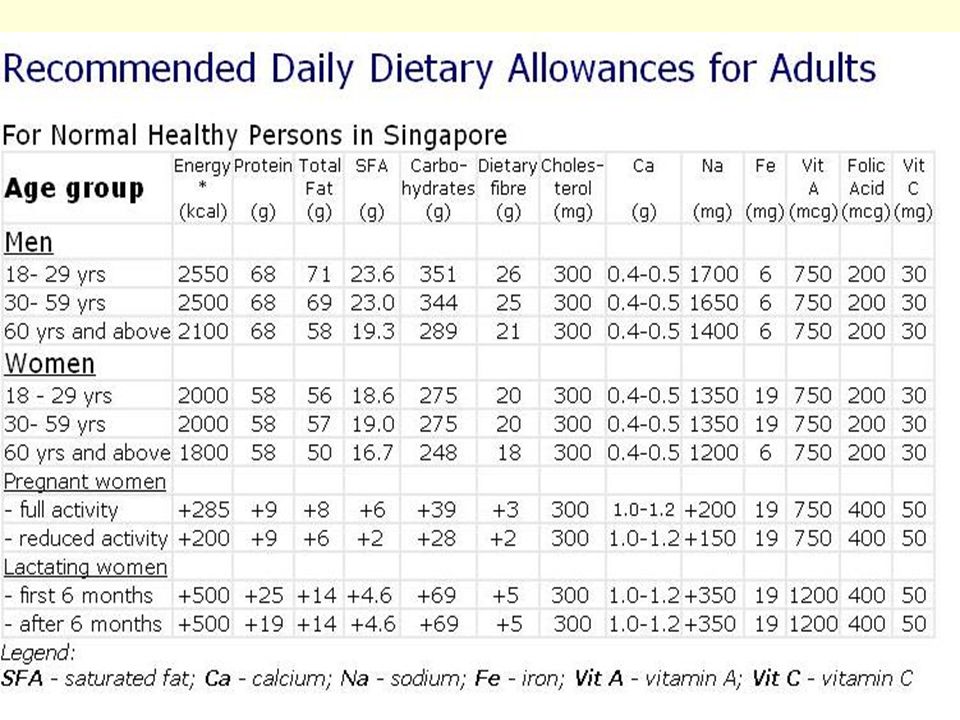
Recommended Daily Allowances

45
Recommended Dietary Allowance (RDA) It is the average daily level of intake sufficient to meet the nutrient requirements of nearly all (97%-98%) healthy people.
 It is the average daily level of intake sufficient to meet the nutrient requirements of nearly all (97%-98%) healthy people.")
Similar presentations


, and varies with gender and age. Extra metabolic energy is consumed.>")


>")
 ◦ Amount of ____________ needed to __________ the temperature of 1 _________ of pure water by 1C ______ calories =>")
? Daily Caloric Intake is a combination of 2 factors. Basal Metabolic.>")
 Definition The amount of energy expended daily by humans at rest. METABOLISM – the rate at which the body consumes calories.>")


