Download presentation
Presentation is loading. Please wait.

1
Benford’s Very Strange Law
John D. Barrow

2
Simon Newcomb 1888:"We are probably nearing the limit of all we can know about astronomy" appeared in The American Journal of Mathematics (1881) 4, re-discovered by Benford in 1938, and he published an article called "The Law of Anomalous Numbers" in Proc. Amer. Phil. Soc 78, pp ‘Note on the Frequency of Use of the Different Digits in Natural Numbers’, 1881
 4, re-discovered by Benford in 1938, and he published an article called The Law of Anomalous Numbers in Proc. Amer. Phil. Soc 78, pp ‘Note on the Frequency of Use of the Different Digits in Natural Numbers’,")
3
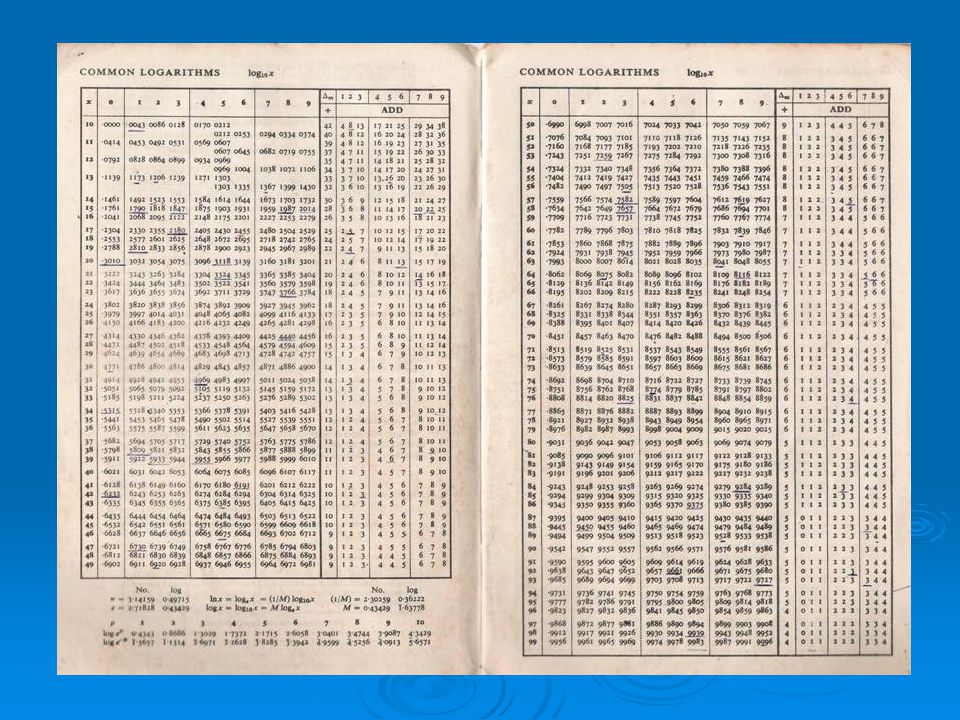
Log Tables Yield…

5
Newcomb’s ‘Law’ "That the ten digits do not occur with equal frequency must be evident to anyone making much use of logarithmic tables, and noticing how much faster the first pages wear out than the last ones. The first significant figure is oftener 1 than any other digit, and the frequency diminishes up to 9." The law of probability of the occurrence of numbers is such that all mantissae [fractional part] of their logarithms are equally probable.

6
Newcomb said this law was “evident”
Data on first digits are evenly spread on a logarithmic scale But it will not be on a linear scale. They become increasingly sparse Newcomb said this law was “evident” P(d) [log(d+1) – log(d)]/[log(10) – log(1)] = log(1 + 1/d)
 [log(d+1) – log(d)]/[log(10) – log(1)] = log(1 + 1/d)")
7
Probability of the First Digit Being Equal to d
P(d)= log10[1 + 1/d], d = 1, 2,.. Ignore signs and take first digit after decimal point eg for it is 1
= log10[1 + 1/d], d = 1, 2,.. Ignore signs and take first digit after decimal point eg for it is 1.")
8
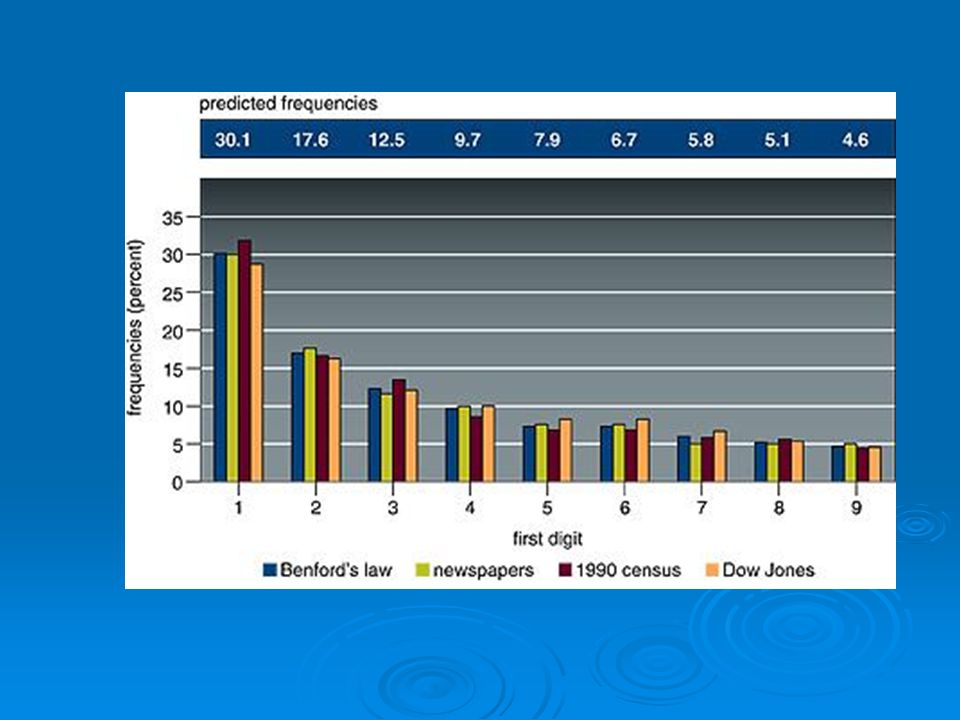
A Big Surprise P(1) = 0.30 P(2) = 0.18 P(3) = 0.12 P(4) = 0.10
You might have thought P(1) = P(2) = P(3) = ….P(9) = But… P(1) = 0.30 P(2) = 0.18 P(3) = 0.12 P(4) = 0.10 P(5) = 0.08 P(6) = 0.07 P(7) = 0.06 P(8) = 0.05 P(9) = 0.05
 = P(2) = P(3) = ….P(9) = But… P(1) = P(2) = P(3) = P(4) = P(5) = P(6) = P(7) = P(8) = P(9) =")
9
P(d)= log10[1 + 1/d] first-digit distribution
Rediscovered by Frank Benford at GEC in 1938 P(d)= log10[1 + 1/d] first-digit distribution then becomes known as “Benford’s Law” Grad U Michigan 1910 worked for general Electric from 1948 publ his law 1938 ‘The Law of Anomalous Numbers’ (1938)
![P(d)= log10[1 + 1/d] first-digit distribution](http://slideplayer.com/slide/5992568/20/images/9/P%28d%29%3D+log10%5B1+%2B+1%2Fd%5D+first-digit+distribution.jpg "Rediscovered by. Frank Benford. at GEC in P(d)= log10[1 + 1/d] first-digit distribution. then becomes known as. Benford’s Law Grad U Michigan 1910 worked for general Electric from 1948 publ his law ‘The Law of Anomalous Numbers’ (1938)")
10
Benford gathered 20,000 pieces of data and studied
First-digit frequencies Data 1 2 3 4 5 6 7 8 9 River areas 31.0% 16.4 10.7 11.3 7.2 8.6 5.5 4.2 5.1 Base ball 32.7 17.6 12.6 9.8 7,4 6.4 4.9 5.6 3.0 magazines 33.4 18.5 12.4 7.51 7.1 6.5 Powers of 2 30 17 13 10 20 tables 30.6 9.4 8.0 4.7 half -lives 29.6 17.8 1.7 10.5 9,9 4.8 5.2 BenfordLaw 30.1 12.5 9.7 7.9 6.7 5.8 4.6

11
Random street addresses

14
Picking Raffle Tickets
P(1) goes up as be go to 19 tickets, then falls
 goes up as be go to 19 tickets, then falls.")
15
Take an average over all Possible numbers of tickets
P(1) depends on the number of tickets Number of tickets P(1) Take an average over all Possible numbers of tickets The average is 30.1% Number of tickets S. Mould
 depends on the. number of tickets. Number of tickets. P(1) Take an average over all. Possible numbers of tickets. The average is 30.1% Number of tickets. S. Mould.")
16
Universal distribution P(x) for numbers with units
Means it must be scale invariant P(kx) = f(k)P(x) Since P(x)dx = 1 we must have P(kx)dx = 1/k so 1/k = P(kx)dx = f(k) P(x)dx = f(k) Means f(k) = 1/k d/dk of P(kx) = f(k)P(x) xdP(kx)/d(kx) d(kx)/dk = -P(x)/k2 Put k = 1 Means P(x) = 1/x In reality we won’t go to zero or infinity so don’t worry about 0 1/x dx being infinite
 = f(k)P(x) Since P(x)dx = 1 we must have P(kx)dx = 1/k. so 1/k = P(kx)dx = f(k) P(x)dx = f(k) Means f(k) = 1/k. d/dk of P(kx) = f(k)P(x) xdP(kx)/d(kx) d(kx)/dk = -P(x)/k2. Put k = 1. Means P(x) = 1/x. In reality we won’t go to zero or infinity so don’t worry about 0 1/x dx being infinite.")
17
Other Digits The fraction in 1.4 to 1.3 is
By the same kind of analysis we can determine the probability that the second digit will have a certain value. It's only necessary to consider a single order of magnitude, since the pattern is repeated on each order. For example, in the base 10, the probability of the second digit being "3" is equal to the sum of the probabilities of the first two digits being "1.3", "2.3", "3.3", ... or "9.3" for numbers in the range from 1 to 10. This is indicated by the shaded regions in the logarithmic scale: The fraction in 1.4 to 1.3 is Now just find the fractions in 2.2 to 2.3 etc and add all the answers together

18
Probabilities for Successive Significant Digits
P(first digit is d) = log[1 + 1/d], d = 1,2,3,…9. P(second digit is d) = 9k=1 log[1 + (10k+d)-1], d = 0,1,2…9. (Newcomb) The joint distribution of all digits can be found and they are not independent P(first = d1, …,kth = dk) = log[1 + (i=1k di 10k-i)-1] Eg for 0.314; P(3,1,4) = log[1 + (314)-1] = Unconditional probability that second digit is 1 is P(second digit =1) = 0.109, But conditional probability that it is 1 given that the first is 1 is 0.115 Dependence falls off fast as distance between digits increases Distn of the nth digit approaches a uniform distribution on 0,1,2,…,9 very fast as n , so P 1/10 for occurrence of each 0,1,2…,9 as log(1 + 1/n) 1/n
 = log[1 + 1/d], d = 1,2,3,…9. P(second digit is d) = 9k=1 log[1 + (10k+d)-1], d = 0,1,2…9. (Newcomb) The joint distribution of all digits can be found and they are not independent. P(first = d1, …,kth = dk) = log[1 + (i=1k di 10k-i)-1] Eg for 0.314; P(3,1,4) = log[1 + (314)-1] = Unconditional probability that second digit is 1 is P(second digit =1) = 0.109, But conditional probability that it is 1 given that the first is 1 is Dependence falls off fast as distance between digits increases. Distn of the nth digit approaches a uniform distribution on 0,1,2,…,9 very fast. as n , so P 1/10 for occurrence of each 0,1,2…,9 as log(1 + 1/n) 1/n.")
19
Invariances Pick Out Benford
Scale invariance – no preferred units Base invariance wrt base of arithmetic b P(d) = logb(1 + 1/d) But why should there be a distribution like this at all? Scale invar implies base invar but not vice versa
 = logb(1 + 1/d) But why should there be a distribution like this at all Scale invar implies base invar but not vice versa.")
20
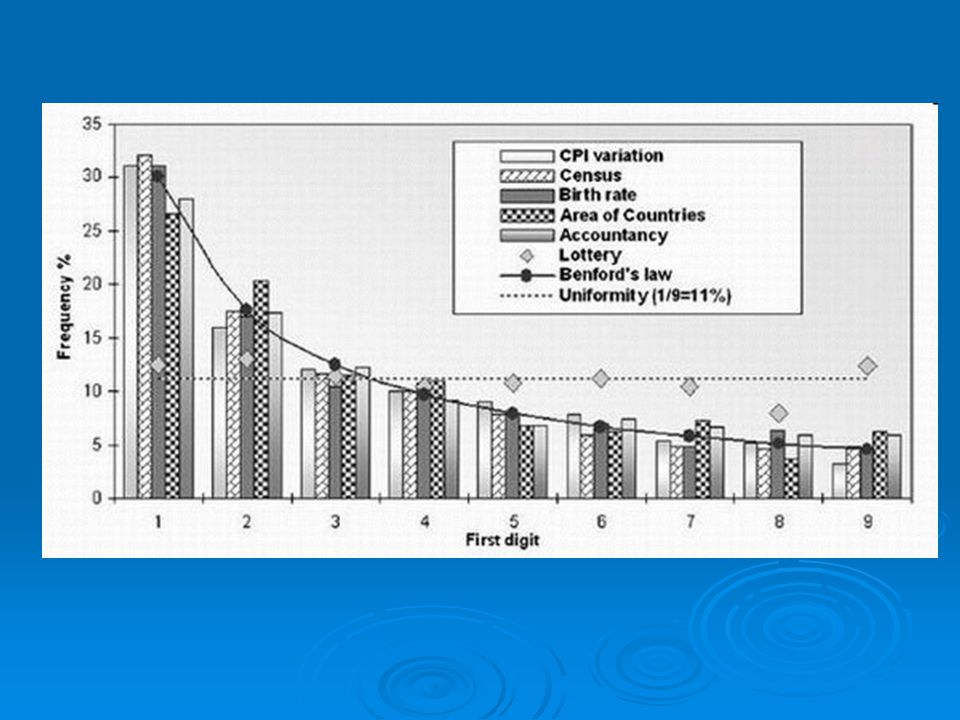
Do All First-Digit Distributions Follow Newcomb-Benford?

21
Random number generator
Figure 34-2 shows two examples of Benford's law. The histogram on the left is for 14,414 numbers taken from the income tax returns of U.S. corporations. The pattern here is obvious and very repeatable. The leading digit in these numbers is a 1 about 30.1% of the time, a 2 about 17.6% of the time, and so on. Mathematicians immediately recognize that these values correspond to the spacing on the logarithmic number line. That is, the distance between 1 and 2 on the log scale is log(2) - log(1) = The distance between 2 and 3 is log(3) - log(2) = 0.176, and so on. Benford showed us that this logarithmic pattern of leading digits is extremely common in nature and human activities. In fact, even the physical constants of the universe follow this pattern– just look at the tables in a physics textbook. US tax return data Random number generator
 - log(1) = The distance between 2 and 3 is log(3) - log(2) = 0.176, and so on. Benford showed us that this logarithmic pattern of leading digits is extremely common in nature and human activities. In fact, even the physical constants of the universe follow this pattern– just look at the tables in a physics textbook. US tax return data. Random number generator.")
22
Not Everything Follows Benford
Continued fraction digits are mostly 1’s in general but they are not Benford-Newcomb-like a = k + x = integer + fractional part For almost all real numbers: P(k) = ln[1 + 1/k(k + 2)]/ln[2] P(1) = 0.41, P(2) = 0.17, P(3) = 0.09, P(4) = 0.06, P(5) = 0.04 Steeper than Benford: P(k) 1/k2 as k ln(1+x) x
 = ln[1 + 1/k(k + 2)]/ln[2] P(1) = 0.41, P(2) = 0.17, P(3) = 0.09, P(4) = 0.06, P(5) = Steeper than Benford: P(k) 1/k2 as k ln(1+x) x.")
23
First digits are Benford-Newcomb distributed so long as
Data measure same phenomena (eg all prices or areas) There is no built in max or min values The numbers are not assigned (like phone nos) The underlying distribution is fairly smooth More observations of small items than large ones Data spans several whole numbers on the log scale: * The distribution must be broad rather than narrow * Red area is relative Prob first digit is 1 Ratios of areas proportional to widths Eg incomes. populns Blue area is relative Prob first digit is 8 Consider the probability distributions shown below, plotted on a log scale.[12] In each case, the total area in red is the relative probability that the first digit is 1, and the total area in blue is the relative probability that the first digit is 8. For the left distribution, the size of the areas of red and blue are approximately proportional to the widths of each red and blue bar. Therefore the numbers drawn from this distribution will approximately follow Benford's law. On the other hand, for the right distribution, the ratio of the areas of red and blue is very different from the ratio of the widths of each red and blue bar. Rather, the relative areas of red and blue are determined more by the height of the bars than the widths. The heights, unlike the widths, do not satisfy the universal relationship of Benford's law; instead, they are determined entirely by the shape of the distribution in question. Accordingly, the first digits in this distribution do not satisfy Benford's law at all. Thus, real-world distributions that span several orders of magnitude rather smoothly like the left distribution (e.g. income distributions, or populations of towns and cities) are likely to satisfy Benford's law to a very good approximation. On the other hand, a distribution that covers only one or two orders of magnitude, like the right distribution (e.g. heights of human adults, or IQ scores) is unlikely to satisfy Benford's law well.[ Broad Ratios of areas not proportional to widths Eg human heights, IQ scores Narrow
 There is no built in max or min values. The numbers are not assigned (like phone nos) The underlying distribution is fairly smooth. More observations of small items than large ones. Data spans several whole numbers on the log scale: * The distribution must be broad rather than narrow * Red area is relative. Prob first digit is 1. Ratios of areas. proportional to widths. Eg incomes. populns. Blue area is relative. Prob first digit is 8. Consider the probability distributions shown below, plotted on a log scale.[12] In each case, the total area in red is the relative probability that the first digit is 1, and the total area in blue is the relative probability that the first digit is 8. For the left distribution, the size of the areas of red and blue are approximately proportional to the widths of each red and blue bar. Therefore the numbers drawn from this distribution will approximately follow Benford s law. On the other hand, for the right distribution, the ratio of the areas of red and blue is very different from the ratio of the widths of each red and blue bar. Rather, the relative areas of red and blue are determined more by the height of the bars than the widths. The heights, unlike the widths, do not satisfy the universal relationship of Benford s law; instead, they are determined entirely by the shape of the distribution in question. Accordingly, the first digits in this distribution do not satisfy Benford s law at all. Thus, real-world distributions that span several orders of magnitude rather smoothly like the left distribution (e.g. income distributions, or populations of towns and cities) are likely to satisfy Benford s law to a very good approximation. On the other hand, a distribution that covers only one or two orders of magnitude, like the right distribution (e.g. heights of human adults, or IQ scores) is unlikely to satisfy Benford s law well.[ Broad. Ratios of areas not. proportional to widths. Eg human heights, IQ. scores. Narrow.")
24
Different Types of Data
Benford-like ? yes yes no yes

25
Winning Lotteries The Massachusetts Numbers Game – State Lottery
1. Bet on a 4-digit number 2. A 4-digit number is generated randomly 3. All winners share the jackpot A Possible Strategy To avoid sharing the prize. Assume entrants pick numbers from their experience (ie not at random) and obey Benford’s law. So pick numbers that are least probable by the Benford-Newcomb law. So start with 9’s and 8’s Evidence (Hill 1988) that numbers ‘randomly’ chosen by people tend to start with low digits
 and obey Benford’s law. So pick numbers that are least probable by the Benford-Newcomb law. So start with 9’s and 8’s. Evidence (Hill 1988) that numbers ‘randomly’ chosen by people tend to start with low digits.")
26
Generalised Benford’s Laws
A random process with probability distribution P(x) 1/x gives Benford data for first digits: P(d)= log[1 + 1/d] Random processes with P(x) 1/xa and a 1 give P(x) = C dd+1 x-a dx = (101-a – 1)-1[(d+1)1-a – d1-a] For a = 2: P(d = 1) = 0.56, P(d = 2) = 0.185, P(d = 3) =0.09, P(d = 9) = 0.012 For prime numbers from 1 to N a(N) = 1/[logN – c] c = large N Replace 10 by b to get other bases Perone et al
 1/x gives Benford data for first digits: P(d)= log[1 + 1/d] Random processes with P(x) 1/xa and a 1 give. P(x) = C dd+1 x-a dx = (101-a – 1)-1[(d+1)1-a – d1-a] For a = 2: P(d = 1) = 0.56, P(d = 2) = 0.185, P(d = 3) =0.09, P(d = 9) = For prime numbers from 1 to N. a(N) = 1/[logN – c] c = large N. Replace 10 by b to get other bases. Perone et al.")
27
A Well-defined Approach to Uniformity by the Primes
Christian Perone a = 1.10

28
Detecting Fraud ‘Natural’ distributions and their combinations should follow Benford Maybe ‘Doctored’ or ‘artificial’ constructions do not ??? Mark Nigrini Univ. Cincinnati PhD thesis (1992) ‘The detection of income evasion through an analysis of digital distributions’ Data from the lines of 169,662 IRS model files follow Benford's law closely. Fraudulent data taken from a 1995 King’s County, New York, District Attorney's Office study of cash disbursement and payroll in business don’t follow Benford's law. The fraudulent or concocted data appear to have far fewer numbers starting with 1 and many more starting with 5 or 6 than do true data.
 ‘The detection of income evasion through an analysis of digital distributions’ Data from the lines of 169,662 IRS model files follow Benford s law closely. Fraudulent data taken from a 1995 King’s County, New York, District Attorney s Office study of cash disbursement and payroll in business don’t follow Benford s law. The fraudulent or concocted data appear to have far fewer numbers starting with 1 and many more starting with 5 or 6 than do true data.")
29
Benford's law can be used to test for fraudulent or random-guess data in income tax returns and other financial reports. Here the first significant digits of true tax data taken by Mark Nigrini from the lines of 169,662 IRS model files follow Benford's law closely. Fraudulent data taken from a 1995 King’s County, New York, District Attorney's Office study of cash disbursement and payroll in business do not follow Benford's law. Likewise, data taken from the author's study of 743 freshmen's responses to a request to write down a six-digit number at random do not follow the law. Although these are very specific examples, in general, fraudulent or concocted data appear to have far fewer numbers starting with 1 and many more starting with 6 than do true data.

30
Forensic Accounting with Newcomb-Benford
Robert Burton, the chief financial investigator for the Brooklyn District Attorney recalled in an interview that he had read an article by Dr. Nigrini that fascinated him. "He had done his Ph.D. dissertation on the potential use of Benford's Law to detect tax evasion, and I got in touch with him in what turned out to be a mutually beneficial relationship," Mr. Burton said. "Our office had handled seven cases of admitted fraud, and we used them as a test of Dr. Nigrini's computer program. It correctly spotted all seven cases as "involving probable fraud." One of the earliest experiments Dr. Nigrini conducted with his Benford's Law program was an analysis of President Clinton's tax return. Dr. Nigrini found that it probably contained some rounded-off estimates rather than precise numbers, but he concluded that his test did not reveal any fraud. He feels your pain

31
President Clinton’s Tax Returns over 13 Years

Similar presentations


. Assigning Probabilities A probability is a value between 0 and 1 and is written either as a fraction or as a proportion. For the.>")


 2. Introduction to algebra 3. Linear and quadratic equations 4. Applications of equations 5. Linear.>")


